auditor: an R Package for Model-Agnostic Visual Validation and Diagnostics
Machine learning models have spread to almost every area of life. They are successfully applied in biology, medicine, finance, physics, and other fields. With modern software it is easy to train even acomplex model that fits the training data and results in high accuracy on the test set. The problem arises when models fail confronted with real-world data. This paper describes methodology and tools for model-agnostic audit. Introduced techniques facilitate assessing and comparing the goodness of fit and performance of models. Inaddition, they may be used for the analysis of the similarity of residuals and for identification ofoutliers and influential observations. The examination is carried out by diagnostic scores and visual verification. Presented methods were implemented in the auditor package for R. Due to flexible andconsistent grammar, it is simple to validate models of any classes.
💡 Research Summary
The paper presents auditor, an R package that offers a comprehensive, model‑agnostic framework for visual validation and diagnostic analysis of predictive models. The authors begin by highlighting a common shortcoming in contemporary machine‑learning practice: while modern software makes it trivial to train complex models that achieve high test‑set accuracy, practitioners often overlook systematic diagnostics that reveal hidden problems such as over‑fitting, outliers, heteroscedasticity, autocorrelation, or influential observations. Traditional evaluation metrics (RMSE, MAE, R², AUC, etc.) capture only a slice of model behavior and can be misleading, as famously illustrated by the Anscombe Quartet.
To address this gap, the authors review existing R tools. Packages such as dataMaid, corrgram, and lumberjack focus on data‑level diagnostics before modeling. The base stats package, car, lmtest, nortest, and related libraries provide a rich set of residual plots, hypothesis tests, and influence diagnostics, but they are largely confined to linear or generalized linear models. More recent visual‑oriented packages like ggfortify, autoplotly, and hnp generate diagnostic graphics for a broader range of models, yet they either lack support for tree‑based ensembles or provide only a single type of plot and are not built on a unified grammar.
auditor fills this niche by delivering a consistent, pipeline‑style API that works with any predictive model returning numeric predictions. The central function, audit(), wraps a fitted model together with its training data, predictions, and residuals into an “audited” object. From this object, users can call score() to compute a suite of quantitative diagnostics—including traditional performance measures (RMSE, MAE, R², AUC) and model‑assumption checks (residual autocorrelation, heteroscedasticity, Cook’s distance, half‑normal goodness‑of‑fit). Each score is returned as a tidy data frame, enabling seamless integration with the dplyr workflow.
Visualization is handled by the generic plot() function, which accepts a type argument to select among more than a dozen plot categories, all rendered with ggplot2. The available visualizations include:
- Residual diagnostics – residual vs. fitted, residual density, residual box‑plot, autocorrelation function (ACF), residual correlation heatmap, principal‑component analysis (PCA) of residuals, and half‑normal plots.
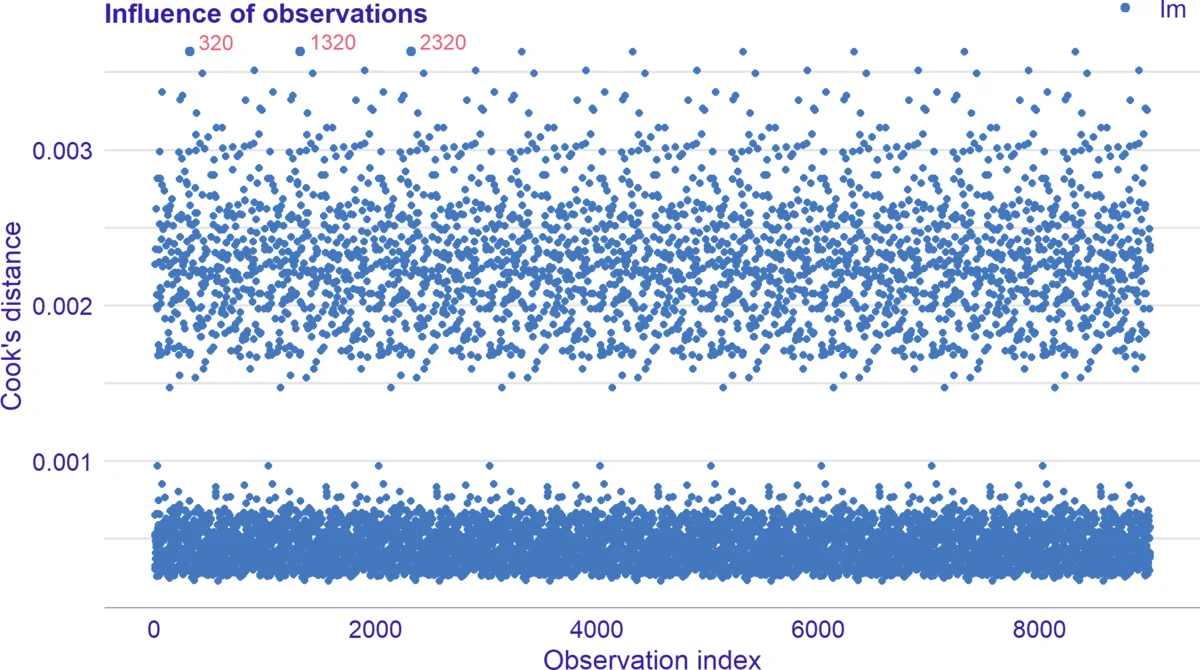
- Influence diagnostics – Cook’s distance plots, leverage vs. residual plots, and bubble plots that encode influence magnitude.
- Performance curves – ROC, precision‑recall (PR), lift charts, cumulative gain (REC) curves, and radar charts for multi‑model ranking.
For interactive exploration, the package provides plotD3(), which produces Plotly/D3‑based versions of the same graphics, preserving the ggplot2 aesthetic while adding hover tooltips and zooming capabilities.
The architecture is deliberately modular: new model classes can be supported by implementing a single add_audit() method that extracts predictions and residuals, after which the full suite of scores and plots becomes immediately available. This design mirrors the model‑agnostic philosophy of the DALEX package, which the authors reference for variable‑importance and partial‑dependence visualizations.
The authors demonstrate the utility of auditor through several case studies. Using the Anscombe Quartet, they show that four datasets with identical summary statistics produce nearly identical linear regression coefficients, yet the residual plots generated by auditor reveal starkly different error structures, underscoring the necessity of visual diagnostics. Additional examples with random forests and XGBoost models illustrate how the package can detect heteroscedastic residuals, autocorrelated errors, and a handful of observations exerting disproportionate influence—issues that would remain hidden if only aggregate metrics were examined.
In conclusion, auditor offers a unified, extensible, and user‑friendly toolkit that bridges the gap between statistical diagnostics traditionally reserved for linear models and the needs of modern, black‑box machine‑learning algorithms. By coupling quantitative scores with rich, customizable visualizations, it empowers data scientists to conduct thorough model audits, compare competing algorithms on a common footing, and make informed decisions about model selection, data cleaning, and hyper‑parameter tuning. Future work outlined by the authors includes extending residual definitions to non‑numeric outcomes (e.g., survival or multi‑label classification), scaling computations for big‑data environments, and integrating the package into Shiny dashboards for real‑time model monitoring.
Comments & Academic Discussion
Loading comments...
Leave a Comment