The Divergence Between Industrial Infrastructure and Research Output among the GCC Member States
Authors: Osman Gulseven, Abdulrahman Elmi, Odai Bataineh
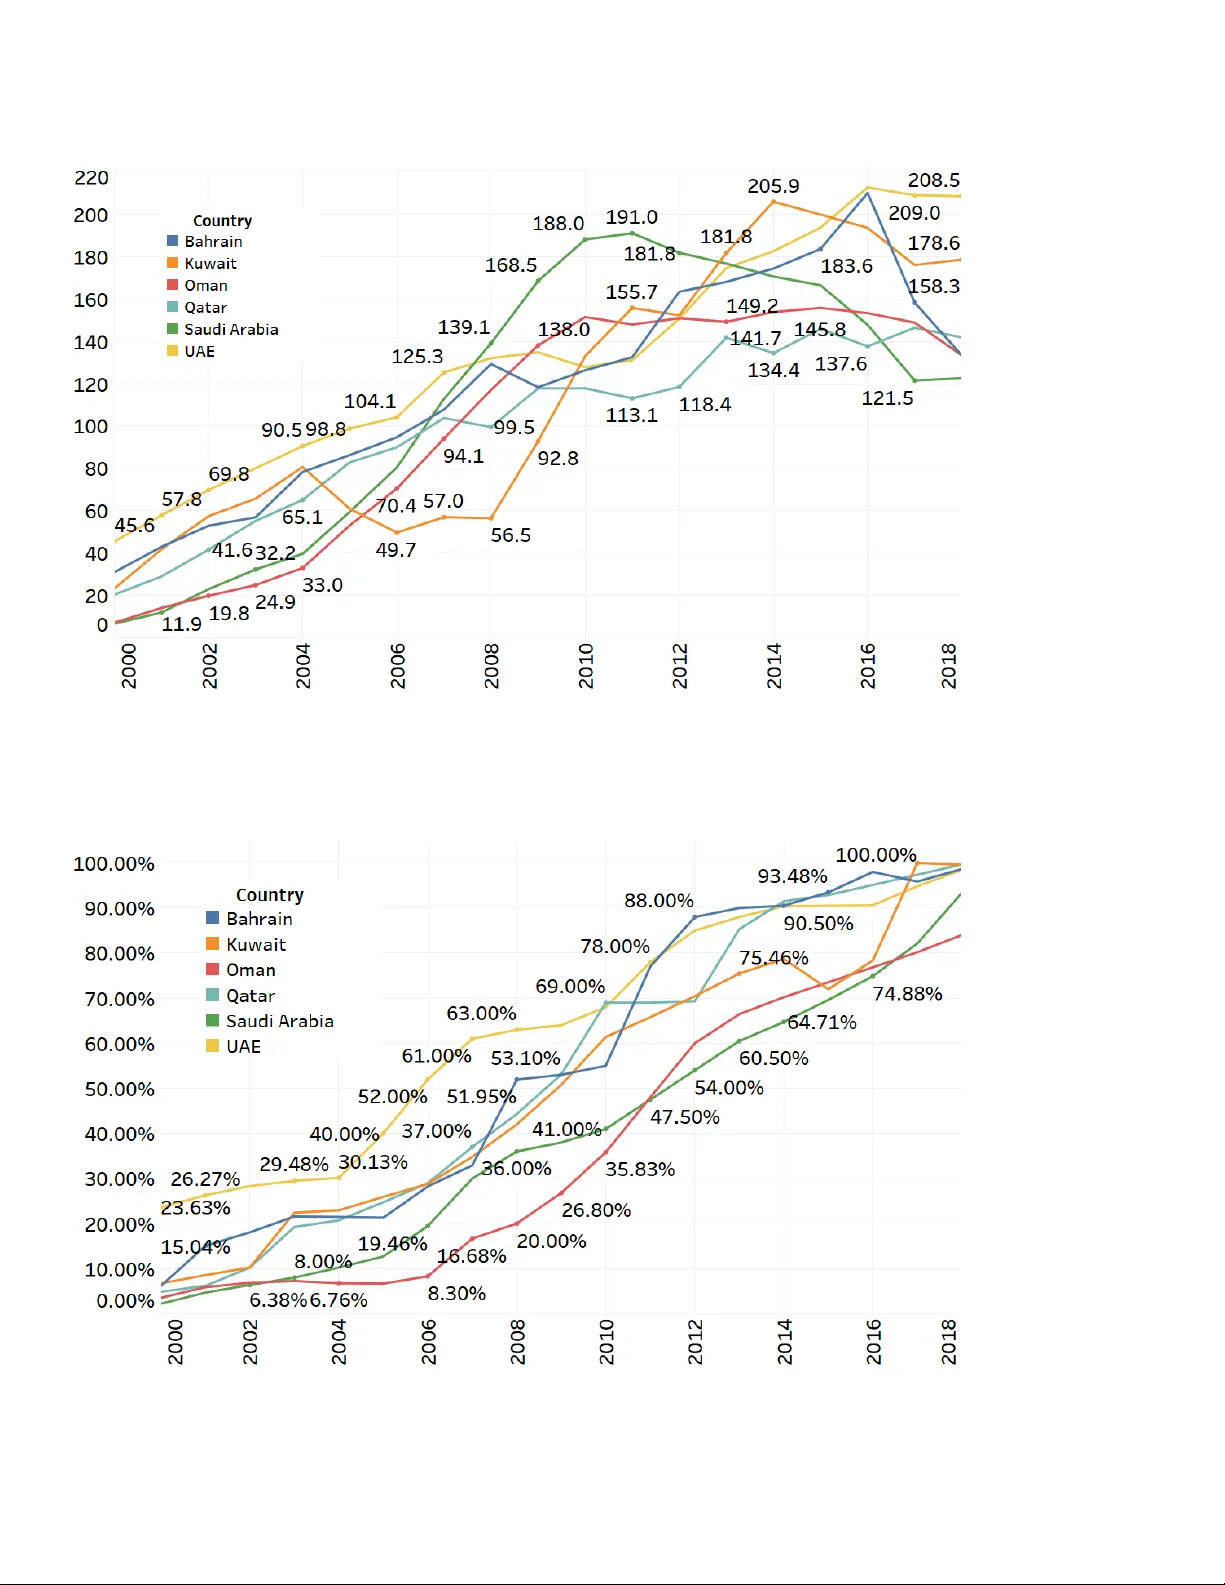
International Journ al of Business & Ap plied Sciences Vol. 9 No. 2, pp. 21 - 32 (20 20 ) ISSN: 2165-8072 (Onl ine); 2471-8858 (Print) IJBAS Vol. 9 No. 2 (20 20) The Divergence Be tween Industr ial Infrastructure and Research Output am ong the GCC Member St ates Osman Gulseven*, Abdulrahman Elmi, Odai Bataineh In this article, we p rovide a co mparative analysis of the indu stry, communication, and research infrastructure among the GCC member states as measured by the United Na tions su stainable development goal 9. S DG 9 p rovides a clear framework for measuring the performance of natio ns in achieving sustainable industrialization. Three pillars of this goal a re defined a s quality logistics and efficient transportation, a vailability of mobile-cellular network with high - speed internet access, a nd quality research output. Based on the d ata from both th e United Na tions’ SDG database and the Bertelsmann Stiftung SDG -index, our results suggest that while most of the sub -goals in SDG 9 are achieved, signif icant challenges remain ahead. Notably, th e research output o f the GCC member states is not in par with that of the devel oped world. We suggest the GCC decision-makers initiate national and supranational research scheme s in ord er to boost rese arch and development in the region. Keywords: Sustainable Development, SDG 9, Infrastructure, Industry, I nnovation, Research, GCC, Gulf Cooperation Council Introduction The Millennium Declaration sig ned in 2000, stipulated eight Millennium Development Goals (M DGs) to be achieved by 2015 (WHO, 2000). These go als un ited th e wo rld leaders in combating poverty, hunger, and environmental degradation. Research suggests that significant success was achiev ed in providing social welfare and qu ality healthcare facilities (WHO, 2000; Liu et a l. , 2016; Gómez-Olivé and Thorogood, 2 018). Ho wever, major issues remained in tact, particularly in terms of sustainable development, which still rem ains as a major ch allenge (Liew, Adhity a and Srinivasan, 2014) . A primary challenge in measuring sustainable development is to provide indicator-based targets where business es , civic, and government bodies can work on togeth er (Scheyvens, Banks and Hughes, 2 016; Allen et al. , 2017). The n ew UN agenda received a considerable demand for su ch issues. Following these requests, the UN n ations held a meeting in 2015, declaring th e 17 Su stainable Development Goals (SDGs) to be achieved by 2030 (Brende and Høie, 2015) . Known as the UN Resolu tion 700/1, these SDGs are intended to provide a sustainable futu re for generations to come. While many of th ese targets were expected to be accomplished by 2030, some of the targets were ambitio usly set to be achieved as early as 2020. There was some ambigu ity in ho w to measure the achievements towards attaining those SDG s. Therefore, a n addendum was later ame nded to the o riginal declaration where , each SD G was defined in several sub -goals, and each sub-goal had several indicators. Finally, a total of 169 targ ets to b e measured by 232 unique indicators are defin ed in the updated SDG declaration. The 17 SDG s are d efined as no p overty (#1 ), zero hunger (#2), good health and we llbeing ( #3), quality education (#4), gender equality (#5), c lean water and san itation (#6), af fordable and green energy (#7), decent work and economic growth (#8), industry, innovation, and infrastructure (#9 ), redu cing inequality (#10), sustainable cities and communities (#11), responsible co nsumption and production (#12), climate action (#13), life below water (#14), life on land (#15), peace, justice, and strong institutions (#16), partnerships for the goals (#17). Dr. Osman Gulseven *, Associate Professor, Skyline University College, UAE , osman.gulsev en@skylineunive rsity.ac.ae . Abdulrahman Elmi , MBA Student , Skyline University College, UAE abdulrahman.el mi@gmail.com Odai Bataineh , MBA Student , Skyline Univers ity College, UAE odaibataineh9 1@gmail.com One intern ationally known ranking system is in troduced by the German fo undation Bertelsmann -Stiftun g (Lafortune et al. , 2019) . Known as the BS-SDG index, their database compiles data on several in dicators for each sub-goal, making it fair and a simple process to compare national ac hievements within UN members. The measurement of metrics and methodology beh ind th is ranking system ha s its drawbacks, yet the BS -SDG index is one of th e very few metrics that offer a ranking o f countries (Miola and Schiltz, 2019). According to BS-SDG rankings, the Nordic-European countries such as Denmark, Sweden, and Finland are rank ed as the most sustainable, whereas poor sub -Saharan African nations are at the botto m of th e sustainability list. While there is a strong positive correlation between in come p er capita and su stainability achievements, th is is n ot true for most of the Arab countries – particularly member states of the Gulf Cooperation Council. GCC member states (Bahrain, Kuwait, Qatar, Oman, S audi Arabia, and UAE) have d istinctively low sustainability scored compared to other high-income countries according to the BS-SDG index ranking. The 2019 ranking puts the United Arab Emirates (UAE) as the top-performing GC C member with a score of 69.7 and a global rank of 65 out of 162 countries. Bahrain h as a score of 68.7 and is ranked 7 6 th globally. Oman and Qatar ha ve scores of 67.9 and 66.3 and are ranked 8 3 rd and 91 st globally. Saudi Arabia has a score of 64.8 and ranked 98 th , wh ereas Kuwait is the worst performer among GCC countries with a score of 63.5, and it is ranked 1 06 th . Only two of the 17 SDGs are achieved by GCC countri es, namely no poverty (S DG 1) and reduced inequalities (SDG 10). UAE has also achieved SDG 17, partnerships for the goals . One of the main reasons for the low sustainab ility profile of GCC member countries is the composition of their economic activities. The Gulf region contains the largest proven oil reserv es in the world, and as such , th ese countries are among the top oil producers in the world. The wealth attained by oil production has caused a con sumption spree among th e newly found rich and middle class. The con sumer and env ironmental awareness in this part of th e world is not in par with th at o f the European countries. This exp lains the reason for deficient scores in Responsible consumption and production (SDG 12 ) , Climate Action (SDG 13) , Life below water (SDG 14) , Life on land (SDG 15). However, GCC countries also received low scores in the industry, innovation, and infrastructure dimensions (SDG 9 ). This is q uite surprising as these co untries hav e strong industrial ambitions and are known to host business-friendly free zones with 22 IJBAS Vol. 9 No. 2 (20 20) no income taxes. In this article, we are analyzing th e performance of GCC member states in ter ms of achieving the sustainable development go al SDG 9. We have chosen to analyze SDG 9 since innovation and industrial infrastructure are leading indicators for forecasting future economic performance. Our research question is whether the economic leap observed in the GCC cou ntries is supported by their achievements in innovation and industrial infrastructure. Literature Review on SDG 9 Sustainable development g oals became p illars of achievements around the globe. Each goal is un ique, but achievement towards one goal is also related to achievem ents towards o ther goals . This relationship can be in either positive or negative ways (Allen, Metternicht and Wiedmann, 2 018; Amin -Salem et al. , 2018). For example, improvements in economic conditions can simultaneously reduce the i nequality within society wh ile combatting hunger and poverty. Digitiza tion and impro ved technological in frastructure can help to achiev e both SDG 3 and SDG 9 (Novillo-Ortiz, De Fátima Marin and Saigí-Rubió, 2018) . However, b esides synergies, trade-offs are possible. If the improvement in economic condit ions happens due to natu ral resource extraction at excessive rates, it might also deteriorate natural life on land as well as below water. Fighting against climate change is an essential step, but it might mean giving up on carbon - based industrial output for several countries (Campagnolo and Davide, 2019). More research supported with big -data needs to be conducted for a fair assessment of the countries in terms of their achievements towards sustainability (Fullman et al. , 2017; Requejo-Castro, Giné-Garriga and Pérez-Foguet, 2020) . While significant research is done in the bioeconom ic aspects o f the SDGs, very few research is committed to analyzing the role o f innovation and infrastructure in achieving sustainable development. One of the reasons is because SD G 9 is somewhat seen as an imped iment to achieving success in other SDGs – particularly by b ioeconomists. Vin ueasa (2020) suggests that innovations such as artificial intelligence can inhibit 58 of the UN SDG targets. Ermg assen et al. (2 019) emphasize th at the g lobal infrastructure boom shall not turn into a zero -sum game where achievement in SDG means deteriorating life b elow water and on land. Another research on the correlation o f SDGs suggest s that there might b e significant trade-offs between several SDGs in Europe. Accord ing to Ronzon and Sanjuan (2020), there is a 41% negative correlation between SDG 9 and SDG 14 (life b elow water). S DG 9 is also negatively related to SDG 2 , zero hung er (37%), and SDG 12 , responsible consumption and production (37%). However, syn ergies are also o bserved b etween SDG 9 and other SDGs. A recent report by PricewaterhouseCoopers (2019) suggests that the introduction of SDGs can bring significant challenges as well as opportunities for the global business. According to PwC, the global b usinesses has the highest potential contribution to SDG 9 b y building resilient infra st ructure and promoting inclusive, sustainable, and in novative in dustrialization activities. The same report suggests th at th e mobile communication industry is driv ing force behind ac hieving a c onnect ed world, which h as universa l coverage. Apfelbaum (2018) suggests that the mobile ind ustry is accelerating the delivery o f SD Gs globally. This unprecedented connection between hu man society h as driven new bu siness models, p articularly in areas such as mob ile banking and social media. Th e transportation sector is also a significant contributor to global gro wth by co nnecting the econ omies, and reducing the trad e costs while promoting regional integration. Th is is also emphasized in the OECD report (2018), which emphasizes the role of transport infrastructures such as lon g-distance road s and railways, international ports, and airports. Th ese are needed to move products, and p eople a round, thereby b oosting t he trade amon g countries. Montes (2017) suggests that SDG 9 is a re-introduction of industrialization into the sustainable development agendas of developing countries, which differ in terms of their p opulation, per capita income, and economic structure. For developed countries , SDG 9 emphasizes clean production syst ems where carbon emissions affect th e ir achievement scores negatively. The author also claims th at the pro-active industry-government p artnership is essential to achieve this goal while con sidering aspects of inequality an d sustainability. Several authors recommend similar private-public collaborations to achieve sustainable economic development (Gulseven and Mo stert, 2017; Gulseven et al. , 2 019; Hossen, 2020) . There are several examples where re -thinking industrial growth and proving innovative solutions can boost several SDGs simultaneously. According to Karnama et al. (2019), high- performance computing centers can be redesig ned to p rovide the heat needed for organic food production in g reenhouses. The authors point out that by creating this synergy b etween computing centers and greenhouses, it is possible to progress towards at leas t 5 of the 17 SDGs, including SDG 9. The in creased use o f mobile apps in healthcare monit oring and services has b oosted productivity in th e healthcare industry. Thus, having a better mobile co verage not only improves the industry infrastructure (SDG 9) but can also boost the qu ality of h ealth care (SDG 3) in a country (Makri, 2019) . Engineering applications – particularly those aimed at improv ing the life cycle of consumer products can improve most of the SDG ind icators (Hauschild, Laurent and Molin, 2018) . Research in b ioactive compounds can also p ositively impact both SDG 3 and SDG 9 (Laraia, Ro bke and Waldmann, 2018) . All in all, there is a co nsensus view th at suggests in clusive an d sustainable industrial development is the primary source o f income generation, which is needed for a sustain ed increase in community living standards . As such, su stainable industrialization and innovation indicators are designed to measure th e level of transportation infrastruct ure, connectivity among society, a nd research & development activities. The following table lists the UN defined sub-goals and indicat or s for SDG 9. While some non-academic work has b een done on sustainability initiatives in the GCC, there is a shortage of academic work in measuring the performance of these coun tries in achieving SDGs. Our research adds to the literature by analyzing th e performance of GCC state s towards achieving sustainable development goal # 9, industry, innovation, and infrastructure , which is among the low performing SDGs in the region. Data We retrieve data from the UN Sustainability database. The UN provides a comprehensive database to measure country-wide indicators in achieving SDGs. The SDG handbook also offers a detailed overview of th e available data. The UN statistical handbook is produced according to the availability of data in National Statistical Systems. Th e h andbook i s still at the development stage, with n ew d ata indicators added to the list o f SDG ind icators database wh enever they are available. Ho wever, many indicators are defined without paying attention to their availability. Therefore, so me of the data were missi ng. As of December 2019 , the currently available in formation about the indicators is visualized and discusse d below. All visualizations are conducted using Tableau software (v2019.1). 23 IJBAS Vol. 9 No. 2 (20 20) Table 1. UN Defined Sub Goals and Indicators for SDG 9 Industry, Innovation, and Infrastructure Sub -Goal Summary Indicators As Defined by the Original Declaration To be achieved by 9.1 Develop sustainable, resilient and inclusive infrastructures 9.1.1 Road access for rural populations 9.1.2 Passenger and freight volumes 2021 9.2 Promote sustainable industrialization 9.2.1 Manufacturing value 9.2.2 Manufacturing employment 2021 9.3 Access to financial services and markets 9.3.1 Value of small-scale industry 9.3.2 Small-scale industries with affordable credit 2030 9.4 Resource Efficiency 9.4.1 CO2 emissions per unit value-added 2030 9.5 Scientific Research 9.5.1 R&D spending 9.5.2 Researchers per million inhabitants 2030 9.A Aid for sustainable development in developing countries 9.A.1 Development assistance for infrastructure 2030 9.B Support domestic development and industrial diversification 9.B.1 Medium and high-tech industry 2030 9.C Universal access to information and communications technology 9.C.1 Development assistance for infrastructure 2021 Target 9.1: Develop sustainable, resilient, and in clusive infrastructures. SDG Indicator 9.1.1: Road access for rural populations SDG reports do not p rovide any information regarding this indicator. In developed countries, th is is most likely to b e around 100%, but there could be a wide variety in developing countries. A better indicator could h ave been the length of asphalt roads per capita. SDG Indicator 9.1.2: Passenger and freight volumes While there are several d ifferent ways to move p assengers and freight, the most robust indicators are about air transport. Thanks to strict rules and statisti cal d ata availabil ity, the data on air freigh ts and air passengers are maintained well . The UN d efines air freight as the volume of freight bags carried on each flight stage (operation o f an aircraft fro m takeoff to its next landing), measured in metric to ns’ times kilometers traveled. As can b e seen in Figure 1, the UAE is leadin g the GCC in terms of freight by air transport. In 2018, th is indicator fo r UAE was 16 616 million ton -km. Qatar also leaped in the last d ecade. In 2018, the freight by air tran sport in dicator was 12667 million ton- km for Qatar. Both of these countries have major g lobally known airlines supported by large airport bases. Saudi Arabia had o nly 1085 million ton-km freight, although it is the most populated country in the GCC. Air passengers carried per year refers to both domestic and international aircraft passengers of air carriers registered in th e country. This indicator denotes the number of passengers carried by airlin ers registered in a giv en country and is independent of the nationality of individual passengers. GCC countries host significant amounts of expatriat e workers. There are also major airlines making a stopover at th e major air h ubs. Consequently, air traffic in th is region is among the h ighest in the world, as can b e seen in Figure 2 . The number of air transport passengers carried ha s also increased substan tially in the last d ecade. In the UAE alo ne, 9 6 million passengers were carried in 2018. This number is 39 million for Saudi Arabia, and 29 million fo r Qatar. Oman also supported significant air passengers amounting to 10 million people in 2018. The data also shows that Bahrain and Kuwait are not well -known in the airport traveling business. Target 9.2: Promote inclusive and sustainable industrialization. SDG Indicator 9.2.1: Manufacturing value UN defines th e manufacturing v alue-added as the net ou tput of a sector after adding up all outputs and subtracting in termediate inputs in manufacturing produ ction. This indicator is measured as a percentage of the total GDP within the economy. Manufacturing value = Manufacturing GDP Total GDP Figure 3 shows the progress towards this target, which is measured by measuring th e perc entage of m anufacturing value- added in GDP and per capita. There is a wide range in this indicator among the GCC countries. The UN p rovided by World Bank development indicators su ggests that Bahrain is the most industrialized nation in GCC with a manuf act uring GDP ratio of 18%. Bahrain is a small state but r uns a mega-sized petr oleum refinery, which might be the reason for this high ratio . However, Kuwait also several mage-capacity re fineries, but it is the least industrialized with a manufacturing GDP ratio of 7% -8%. Those numbers are high ly dependent on ho w manufacturing is defin ed. It is also possible that the growth in other sectors of GDP has reduced the role of manufacturing in these economies. SDG Indicator 9.2.2: Manufacturing employment UN defines manu facturing e mployment as all person s o f working age who , d uring a sp ecified b rief period, were in p aid employment (whether at work or with a job but not at work) or in self-employment in a sector categorized as ma nuf acturing. This indicator is measured as manufacturing GDP to total employment. Manufacturing employment = Manufacturing employment Total employment Figure 4 shows the p rogress of GCC countri es as measured by the proportion o f employment in manufacturing out o f total employment. The data suggests Qatar has made a leap in the last two d ecades, and this indicator curren tly stands at 54%. Oman also made a signifi cant leap with a manufacturing ratio of 36% , followed by Bahrain, which has a manufacturing employment share of 35%. The manufacturing strategy of GCC countries should focus on cross-cutting competencies, vocational training in specific manufacturing sectors, SME linkage programs , and foreign d irect investment. We b elieve that this ind icator can not be used to measure the infr astructure in an economy. Investment nowadays means more than old-type manufacturing equipment. Human capital investment is a better indicator. 24 IJBAS Vol. 9 No. 2 (20 20) Figure 1 . Air Transport, Freight (million ton-km) Fi gure 2 . Air Transport, (passengers ca rried) 25 IJBAS Vol. 9 No. 2 (20 20) Figure 3. Manufacturing value added % of GDP Figure 4. Employment in industry (% of total employment) 26 IJBAS Vol. 9 No. 2 (20 20) Target 9.3: Increase access to financial services and markets. SDG Indicator 9.3.1: Value of small-scale industry The UN data do es not provide any in dicators regarding the access of small-sc ale in dustry to financial services and markets. This indicator is defined as follows: Value of small − scale industry = small − scale in dustry Total industry Achievement of th e target is measured by measuring the share of small industries in the total value added in th e industry. To this end, GCC countries have ambitious public incentives for in novative startups to in clude industrial compa nies with a more significant share in R&D programs. SDG Indicator 9.3.2: S mall-scale in dustries with affordable credit The UN database does not provide any d ata on this indicato r which is defined as follows: Value of small − scale industry with affordable credit = small − scale industry with debt Value of small − scale ind ustry Progress in the targ et is measured by measuring the proportion of small industries that have a line of credit . Some GCC cou ntries focused on improving bank gu arantee pro cedures fo r small and medium-sized enterprises (SMEs) to obtain low-interest lo ans. For example, in the UAE , the Green Develop ment Strategy emphasize d the role of small and medium enterprises in developing the economy. Target 9.4: Upgrade all industries a nd in frastructures for sustainability. SDG Indicator 9.4.1: CO2 emissions per unit value-added This indicator aims to measure th e carbon intensity of the economies. Carbon dioxide (CO₂) intensity o f economies is measured in kilogram s of CO₂ p er $ of GDP (measured in international-$ in 2011 prices). It is calculated as follows: CO2 emissions per unit value added = Total carbon emissions in kilogram 𝐺𝐷𝑃 𝑝𝑒𝑟 𝑐𝑎𝑝𝑖𝑡𝑎 𝑚𝑒𝑎𝑠𝑢𝑟𝑒𝑑 𝑖𝑛 2 011 𝑑𝑜𝑙𝑙𝑎𝑟𝑠 This goal aims to motivate the businesses to upgrade infrastructure in order to make them more su stainable, with fewer carbon emissions. Th is will require increased resource-use efficiency. It will also promote companies to apply clean and environmentally sound technologies a nd industrial processes. However, in this part of the world, carbon is still at the core of the economic activities. It is th e oil and gas reserves that b rought the riches into GCC, and t hese source s continue to be the prima ry revenue source for the governments. Figure 5 suggests that the carbon emission intensity of the Bahrain economy is the highest. The recent data on CO2 emissions per econ omic activity was 0.53 kilograms per each dollar of GDP. Bahrain does not have much oil. Howeve r, it runs a mega-scale refinery with Saudi Arabia, wh ich is the reason for the high carbon intensity. Other countries in GCC are also carbon -intensive economies with ratios ranging from 0.35 to 0.39 kilograms of CO2 per each do llar of GDP. Th e persistence of carbon intensity is also another primary concern among th ese countries. The carbon footprint per economic activity around the world is declining , but this is not the case for GCC member states. Target 9.5: Enhance research and upgrade industrial technologies. SDG Indicator 9.5.1: Research and Development (R&D) spending Research and Development (R&𝐷 ) 𝑠𝑝𝑒𝑛𝑑𝑖𝑛𝑔 = Spending on research and development GDP The UN defin es the expenditures on research and development as the current and capital expend itures on creative work undertaken to increase kn owledge of the society. As such, it includes basic research, applied research, and experimental development . Progress in achieving the targ et is measured b y R&D exp enditure as a percentage of GDP. Sp ending o n research and d evelopment as a share o f GDP in UAE was 0. 96% of GDP in 2016. Saudi Arabia has recently started allo cating sign ificant financial sources for R&D. The last available data for Saudi Arabia indicates 0.82% of its GDP was spend on R&D. Qatar is also catching up with them with a ratio of 0.5%. However, other GCC member states h ave very lo w R&D spending ratios , abou t 0.08% to 0.22%. Figure 6 sh ows that R&D spending is meager in GCC countries . SDG Indicator 9.5.2: Researchers per million inhabitants Progress in achieving this targ et is measured by the numbers of researchers located in individual states. UN defines researchers in Research & Development (R&D) as professionals engaged in the creation of new knowledge. Besides faculty members, postgraduate Ph .D. students are also included in the calculation of this indicator. Figure 7 on the number of researchers sho w a wide rang e of differences between GCC members. The World Bank data sug gests that Oman has only 2 44 researchers, and Kuwait has 492 researchers, whereas UAE hosts 2407 re searchers per million people. H owever, the research output does not support those numbers, which renders them somewhat arbitrary numbers. Kuwait University alone hosts 1 600 academic staff and 2 200 postg raduate students. It is very likely t hat the variation in w hat is called a researcher is the reason for such difference. T here is an in creasing emphasis on boosting the n umber of researchers work ing in the government and private sectors. In the future, it is expected that the next generation of researchers will also be employ ed in research and development in manufacturing. Target 9. A: Facilitate sustainable infrastructure development for developing countries. SDG Indicator 9.A.1: Development assistance for infrastructure While GCC members are among the large aid donors, the data is not Target 9.B: Support domestic techno logy d evelopment and industrial diversification. SDG Indicator 9.B.1: Medium and high-tech industry Progress in achieving the target is measured by the p ercentage of v alue-added of the medium and adv anced technological industry of total v alue-added. This is an indicator aimed at measuring whether the economy is moving to wards high-tech industries or whether they are stalling with low tech, low productivity activities. The UN defines this indicator as the proportion of mediu m and high-tech industry (MHT) value-added as a percentage of total manufacturing value. Higher values indicate that a country's industrial sector is focused on medium to high-tech manufacturing . The values for GCC countries rang es between 20% (Oman) to 50% (Qatar). Ho wever, th is indicator does not mean that GCC coun tries are hig h-tech countries. This indicator includes petrochemicals and construction industries in this category. Both of these medium-tech industrial categories are important for the region. That is wh y this indicator is quite high among GCC member states. Figure 8 suggests that the GCC countri es need to focus on capacity building in the industry by promoting foreign direct investments b y multinational corporations as well as suppo rting SMEs focused on high-tech companies. Target 9.C: Access to informatio n and communications technology. SDG Indicator 9.C. 1: Pro portion of p opulation covered b y a mobile network This indicator measures the level of access to mobile communication networks, which includes cellular subscriptions as well as % of the population h aving access to the internet. The UN defines an individual who used the internet in the last three months 27 IJBAS Vol. 9 No. 2 (20 20) Figure 5. CO2 emissions (kg per 2011 dollar of GDP- PPP) Figure 6. Research and Development Expenditure (% of GDP) 28 IJBAS Vol. 9 No. 2 (20 20) Figure 7. Researchers in R&D (per million people) Figure 8. Medium and high-tech industry (% manufacturing value-added) 29 IJBAS Vol. 9 No. 2 (20 20) as In ternet users. The Internet can be used via any means. In GCC, internet access through mobile and optic- fiber subscriptions are fast and reliable. Figure 9 shows d etails on mobile subscriptions. Many ind ividuals use more than o ne mobile subscription for the service, whether th at is prepaid or postpaid. The h ighest mobile cellular subscription is in UAE (208.5 per 100 people) , whereas the lowest su bscription rate is in Saudi Arabia (121.5 p er 100 people). Internet usage is also quite high an d reached almost 100% for all GCC me mbers except Saudi Arabia and Oman. Figure 10 suggests that there is convergence to 100% internet access, and these countries also likely reach the 100% target soon. Analysis: Comparative GCC Performance on Achieving SDG 9 While the UN declaration did not specify any methods to rank the countries, there is a significant interest in performing comparative analy sis among countries. OECD and Eu ropean commission have their ranking system for measuring progress towards SDGs. One ranking methodology that offers global coverage is created by Bertelsmann Stiftung (BS). This is a no n- profit research organization h eadquartered in Germany. They introduced the BS-SDG in dex in 2015. Since then , BS -SDG h as become an industry-standard method in measuring and comparing performance towards SDG attainments (Lafortune et al. , 2019) . Th e indicators used in the BS -SDG index are chosen based on both their availability and robustness. There are also minor updates on indicators every year based on new research conducted. The latest report suggests six indicators for measuring performance in SDG 9, industry, innovation, and infrastructure . These indicators are briefly analyzed as follows: Population using the internet (% - sdg9_intuse ) The UN d efines this i ndicator as the p ercentage of the total population who used the internet from any location in the last three months via a mobile network . The so urce of this information is the World Development Indicators prov ided by the World Ban k. BS defines this indicator in the same way as the UN. Mobile broadband subscriptions (p er 100 inhab itants - sdg9_mobuse) The UN d efines this i ndicator as the percentage of the total population who used the internet from any location in the last three months via a mobile network. Similar to th e p revious ind icator, the source of this information is World Development Indicators provided by the World Bank. BS also defines this indicator in the same way as the UN. Logistics performance index (sdg9_lpi) This indicator is aimed at meas uring the logistics infrastructure and is different from the UN indicators. While th e UN measures the qu ality of logistics infrastr ucture in terms of th e number of passenger numbers and freight volume, this in dicator is based on the quality of trade and transport-related infrastructure. This is a survey-based assessment of the quality of trade and transport- related infrastructure, including information technology, o n a scale from 1 (worst) to 5 (best). The Times Higher Education Universities Ranking (sdg_qs) This is anoth er indicato r aimed at measuring resea rch performance and academic quality of h igher education institutions in a country. While the UN measures the research and development in terms of research spending, this ind icator directly measur es the quality of the research conducted in the country. Known as THE rankings, this indicator ev aluates th e qu ality o f the top 3 higher ins titu tions located in the host country. The nu mber of scientific and technical journal articles (per 1,000 population - sdg9_articles) This indicator is aimed at measu ring the academic performance of the re searcher in a country. Precisely, it is c alculated a s the number of scientific and technical journal articles published that are covered by the Science Citation Index (SCI) or the So cial Sciences Citation Index (SSCI) based on the institutional address(es) listed in the article. The data is reported per capita. Research and development expenditure (% GDP - sdg9_rdex) The UN defines this indicator as to th e domestic expenditu re on scientific research and exp erimental development (R&D) expressed as a percentag e o f Gross Do mestic Product (GDP) . The source of this information is also World Development Indicators provided by the World Bank. BS also defines this indicator in the same way as the UN. CO 2 emissions per unit of manufacturing value-added (sdg9_coemva) BS defines this indicator as carbon dioxide emissions per unit of manufacturing value-added (kilograms of CO2 p er constant 2 010 US$) . This is a lmost in line with the UN definitio n. However, while the UN in cludes this in its annu al report, BS does not includ e this data in its global coverage reports. It is only included in the recently initiated regional SDG report on Arab countries (Luomi et al. , 2019). However, some of the o bservations in this d ata d o not make sense (such as O man being the most carbon intense country) ; therefore, we decided not to report the numbers on this indicator. The recent regional S DG repo rt on Arab regions also suggests that while there are significant challenges in the GCC region, all six countries are improving their infrastructu re and investing more resources towards research an d development. The latest data on each o f th e above-listed indicators as defined by BS can b e seen as in Table 2 below: These n umbers agree with the BS region al report on Arab states that GCC cou ntries are among the higher performers in achieving SDG 9. We found that the GCC countries are on track or maintain the ir SDG achievements in S DG9. Co mmunication and network infrastructure are robust. Each country has at least two telecommunication and h igh-speed intern et service p roviders. One development strategy introduced in the UAE and followed by other GCC members is to establish free zones attached to mega-sized seaports and airports within the country. This strategy allo wed th e free zon es to become commercial trading centers, thereby boo sting the economies of the host countries. A significant portion of th e wealth gained by carbon -based natural capital has been invested in the education sector. Education is a highly profitable sector in GCC. Besides flagship national universities, GCC coun tries host several priv ate colleges an d universities. For example, there are more than 100 higher education institutions in the UAE alon e. Most of these higher education institutes are connected with well-known international establishments in the Western world. Thus, universities play a significant role in b oosting research and development within the GCC coun tries. However, in terms of publications, the academic output in GCC is well behin d the g lobal av erage. This is partially due to th e lack of academic fund ing in this p art of the world , which is also reflected in th e low ratio of R&D expenditures as a percentage of GDP. Discussion and Policy Suggestions In this article, we analyzed the performance of GCC countries in achieving the SDG 9, industry, innovation, and infrastructure. Each SDG has subgoals to be measured by at least one indicator. The UN declaration for SDG 9 defined eight subgoals to be measured by 12 indicators. However, th ere was some ambiguity in the indicators d efining some of the subgoals. Th er efore, we also collect information from the BS-SDSN database. SDG 9 data on both the UN and BS -SDSN databases emphasis the role of industrial infrastructure, internet, and mobile connectivity, as well as the research and development activities. Based on the cross- 30 IJBAS Vol. 9 No. 2 (20 20) Figure 9 . Mobile Subscriptions (per 100 people) Figure 10. Individuals Using the Internet (% of Population) Table 2. BS -SDG Indicators 31 IJBAS Vol. 9 No. 2 (20 20) Indicator GCC Countries Global Values Bahrain Kuwait Oman Qatar Saudi Arabia UAE Mean Min Max sdg9_intuse 95.9% 98% 80.2% 95.9% 82.1% 94.8% 52.2% 0 98.9% sdg9_mobuse 146 127.3 93.9 127.2 90 243.4 61% 0 243% sdg9_lpi 2.7 3 3.2 3.4 3.1 4 2.7 1.6 4.4 sdg_qs 14.2 22.5 22.5 39.4 43.9 36.8 16.8 0 94.3 sdg9_articles 0.1 0.2 0.2 0.5 0.3 0.2 0.4 0 2.5 sdg9_rdex 0.1 0.4 0.2 0.5 NA 1 0.7 0 4.3 comparison of the available d ata on SDG9, we can state the biggest strength of the GCC member states on achieving progress to wards SDG 9 is logistics performance, internet, and mobile infrastructure. There is high competition among GCC member states to retrieve as much fo reign investment as possible. Th ere are als o increasing emphasis to u tilize the harsh weather conditions in favor of tourism, particularly during the winter mo nths, when the weather is pleasant and a llows for all ki nds of outdoor a ctivities. Each country ho sts several free zones that are directly c onnected to either an airport or seaport. Moreover, each GCC country has at least one flagship air carrier supported by an associated airport on land. • Bahrain has Gulf Air headquartered in Manama. • Kuwait has Kuwait Airways headquartered in Kuwait City. • Oman has Oman Air headquartered in Muscat. • Qatar has Qatar Airways headquartered in Doha. • Saudi Arabia has Saudia Airways headquartered in Jeddah. • UAE has three major airlines: Emirates Airways headquartered in Dubai; Etihad Airways headq uartered in Abu Dhabi; Arabian Airways headquartered in Sharjah. There are also several charter a nd discount airways flying the region. While rail tran sport is still missing, GCC is well -connected with the rest of the world through its airp orts. Each GCC country also has at least one mobile and internet service provider o ffering h igh- speed internet access to the locals and expatriates alike. On the negative side, while th ere is a significant investment in education, the rese arch atmosphere is not in par wi th that of the Western world. It is tru e th at th ere a few world-class publicly funded higher edu cational institutions providing a balance b etween research and teaching/service duties of the faculty members. However, from the private sector’s perspective, education is se en as a custom er- oriented bu siness, where maximizing the return on investment is the primary motive. As th ere is a big competition to a ttract as many students as possible, student satisfaction ratings tend to shadow the research performance d uring the facu lty evalu ations, particularly in private h igher educations. There is a need for state invo lvement in providing attractive and co mpetitive research fu nding to support researchers in both private and public higher education institutions. Denmark, the n umber ranked sustainability achiever sets a g ood role model for the GCC coun tries. Denmark is ranked as th e number one achiever in SDG rank ings, not only because it respects the environment but also its R&D expenditure as a percentage of GDP is 2.9%. This is between 5 to 30 times higher than the R&D expend iture ratios of GCC member states. Thanks to this investment in education, the average score of the top 3 universities in Denmark is 58.2, and the scientific outpu t as measured by the n umber of articles is 2.4 (5 times higher than th at o f Qatar and 24 times higher than th at of Bahrain). Denmark is also a founding member of the European Commission, which hosts the most extensive research p rogram in the world. Known as the Horizon 2020, this research program h as a bu dget o f 80 billion Euros. Any researcher or group of researchers can ap ply to competitive research funding financed by the European Commission. The Commission promotes regional integration among academia by supporting student and faculty exchange within member states. So me specific research/training programs require at least 2 -3 different institutions to apply together. In addition to the research program, the EU has committed 84 b illion Euros for smart and inclusive g rowth, 60 b illion Euros for sustaina ble growth, and natu ral resources (Council o f the EU, 2019). A similar research scheme in th e GCC area will not only boost research productivity, but it will also promote regional integration among the member states. Limitations and Future Research This a rticle sets th e fou ndation fo r co nducting similar researc h relevant to other regional unions such as the European Uni on, African Union, CIS, and ASEAN member cou ntries. However, ou r findings are highly dependent on the way that sustainability indicators are d efined and measured. While in ternational statistical agencies are trying to unify th ese in dicators, they are almost exclusively dependent on the n ational statistical reports, which might be biased and inflated. There is a significant motivation amon g all UN member countries to h ave a h igher sustainability rank. These ranks are based on the sustainability indicators mentioned in th is article. While the ultimate goal is to achieve sustainable development, the indicators measuring those goals might b ecome the targets themselves. Therefore, fo r any comparative analysis, th e data u sed shall be cro ss-checked with several other sources for confirmation. 32 IJBAS Vol. 9 No. 2 (20 20) References Allen, C. et al. (2017) ‘Indicator -based assessments o f progress towards the sustainable development goals (SDGs): a case study from the Arab region’, S ustainability Science . Springer Science and Bu siness Media LLC, 12(6), pp. 975 – 989. doi: 10.1007/s11625-017-0437- 1. Allen, C., Metternicht, G. and Wiedmann, T. (2018) ‘Initial progress in implementing the Sustainable Development Goals (SDGs): a review of evidence fro m countries’, Sustainability Science . Springer Science and Bu siness Media LLC, 13(5), pp. 1453 – 1467. doi: 10.1007/s11625-018-0572- 3. Amin-Salem, H. et a l. (2018) Sustainable development goal diagnostics: the case of the Arab Republic of Egypt , Policy Research Working P apers . The Wo rld Bank. doi: 1 0.159 6/1813- 9450-8463. Apfelbaum, S. (2018) ‘Mobile Industry Acce lerating Delivery of Sustainable Development Goals’, The Public Record , 42(79), pp. 7 – 8. Available at: https://search.proquest.com/docview/2135505987/fulltext/60F96A2 4630C4BBBPQ/1?accountid=166567 (Accessed: 28 January 2020). Brende, B. and Høie, B. (2015) ‘Towards evidence -b ased, q uantitative Sustainable Development Goals for 2030’, The L ancet , 385(9964), pp. 206 – 208. doi: 10.1016/S0140-6736(14)61654- 8. Campagnolo, L. and Davide, M. (2019) ‘Can the Paris deal boost SDGs achievement? An assessment of climate mitigation co-benefits or side- effects on poverty and inequality’, World Development . Elsevier Ltd, 122, pp. 96 – 109. doi: 10.1016/j.worlddev.2019.05.015. Council of the EU (2019) ‘EU budget for 2020: Council endorses deal with Parliament’. Available at: https://www.consilium.europa.eu/en/press/press- releases/2019/11/25/eu-budget-for-2020-council-endorses-deal- with-parliament/ (Accessed: 30 January 2020 ). Ermgassen, S. et al. (2019) ‘The role of “No Net Loss” po licies in conserving biodiversity th reatened by the global infrastructure boom’, One Earth . Elsevier Inc., 1(3), pp. 305 – 315. doi: 10.1016/j.oneear.2019.10.019. Fullman, N. et al. (2017) ‘Measur ing progress an d projecting attainment on the basis of past trends of the health -related Sustainable Development Goals in 188 countri es: an analysis from the Global Burden of Disease S tudy 2016 ’, The Lancet , 3 90(10100), pp. 1423 – 1459. doi: 10.1016/S0140- 67 36(17)32336- X. Gómez- Olivé, F. X. and Thorogood, M. (2018) ‘ Sustainable Development Goal 3 is unlikely to be achieved without renewed effort’, T he Lancet Global Health , 6 (8), pp. e824 – e825. doi: 10.1016/S2214-109X(18)30297- 3. Gulseven, O. et al. (2019) ‘ A sustainable model for enhancing road quality with recycled plastic bags’, Kuwait Journal of Science , 46(2), pp. 112 – 119. Available at: https://journalskuwait.org/kjs/index.php/KJS/article/view/5251/342. Gulseven, O. and Mostert, J. (2017) ‘Application o f Circular Economy for Sustainable Resource Management in Kuwait’, International Journal of S ocial Eco logy and Sustainable Development , 8(3), pp. 87 – 99. doi: 10.4018/IJSESD.2017070106. Hauschild, M. Z., Laurent, A. and Molin, C. (2018) ‘Advancing Li fe Cyc le Engineering to mee t United Natio n’s Sustainable Development Goals’, Procedia CIRP . Elsevier B.V., 69(May), p p. 1 – 2. doi: 10.1016/j.procir.2018.02.001. Hossen, Z. (2020) ‘Achieving SDGs: Alig ning private sector incentives with p ublic goals’, Financial Express . Available at: https://search.proquest.com/docview/2339472954/fulltext/7D42701 BE9BC406APQ/1?accountid=166567 (Accessed: 28 January 2020). Karnama, A., Haghighi, E. B. and Vinuesa, R. (2019) ‘Organic data centers: A sustainable solution for computing facilities’, Results in Engineering . Elsevier B.V., 4, p. 100063. doi: 10.1016/j.rineng.2019.100063. Lafortune, G. et al. (2019) ‘Sustainable Development Rep ort’, in Bertelsmann S tiftung and Sustainable Development Solutions Network (SDSN) . New Yo rk: Bertelsmann Stiftung, pp. 2443 – 2443. doi: 10.1007/978-3-642-28036-8_101577. Laraia, L., Robke, L. and Waldmann, H. (2018) ‘Bioactive Compound Collections: From Design to Target Identification’, Chem . Elsevier Inc, 4(4), pp. 705 – 730. doi: 10.1016/j.chempr.2018.01.012. Liew, W. Te, Adhitya, A. and Srinivasan, R. (2014) ‘Sustainabili ty trends in the process industries: A text mining- based analysis’, Computers in Industry , 65(3), pp. 393 – 400. doi: 10.1016/j.compind.2014.01.004. Liu, L. et al. (2016) ‘Global, regional, and national causes of under-5 mortality in 2000 – 15: an updated syst ematic analysis with implications for the Sustainable Development Goals’, The Lancet . The Author(s). Published by Elsevier Ltd. This is an Open Access article und er the CC BY license, 388 (10063), pp . 3027 – 3035. doi: 10.1016/S0140-6736(16)31593- 8. Luomi, M. et al. (2019) Arab Region S DG Index and Da shboards Report 2019 . Abu Dhabi and New York. Available at: https://eda.ac.ae/research/energy-climate-change-and- sustainable-development (Accessed: 19 December 2019). Makri, A. (2019) ‘Bridging the digital d ivide in health care’, The Lancet Digital Health . Elsevier BV, 1(5), pp. e204 – e205. doi: 10.1016/s2589-7500(19)30111- 6. Miola, A. and S chiltz, F. (2019) ‘Measuring sustainable development goals performance: How to monitor policy action in the 2030 Agenda impleme ntation ?’, Ecological Economics . Elsevier, 164, p. 106373. doi: 10.1016/j.ecolecon.2019.106373. Montes, M. (2017) 9. Industrialization, inequality and sustainability , Spotlight on Sustainable Deve lopment . Available at: https://www.2030spotlight.org/en/book/1165/chapter/9- industrialization-inequality-and-sustainability. Novillo-Ortiz, D., De Fátima Marin, H. and Saigí -Rubió, F. (2018) ‘The role of digital h ealth in supporting the achievement o f the Sustainable Development Goals (SDGs)’, In ternational Journal o f Medical I nformatics . Elsevier, 114, p p. 106 – 107. doi: 10.1016/j.ijmedinf.2018.03.011. OECD (2018) Enhancing Conn ectivity through Transport Infrastructure : Th e Ro le of Official Development Finance and Private Investment . Organisation for Economic Co - Op eration and Development (OECD). doi: 10.1787/9789264304505-en. PwC (2019) Sustainable Development Goals – how will they impact your business? Available at: https://www.pwc.com/gx/en/services/sustainability/sustainable- development-goals.html (Accessed: 29 January 2020). Requejo-Castro, D., Giné-Garriga, R. and Pérez-Foguet, A. (2020) ‘Data -driven Bayesian network modelling to explore the relationships between SDG 6 and the 2030 Agenda’, Science of the Total Environment , 7 10, p. 136014. Ronzon, T. and Sanjuán , A. I. (2020) ‘Friends or foes? A compatibilit y assessment of bio economy-related S ustainable Develop ment Goals for Euro pean policy coherence’, Journa l o f Cleaner Production . Elsevier Ltd, 2 54, p. 119832. doi: 10.1016/j.jclepro.2019.119832. Scheyvens, R., Banks, G. and Hughes, E. (2016) ‘The Priv ate Sector and th e SDGs: The Need to Move Beyond “Business as Usual”’, S ustainable Development . Wiley , 24(6), pp. 371 – 382. doi: 10.1002/sd.1623. Vinuesa, R. et a l. (2020 ) ‘The role of artificial intelligence in achieving th e Sustainable Development Goals’, Nature Communications , 11(1), p. 2 33. doi:1 0.1038/s41467-019-108- y.
Original Paper
Loading high-quality paper...
Comments & Academic Discussion
Loading comments...
Leave a Comment