Effect of Voltage Source Converters with Electrochemical Storage Systems on Dynamics of Reduced-inertia Bulk Power Grids
A major concern associated to the massive connection of distributed energy resources is the increasing share of power electronic interfaces resulting in the global inertia reduction of power systems. The recent literature advocated the use of voltage…
Authors: Yihui Zuo, Mario Paolone, Fabrizio.Sossan
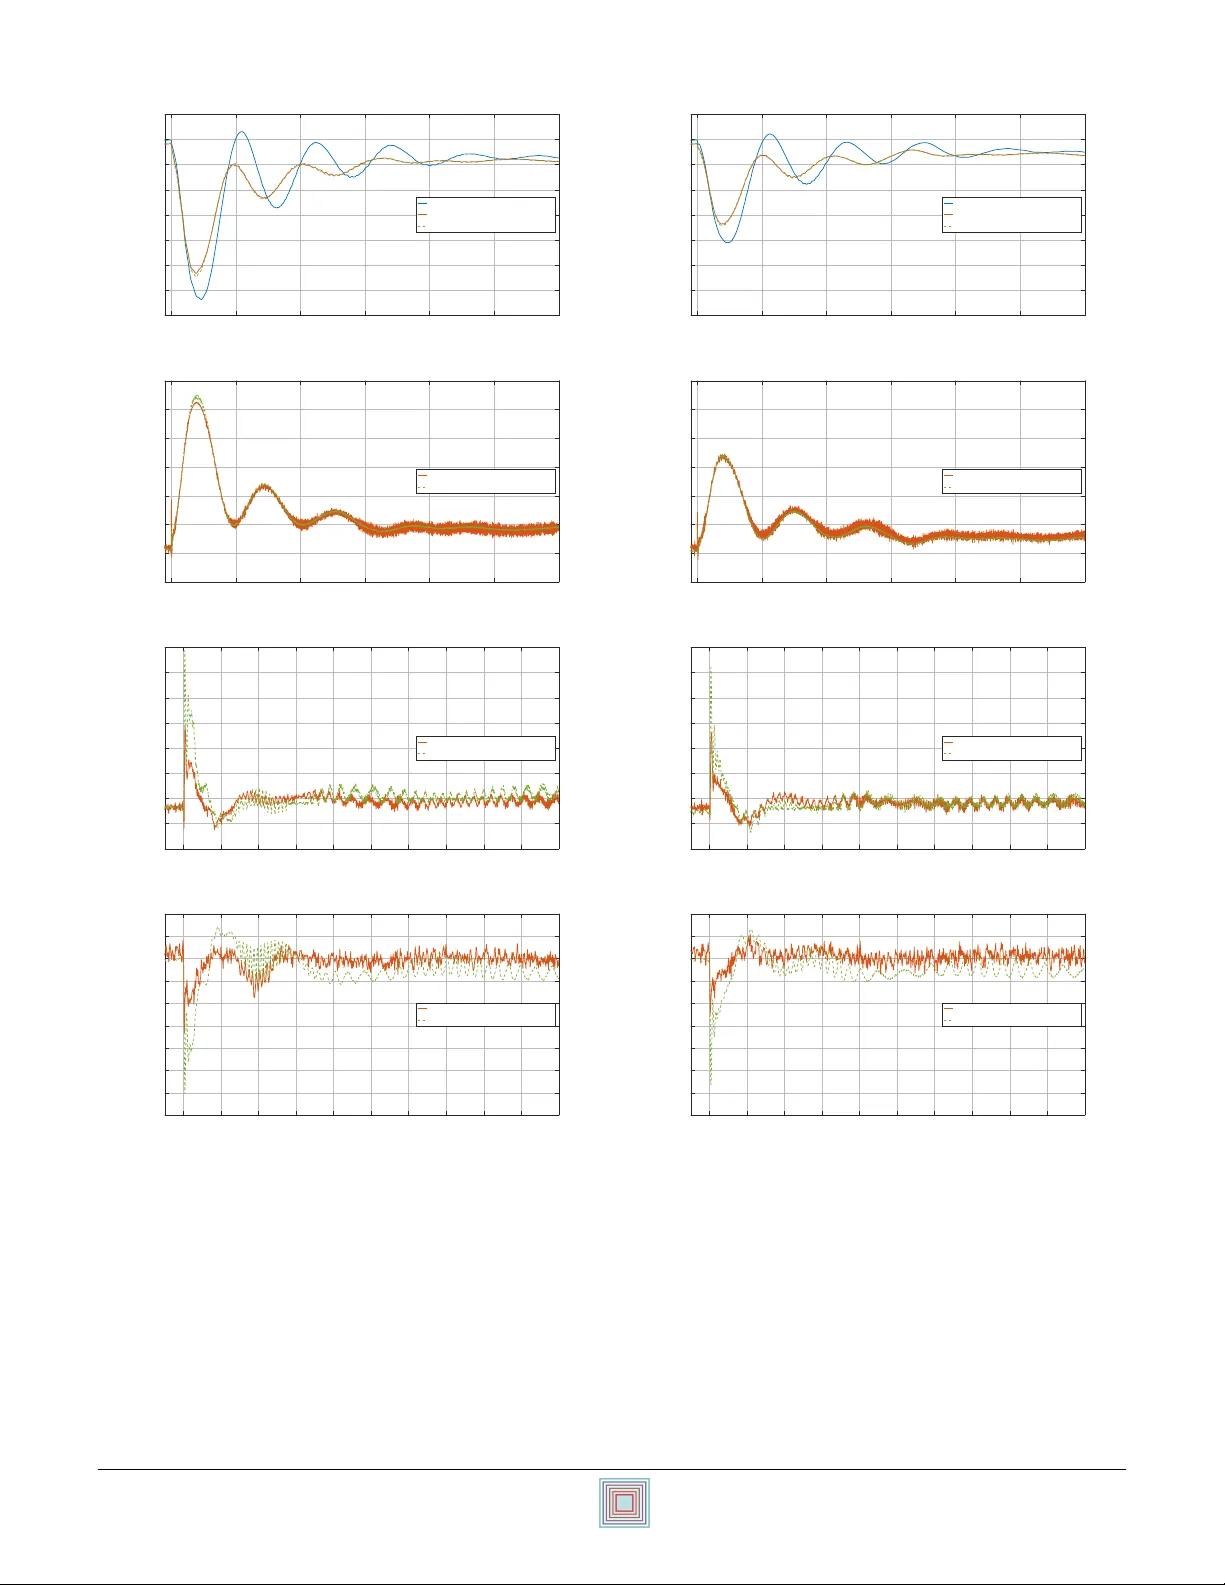
Ef fect of V oltage Source Con v erters with Electrochemical Storage Systems on Dynamics of Reduced-inertia Bulk Po wer Grids Y ihui Zuo, Mario Paolone Distributed Electrical System Laboratory ´ Ecole Polytechnique F ´ ed ´ erale de Lausanne Lausanne, Switzerland { yihui.zuo, mario.paolone } @epfl.ch Fabrizio Sossan Center for processes, renew able energies and ener gy systems MINES ParisT ech Nice, France { fabrizio.sossan } @mines-paristech.fr Abstract —A major concern associated to the massi ve con- nection of distributed energy resources is the increasing share of power electronic interfaces resulting in the global inertia reduction of power systems. The recent literature advocated the use of voltage source con verter (VSC) interfaced battery energy storage system (BESS) as a potential way to counterbalance this lack of inertia. Howe ver , the impact of VSCs on the dynamics of reduced-inertia grids is not well understood especially with respect to large transmission grids interfacing a mix of rotating machines and resour ces interfaced with power electr onics. In this regard, we propose an extension of the IEEE 39-bus test network to quantify the impact of VSCs on reduced-inertia grids. In this respect, a reduced-inertia 39-bus system is obtained by replacing 4 synchr onous generators in the original 10-synchronous machine system, with 4 wind power plants modeled as aggregated type-3 wind turbines. Then, a large-scale BESS is integrated into the reduced-inertia network via a three-lev el neutral-point clamped (NPC) con verter , thereby to be used f or studying the impact of VSC on the dynamics of the inertia-r educed power system, as well as for comparing different VSC controls. The proposed models are implemented on a r eal-time simulator to conduct post- contingency analysis, respectiv ely , for the original power system and the reduced-inertia one, with and without the BESS-VSC. Index T erms —Reduced-inertia, voltage source con verter , wind generation, battery energy storage system, 39-bus power system. I . I N T R O D U C T I O N Modern po wer systems are characterized by lar ge shares of resources interf aced with po wer electronics. In European Union, the renew able energy shares vary from 5% to 54%, while many countries encounter penetration lev els of rene w- able generation (i.e.,wind and solar) in excess of 15% of their overall annual electricity consumption [1]. Some power systems (e.g. in Spain, Portugal, Ireland, Germany and Den- mark) ha ve e ven already experienced instantaneous penetration This work is part of the OSMOSE project. The project has received funding from the European Unions Horizon 2020 research and innov ation programme under grant agreement No 773406. This article reflects only the authors views and the European Commission is not responsible for any use that may be made of the information it contains. lev els of more than 50% of con verter connected generation [2]. As generally ackno wledged, the large deployment of non- synchronous generation will determine a reduction of the system inertia and thus lead to very fast dynamics in case of contingencies, as indicated in several TSO reports [3], [4], [5]. An example is the sev ere blackout happened in the South Australian power system in 2016, when a wind storm hit the region while half of the power consumption was fed by wind generation [3], causing the grid frequency to decrease with a rate of change of 6.25 Hz/s. In this context, fast-ramping devices, such as conv erter-interfaced sources, may provide fast primary control response and are regarded as a potential and advocated remedy for power grid frequency regulation [6]. T o address the challenges related to reduce levels of system inertia, battery energy storage systems (BESSs) are broadly advocated as one of the potential solutions [7], [8] thanks to their large ramping rates capacities. Utility-scale BESSs, which are now commercially av ailable, are also recognized for other desirable features, including high-round-trip efficienc y , and long cycle-life [9]. BESSs are interfaced to the public A C power grid through four-quadrant voltage conv erters [10], which can be typically controlled at a sub-second resolution and used to provide grid ancillary services ranging from fast primary frequenc y response up to energy management (possibly , multiple [11]). There are generally two main approaches to achie ve the power control for power conv erter-interf aced units: grid- following control and grid-forming control [12], [13], [14]. A grid-following unit is based on a power con verter injecting required active and reacti ve po wer via modifying the ampli- tude and angle (with respect to the grid voltage phasor) of the con verter reference current, with the requirement on the knowledge of the fundamental phasor of the grid voltage at a point of common coupling (PCC). A grid-forming unit is based on a v oltage source con verter (VSC) that controls the frequency and voltage at a PCC, behaving as a voltage source behind an impedance and without requiring the kno wledge of the fundamental frequency phasor of the grid voltage at the PCC. In case a grid-forming control is used to regulate 21st Power Systems Computation Conference PSCC 2020 Porto, Portugal — June 29 – July 3, 2020 the con verter injected po wer , the knowledge of the grid volt- age phasor is required. In this respect, the concept of grid- supporting mode was introduced in [13] where additional high lev el control loops are incorporated into the grid-forming and grid-following control, to regulate the AC voltage via power output. On one hand, in actual power system, the majority of con verter-interfaced resources is controlled as grid-following sources as this operation mode is considered to be efficient for the load resources [15], [16]. As mentioned above, it relies on the knowledge of fundamental phasor of the grid voltage at the PCC, which can be tracked via a Phase Locked Loop (PLL). On the other hand, the future lo w-inertia grid may require large amount of grid-forming devices that provide a specific support for frequency and voltage regulation and stability , black-start capabilities, as well as synchronization mechanisms [14], [17]. T o the authors’ best kno wledge, very few researches have attempted to quantitati vely assess the ef fects of inertia re- duction and deployment of grid-scale VSC-based BESS on the dynamics of bulk power systems by including detailed dynamic models of the grid and its components. The work in [18] uses detailed models of two multi-area systems, providing insights on their dynamic beha viors when subject to large installed capacities of wind generation. In [19], the inertia of the IEEE 39-bus system is tailored to resemble the relative low-inertia Irish system; then, the ameliorating impact of a BESS, implemented as a ne gati ve load injection, on grid frequency transients is inv estigated. Even if the works in [18], [19] use detailed dynamic simulation models of the grid, they adopt a simple model for the power con verter -interfaced units, thus failing in capturing and assessing the interactions between VSC-based resources and the grid. In this context, the paper proposed a study based on the detailed dynamic models of grids, con verters and controls to analyse the impact of inertia reduction on po wer systems and the influence of VSC control approaches (grid-following versus grid-forming) on the dynamics of reduced-inertia po wer systems. T o this end, starting from the IEEE 39-bus benchmark system, we deri ve two new system configurations that allow us to ev aluate the system behavior in a reduced-inertia setting while considering VSC-based BESS: • A reduced-inertia 39-bus power system, created by re- placing 4 synchronous generators with 4 aggregated type- 3 wind power plants; • A reduced-inertia 39-bus power system, created by re- placing 4 synchronous generators with 4 aggregated type- 3 wind power plants and introducing a VSC-based BESS. The paper is structured as follows: Section II introduces the dynamic simulation models for the reduced-inertia 39-bus power grids, Section III describes the dynamic models for the VSC-based BESS associated with a PLL-free grid-forming control and grid-follo wing control, and Section IV presents and discusses the simulation results. Finally , Section V sum- marizes the results and provides indications of the control laws to be used for VSCs connected to limit the potential problems associated to reduced-inertia power systems. 2 1 30 39 9 8 7 5 4 G2 31 6 3 18 17 25 12 13 14 10 15 1 1 32 16 23 34 20 19 G4 24 G7 36 22 G6 21 26 29 28 38 27 33 G3 G10 37 35 G1 G8 G9 G5 Rated transmission line voltage: 345 kV Fig. 1: T opology of IEEE 39-bus benchmark test network. 2 1 30 39 9 8 7 5 4 G2 31 6 3 18 17 25 12 13 14 10 15 1 1 32 16 23 34 20 19 G4 24 G7 36 22 G6 21 26 29 28 38 27 33 G3 G10 37 35 Rated transmission line voltage: 345 kV WP1 WP2 WP4 BESS- VSC = 2 2 5 𝑀 𝑊 𝑃 𝐵 𝐸 𝑆 𝑆 = 4 0 0 0 𝑀 𝑊 𝑃 𝑡 𝑜 𝑡 𝑎 𝑙 𝑤 𝑖 𝑛 𝑑 WP3 Fig. 2: T opology of reduced-inertia 39-bus power system (The presence of the BESS at bus 17 is taken into account in the Config. II). I I . R E D U C E D - I N E RT I A B U L K P O W E R S Y S T E M All dynamic models presented in this and the next sec- tion are built in MA TLAB/Simulink and ex ecuted in an OP AL-R T eMEGAsim real-time simulator . For the sake of reproduciblilty , all the proposed models are open-source and freely av ailable online [20], where the modeling details and parameters used in the proposed models are all provided. The IEEE 39-bus benchmark test network, shown in Fig. 1, has been widely adopted for studies of po wer system dynamics since it first appeared in [21]. W e modified the IEEE 39- bus benchmark po wer system by replacing 4 synchronous 21st Power Systems Computation Conference PSCC 2020 Porto, Portugal — June 29 – July 3, 2020 T ABLE I: Inertia constant for Config. I and Config. II. Config. I Config. II H [s] 784.7 197.9 generators (denoted in Fig. 1 as G1, G5, G8 and G9) with 4 wind power plants based on an aggregated model of a type-3 double-fed induction generator (DFIG) wind turbine, as sho wn in Fig. 2. This allows us to model a scenario with reduced system inertia due to displacing a part of conv en- tional synchronous generation capacity in fa vor of con verter - interfaced production. T able. I reports the total v alue of the inertia constant (referred to a 100 MW base and obtained by summing the inertia constant of the all con ventional po wer plants) for the original grid and the modified grid, which are referred to as Config. I and Config. II, respectiv ely . Correspondingly , we create tw o full-replica dynamic models for Config. I and Config. II. This modelling details are provided in the followings of this section. A. Synchr onous generators Con ventional generation consists of hydro- and thermal- power plants. They are simulated with of a sixth-order state- space model for the synchronous machine, a prime mo ver [22], a DC1A excitation system associated with an A VR [23]. The generator model includes the primary frequency regulation with a static droop coefficient R p = 5% . The power plant G7 also implements a secondary frequency regulator with an integration time constant of 120 s. 1) Synchr onous machine: The generator model provided in the original technical report [21] is essentially a fourth- order generator model, as it does not include the subtransient circuits. Therefore, we use a sixth-order state-space model for the synchronous machine, whose synchronous and transient parameters are taken from the original technical report [21], while the subtransient parameters are inspired from real- world test parameters, adapted from the IEEE Std. 1110- 2002(R2007) [24] and in the EPRI technical reports [25], [26]. 2) Hydraulic turbine and governor system: W e adopt the commonly-used standard hydro turbine governor model as illustrated in [27]. According to [28], the response of the turbine governing system should be tuned to match the ro- tating inertia, the water column inertia, the turbine control servomotor timing and the characteristics of the connected electrical load. Therefore, as recommended in [28], we use T M = 2 H and T M : T w = 3 : 1 . H is the generator inertia constant, T M is the mechanical inertia constant, and T w is water inertia time (also kno wn as ”water starting time”). The PI gov ernor parameters are deriv ed according to [29], where 1 /K P = 0 . 625 T W /H and K P /K I = 3 . 33 T W . 3) Steam turbine and governor system: The steam turbine and gov ernor model are adapted from [22], where the steam turbine system is presented as tandem-compound, single mass model and the speed governor consists of a proportional regulator , a speed delay and a servo motor . The parameters for average P ( t ) ( t ) P 0 PLL ( t ) Q 0 Q ( t ) Buffer f ( t ) V ( t ) Bus V oltage RMS Function P ( t ) Function Q ( t ) Fig. 3: Diagram of the EPRI LOADSYN dynamic load model. the steam turbine-governor are taken from the typical values used, for instance, in [22], [30]. 4) Excitation system: The IEEE DC type 1 exciter associ- ated with an A VR [23] is implemented in the e xcitation system, whose parameters are adapted from [31]. B. Dynamic loads In order to reproduce a plausible dynamic load behavior , the EPRI LOADSYN model has been adopted [32]. Specifi- cally , we implemented the three-phase dynamic and voltage- dependent load model based on the following equations: P ( t ) = P 0 ( t ) V ( t ) V 0 K pv [1 + K pf ( f ( t ) − f 0 )] (1) Q ( t ) = Q 0 ( t ) V ( t ) V 0 K qv [1 + K q f ( f ( t ) − f 0 )] (2) where P ( t ) and Q ( t ) are the three-phase load active and reactiv e po wer . The coef ficients K pv , K pf , K q v , K q f are obtained from typical load voltage and frequency parameters inferred from EPRI LOADSYN program. In this regard, we represent f ( t ) , V ( t ) , P 0 ( t ) , and Q 0 ( t ) as time-varying variables sampled with a resolution of 20 ms. W e assume that P 0 ( t ) and Q 0 ( t ) are activ e and reacti ve power consumed at rated frequency and voltage. The rated demand profile is adapted from a monitoring system based on PMUs installed on the 125 kV sub-transmission system of Lausanne, Switzer- land [33]. Coherently with the other model variables, the measured time-series power data are sampled with a resolution of 20 ms. Since the nominal load values in the original IEEE 39-bus po wer system are different from our measured data, the final demand patterns are obtained by re-scaling the measured time series with respect to the rated power in [21]. The implementation of the EPRI LO ADSYN model is illustrated in Fig. 3. A conv entional Phase Locked Loop (PLL) and a Root Mean Square (RMS) operator measure the bus frequency and voltage to be employed in the dynamic load model. On one side, as the PLL may be inaccurate in transient conditions, a moving av erage mechanism is implemented in order to av oid improper behavior of the dynamic load model. Specifically , the PLL-tracked frequency is updated ev ery 1 ms, and then buf fered for av eraging. The overall buf fer size is 240 samples, with an ov erlap size of 220 samples (i.e., the final frequency f ( t ) is reported ev ery 20 ms). On the other side, the bus voltage V ( t ) is given by a RMS operator that computs ov er a window length of 240 ms and reports every 20 ms. 21st Power Systems Computation Conference PSCC 2020 Porto, Portugal — June 29 – July 3, 2020 𝑉 𝑔 Filter 3~ = = Measurement 𝑉 𝑎 𝑏 𝑐 _ 𝑔 𝑉 𝑎 𝑏 𝑐 _ 𝑟 DFIG , 𝑃 𝑔 𝑄 𝑔 𝛿 𝑔 PI Current control = 0 𝐼 𝑞 _ 𝑟 𝑒 𝑓 𝑉 𝑑 𝑐 _ 𝑟 𝑒 𝑓 𝐼 𝑑 _ 𝑟 𝑒 𝑓 𝑉 𝑑 𝑐 PLL Current control 𝛿 𝑟 𝛿 𝑔 = 0 𝑄 𝑟 𝑒 𝑓 PI 𝐼 𝑞 _ 𝑟 𝑒 𝑓 𝑄 𝑔 T orque Control 𝐼 𝑑 _ 𝑟 𝑒 𝑓 Grid-side VSC control Rotor-side VSC control 3~ Fig. 4: Diagram of wind power plant and controls. C. W ind power plants The wind power plants are modeled as proposed in [34]. In particular , the po wer output is approximated by multiplying the power output of a detailed model of a single wind turbine to match the total nominal capacity of the whole wind farm. The diagram of the overall system in shown in Fig. 4. Each wind generator model consists of a DFIG and an averaged back- to-back con verter model [35]. For this analysis, the detailed aerodynamic model of wind turbine is not in volv ed, as its effect is accounted already in the wind profiles. The wind power profiles are generated at 1 second resolution by re- sampling the measurements at 1 minute resolution from [36]. The re-sampling approach is based on the statistical charac- teristics of the aggregated wind generation profiles presented in [37]. More details about producing wind power profiles are described in [38]. The back-to-back VSCs are modelled as equiv alent volt- age sources. In this av erage con verter model, the dynamics resulting from the interaction between the control system and the power system are preserved. As sho wn in Fig. 4, two grid-following controls are implemented in the back-to- back con verters. The rotor-side con verter controls active and reactiv e power through rotor current regulation whilist the stator-side con verter regulates DC b us voltage and permits operation at a constant power factor (i.e., zero reactiv e power). I I I . V O L TAG E S O U R C E C O N V E RT E R I N T E R FA C ED B A T T E RY E N E R G Y S T O R AG E S Y S T E M W e install a detailed model of a BESS at bus 17 in the reduced-inertia 39-bus power system. As detailed below , it consists of the battery cell stack (necessary to model voltage dynamics on the con verter DC bus), and the power con verter , which is modelled at the level of the switching devices. A. Battery cell stack The voltage at the terminal of a battery is generally dynamic and it depends on the output current, state-of-char ge, cells tem- perature, ageing conditions, and C-rate. In control applications, it is typically modelled with electric equiv alent circuits, which trade detailed modelling of the electrochemical reactions for increased tractability , see e.g. [39], [40]. In this paper , we use R 1 R 2 R 3 R s + − E C 1 C 2 C 3 + − v C 1 v C 2 v C 3 v i Fig. 5: Three-time constant equiv alent circuit of the battery cell stack. + _ + _ + _ 𝑖 𝑡 + _ + _ + _ + _ 𝑖 𝑡 ...... + _ + _ 𝑈 𝑎 𝑔 𝑔 𝑟 𝑒 𝑆 𝑆 𝑀 𝑈 𝑑 𝑒 𝑠 𝑙 𝑆 𝑆 𝑀 Battery Pack 𝐼 𝑡 𝑖 𝑡 𝑖 𝑡 Fig. 6: Diagram of BESS-VSC. T ABLE II: Parameters of BESS to be connected to HV transmission grid SOC [%] 0-20 20-40 40-60 60-80 80-100 E [ V ] 1184.4 1250.0 1305.8 1360.4 1466.4 R s [ Ω ] 0.052 0.042 0.030 0.028 0.026 R 1 [ Ω ] 0.190 0.150 0.180 0.158 0.398 C 1 [ F ] 4465 4904.5 6998 6000 5617 R 2 [ Ω ] 0.08 0.018 0.018 0.018 0.020 C 2 [ F ] 454.5 1069.5 1241 1245 1252.5 R 3 [ Ω ] 5.0e-3 9.8e-5 4.8e-4 13.6e-4 12.0e-4 C 3 [ F ] 272.1 394.5 1479.8 2250 3088.7 a validated grey-box model identified from measurements of a 720 kV A/560 kWh Lithium-titanate-oxide battery at EPFL [7]. The model is a third-order model with parameters that depend on the state-of-charge. Despite most of literature refers to two-time-constant models (i.e., second order models), it was shown in [7] that when considering voltage measurements at a second resolution, a third state is necessary to explain system dynamics. The three-time constant equiv alent circuit of the battery cell stack is shown in Fig. 5. The state-space representation of the model is: ˙ x ( t ) = Ax ( t ) + B u ( t ) (3) y ( t ) = C x ( t ) + D u ( t ) (4) where A = diag ( − 1 / ( R 1 C 1 ) , − 1 / ( R 2 C 2 ) , − 1 / ( R 3 C 3 ))) (5) B = 1 /C 1 0 1 /C 2 0 1 /C 3 0 , C = 1 1 1 , D = R s E (6) x = v C 1 v C 2 v C 3 , u ( t ) = i t / 156 1 T . (7) Model output y ( t ) denotes the terminal voltage, and input i t is the total DC current absorbed/provided by the battery . The ele- 21st Power Systems Computation Conference PSCC 2020 Porto, Portugal — June 29 – July 3, 2020 PWM 𝑢 𝑑 𝑐 𝑉 𝑚 𝐿 𝑓 𝑅 𝑓 𝐿 𝑐 𝑅 𝑐 𝑍 𝑠 𝑉 𝑠 Active network equivalent at PCC 𝑖 𝑠 𝑖 𝑔 Inner current control 𝑒 𝑔 𝑑 𝑉 ∗ 𝑚 𝑑 𝑞 𝑖 𝑔 𝑑 dq0/ abc PI dq0/ abc 𝑉 𝑔 PCC PLL 𝜃 𝑔 𝐾 𝑓 𝑜 𝑙 𝑙 𝑜 𝑤 𝑝 − 𝑓 𝑃 𝑠 𝑒 𝑡 𝜔 𝑠 𝑒 𝑡 𝜔 𝑚 𝑒 𝑎 𝑠 ÷ × 𝑖 ∗ 𝑔 𝑑 PI 𝑃 ∗ 𝑟 𝑒 𝑓 𝑃 𝑚 𝑒 𝑎 𝑠 ÷ × 𝑖 ∗ 𝑔 𝑞 dq0/ abc 𝑖 𝑔 𝑞 𝑒 𝑔 𝑞 𝑄 ∗ 𝑟 𝑒 𝑓 𝑒 𝐾 𝑓 𝑜 𝑙 𝑙 𝑜 𝑤 𝑞 − 𝑣 𝑄 𝑚 𝑒 𝑎 𝑠 𝑄 𝑟 𝑒 𝑓 𝑈 𝑟 𝑒 𝑓 P-f Regulator Fig. 7: Grid-following con verter with grid-supporting mode. ments of matrices A, B , and D are state-of-charge-dependent and can be identified from measurements, as described in [7], [41]. Howe ver , since the power rating of the BESS that we use in this work (225 MV A) is larger than the one for which the model is proposed in [7] (0.72 MV A), we need to adapt the model parameters as described in the following. First, we achieve the target power (225 MV A) with a configuration composed of two cell stacks in series and 156 in parallel. The two units in series are explained by the fact that, in the attempt of increasing the voltage on the DC bus (to reduce losses), this is the largest (integer) number of series elements that a con verter can accommodate gi ven that the original model refers to a battery with an open-circuit voltage of 800 V at full charge and power electronic can con veniently handle voltage up to 2 kV . By assuming that all the paralleled battery packs are identical, the voltage of the aggregated BESS is considered equal to the v oltage of each battery pack. The parameters of the equiv alent circuit models are obtained by doubling all the parameters reported in [7], except for capacitors, whose values were halved to retain the same time constants as those identified. Final parameters adopted for three-time constant model (4)-(7) are reported in in T able II. The total BESS current i k is used to compute the state-of-charge: SOC k +1 = SOC k + T s 3600 i k C nom (8) where T s = 0 . 001 s is the sampling time and C nom = 117 kAh is the BESS capacity . B. P ower electr onic converter The model of the po wer con verter consists of a fully modeled three-lev el neutral-point clamped (NPC) conv erter, consisting of 12 IGBT/Diode pairs and 6 clamp diodes. It is shown Fig. 6. T o be applicable for the real-time simulations, the AR TEMiS state-space nodal (SSN) blocks are used to assign the three arms of the con verter into three separate SSN groups. This allows the solvers to decouple the large state- space equation into smaller groups [42]. PWM 𝑢 𝑑 𝑐 𝑉 𝑚 𝐿 𝑓 𝑅 𝑓 𝐿 𝑐 𝑅 𝑐 𝑒 𝑍 𝑠 𝑉 𝑠 Active network equivalent at PCC 𝑃 𝑚 𝑒 𝑎 𝑠 𝑖 𝑠 𝑖 𝑔 Current controller V oltage controller 𝑒 ∗ 𝑖 ∗ 𝑠 𝑉 ∗ 𝑚 𝑑 𝑞 Inner Control Loop dq0/ abc 𝑖 𝑠 𝑑 𝑞 𝑖 𝑔 𝑑 𝑞 dq0/ abc 1 + 𝑠 𝑇 2 1 + 𝑠 𝑇 1 𝑃 𝑠 𝑒 𝑡 𝑚 𝑝 𝜔 𝐿 𝑃 + 𝑠 𝜔 𝐿 𝑃 𝜔 𝑠 𝑒 𝑡 Δ 𝜔 ∗ 𝑠 𝑒 𝑡 1 𝑠 𝜃 ∗ 𝑄 𝑚 𝑒 𝑎 𝑠 = 0 𝑄 𝑠 𝑒 𝑡 𝐸 𝑠 𝑒 𝑡 𝑛 𝑞 Synchronization and P-f droop dq0/ abc 𝑉 𝑔 PCC Virtual impedance 𝜔 ∗ Low Pass Filter Lead-lag Filter Fig. 8: PLL-free grid-forming con verter . 𝑉 𝑎 𝑏 𝑐 abc to dq0 PI controller Controlled oscillator Vq 𝑤 Low-pass filter (Rate limited) Freq 𝑤 𝑡 𝑤 𝑡 Discreted variable-frequency mean value Freq q axis Fig. 9: PLL implemented in grid-following conv erter with grid-supporting mode. C. Contr ols for voltage source con verter W e choose tw o con verter controls, namely the the grid- following control with support mode and the PLL-free grid- forming control, as shown in Fig. 7 and Fig. 7. 1) Grid-following con verter operated with grid-supporting mode: The grid-following control adjusts the injected power with respect to the grid voltage at the PCC, whereas the grid- forming control adjusts the modulated voltage with respect to the grid voltage at PCC. Details of the considered control schemes are described in the followings. The grid-follo wing control has been widely deployed in grid-connected con verters, such as in VSC-HVDC [43] and the back-to-back con verter of wind power plants (type-3 and type-4 wind turbine generators) [44]. As shown in Fig. 7, the adopted grid-follo wing control injects the required amount of acti ve and reacti ve power by controlling the injected current with a specific phase displace- ment in respect to the grid-voltage at a PCC. Therefore a phasor estimation device (i.e., PLL) is required to estimate the fundamental frequency phasor of the grid voltage, so as to generate the instantaneous value of the current reference and ev entually the voltage reference. In this regard, the activ e and reactiv e power are controlled independently . Fig. 9 sho ws the three-phase PLL used for tracking the fundamental phasor of grid-voltage at the PCC. The three- phase input signals are conv erted to the dq0 rotating frame using the angle provided by a controlled oscillator . The q- 21st Power Systems Computation Conference PSCC 2020 Porto, Portugal — June 29 – July 3, 2020 axis of the signal is filtered with a discrete mean block that computes the mean v alue of q-axis voltage ov er a sliding window of one cycle whose frequenc y is the one of the previous estimation. The PI controller output, corresponding to the angular velocity , is filtered and con verted into the frequency . The proportional gain and integral gain for the PI controllers are K p,P LL =60 and K I ,P LL =1400, respectively . The grid-following conv erter is operated with grid- supporting mode by adding a high lev el frequency and voltage regulators with droop characteristics. The activ e power is regulated according the droop coefficient K f ollow ing p − f = 20 , as the difference between the measured frequency (from PLL) and the frequency reference exceeds the dead-band of 0.001 p.u. The reactive power in regulated according the droop coefficient K f ollow ing q − v = 10 , as the difference between the measured voltage and voltage reference exceeds the dead-band of 0.005 p.u. 2) PLL-free grid-forming converter: The grid-forming con- trol allows the con verters operating as synchronized voltage source. Thereby , they do not require an explicit current control. As stated in the introduction, they can use the angle difference between the grid voltage and the modulated voltage to control power . In this context, the estimate of grid voltage angle is necessary and can be achieved in two ways: use a PLL to estimate the grid voltage angle or, instead, directly link the activ e power exchange to the angle difference between the grid voltage ( θ g ) and the modulated voltage ( θ m ) to create a PLL-free controller . W e adopt the PLL-free grid-forming control proposed in [45] and de veloped for VSC connecting at transmission lev el [46]. Fig. 8 shows the control diagram of the adopted PLL-free grid-forming control. Such a control architecture creates a link between the output voltage angle of the con verter and the active power which not only enables the synchroniza- tion with the grid but also allo ws the conv erter to deliv er in primary frequency regulation. As shown in the blue sub-diagram in Fig. 8, the output voltage angle is directly linked with the difference between measured activ e power and reference activ e power . Specifi- cally , m p = 0 . 05 corresponds to frequency droop coef ficient K f orming p − f = 20 . A first-order lo w-pass filter is added to av oid fast frequency v ariations and to filter the power mea- surements noise, and a lead-lag filter is implemented on the power measurement to improv e the con verter dynamics [47]. According to [45], the cut-off frequency for the low pass filter is ω LP = 31 . 4 rad/s. The adopted time constants for the lead- lag filter are T 1 = 0 . 0333 s and T 2 = 0 . 0111 s. The considered PLL-free grid-forming control is an ef fec- tiv e simple scheme that allows the con verter to synchronize with the po wer grid and to provide the primary frequency regulation services. Howe ver , the activ e and reactive power are not decoupled because the reactiv e power is coupled with the angle difference between grid voltage and the modulated voltage ( δ = θ g − θ m ). In particular , we have that (see Fig. 8): Q = V g R 2 C + X 2 C [ R C V m sin ( δ ) + X C ( V g − V m cos ( δ ))] (9) T ABLE III: Initial Nodal Power Injections Unit Acti ve Power [MW] Reactiv e Power [MV ar] Config. I Config. II Config. I Config. II G1/WP1 1353 1335 253 86 G2 816 579 115 56 G3 597 509 70 -61 G4 697 545 -56 10 G5/WP4 406 501 64 14 G6 799 816 113 67 G7 446 530 -25 -46 G8/WP2 698 1145 -108 57 G9/WP3 699 803 -73 29 G10 598 414 41 -87 T otal 7129 7147 295 206 170 180 190 200 210 220 230 240 250 260 270 Time [s] 0.93 0.94 0.95 0.96 0.97 0.98 0.99 1 1.01 Frequency [p.u.] Config.I-G2 Config.I-G3 Config.I-G4 Config.I-G7 Config.I-G10 Config.II-G2 Config.II-G3 Config.II-G4 Config.II-G7 Config.II-G10 Fig. 10: Frequency for Config. I and Config. II. where the modulated v oltage angle θ m is determined by the activ e power control, V m is the conv erter A C voltage amplitude, and V g is the amplitude of the grid voltage at PCC. R C and X C are the transformer impedance components as shown in Fig. 8. I V . D Y N A M I C S I M U L A T I O N S A. Impact of Inertia Reduction T o ev aluate the systems response in extreme condition with- out the presence of con verter-interf aced BESS, we reproduce a contingency (i.e., the tripping of generator G6) in both Config. I and Config. II. T able III reports the initial nodal power injections 1 (i.e. pre-contingency power injections) for Config. I and Config. II. It shows that, in Config. II, wind generation accounts for more than half of the total acti ve po wer injection, i.e., 3789 MW versus 7129 MW . Fig. 10 sho ws the system frequency for Config. I and Config. II. It denotes that, after the G6 tripped, the grid frequency decreases faster in Config. II than in Config. I. The frequency nadir for Config. II is 0.9366 p.u. and 0.9842 p.u. for Config. I. The frequency transient is longer in Config. II (80 sec) than in Config. I (30 sec). This is in-line with expectations since Config. II has much lower system inertia than Config. I. B. Compare VSC Controls in Reduced-inertia P ower Grid W e integrate in Config. II a con verter-interf aced BESS, modelled as described in the previous section. W e denote this 1 The reactiv e power provided by the wind power plants are generated by shunt capacitors. 21st Power Systems Computation Conference PSCC 2020 Porto, Portugal — June 29 – July 3, 2020 180 190 200 210 220 230 240 Time [s] 0.93 0.94 0.95 0.96 0.97 0.98 0.99 1 1.01 Frequency [p.u.] Config.II Config.II-BESS-Grid-forming Config.II-BESS-Grid-following (a) Frequency . 180 190 200 210 220 230 240 Time [s] -0.2 0 0.2 0.4 0.6 0.8 1 1.2 Active Power [p.u.] Config.II-BESS-Grid-forming Config.II-BESS-Grid-following (b) Activ e power . 180 182 184 186 188 190 192 194 196 198 200 Time [s] -0.2 -0.1 0 0.1 0.2 0.3 0.4 0.5 0.6 Reactive Power [p.u.] Config.II-BESS-Grid-forming Config.II-BESS-Grid-following (c) Reactiv e power . 180 182 184 186 188 190 192 194 196 198 200 Time [s] 0.93 0.94 0.95 0.96 0.97 0.98 0.99 1 1.01 1.02 voltage [p.u.] Config.II-BESS-Grid-forming Config.II-BESS-Grid-following (d) Grid voltage at PCC. Fig. 11: Frequency , con verter power injections and grid voltage at bus 17 in Config. II-BESS for Case 1 . new configuration as Config. II-BESS and use it to assess the performance of the grid-follo wing and grid-forming controllers in two study cases: • Case 1 : same contingency as in the former paragraph, tripping of G6 (800 MW generation loss). • Case 2 : tripping of G4 (545MW generation loss). 180 190 200 210 220 230 240 Time [s] 0.93 0.94 0.95 0.96 0.97 0.98 0.99 1 1.01 Frequency [p.u.] Config.II Config.II-BESS-Grid-forming Config.II-BESS-Grid-following (a) Frequency . 180 190 200 210 220 230 240 Time [s] -0.2 0 0.2 0.4 0.6 0.8 1 1.2 Active Power [p.u.] Config.II-BESS-Grid-forming Config.II-BESS-Grid-following (b) Activ e power . 180 182 184 186 188 190 192 194 196 198 200 Time [s] -0.2 -0.1 0 0.1 0.2 0.3 0.4 0.5 0.6 Reactive Power [p.u.] Config.II-BESS-Grid-forming Config.II-BESS-Grid-following (c) Reactiv e power . 180 182 184 186 188 190 192 194 196 198 200 Time [s] 0.93 0.94 0.95 0.96 0.97 0.98 0.99 1 1.01 1.02 voltage [p.u.] Config.II-BESS-Grid-forming Config.II-BESS-Grid-following (d) Grid voltage at PCC. Fig. 12: Frequency , con verter power injections and grid voltage at bus 17 in Config. II-BESS for Case 2 . 1) Case 1: In Case 1 , we reproduce a contingency for Config. II-BESS the same as in Section.IV -A. Fig. 11a shows a comparison of the frequency beha viour in Config. II vs Config. II-BESS. It shows that the VSC-based BESS achiev es to increasing frequency Nadir from 0.9366 p.u. to 0.9480 p.u. and a better damping of the frequenc y oscillations by decreasing the overall transient interval from 80 s to 40 s. 21st Power Systems Computation Conference PSCC 2020 Porto, Portugal — June 29 – July 3, 2020 180 190 200 210 220 230 240 Time [s] 0.945 0.95 0.955 0.96 0.965 0.97 0.975 voltage [p.u.] Config.II-BESS-Grid-forming Config.II-BESS-Grid-following (a) DC voltage. 180 190 200 210 220 230 240 Time [s] -1.4 -1.2 -1 -0.8 -0.6 -0.4 -0.2 0 Current [p.u.] Config.II-BESS-Grid-forming Config.II-BESS-Grid-following (b) DC current. 180 190 200 210 220 230 240 Time [s] 93.4 93.6 93.8 94 94.2 94.4 94.6 94.8 SOC [%] Config.II-BESS-Grid-forming Config.II-BESS-Grid-following (c) Battery SOC. Fig. 13: Con verter DC voltage, DC current and BESS SOC at bus 17 in Config. II-BESS for Case 1 . Fig. 11b and Fig. 11c show the acti ve and reacti ve power for the installed con verter unit. The grid-following and the grid- forming controllers use the same frequency droop coefficient K f ollow ing p − f = K f orming p − f = 20 , thus both controllers inject activ e power into the power system following the same droop characteristic. The considered grid-follo wing control injects reactiv e power as the result of external v oltage regulation, whereas the reactiv e power injected by the considered grid- forming control is due to the implicit coupling between active power and reactive power . As sho wn by Fig. 11c, during the transient the reactiv e power injected by the grid-following con verter rises up to 0.587 p.u., while the reactiv e po wer injected by the grid-forming con verter only goes up to 0.284 p.u. Fig. 11d presents the amplitudes of the grid voltage at the PCC of the installed con verter unit (i.e., bus 17). It denotes that, after the contingency there is a voltage sag (i.e., decrease of 6% of nominal v oltage) within 100 ms for 180 190 200 210 220 230 240 Time [s] 0.945 0.95 0.955 0.96 0.965 0.97 0.975 voltage [p.u.] Config.II-BESS-Grid-forming Config.II-BESS-Grid-following (a) DC voltage. 180 190 200 210 220 230 240 Time [s] -1.4 -1.2 -1 -0.8 -0.6 -0.4 -0.2 0 Current [p.u.] Config.II-BESS-Grid-forming Config.II-BESS-Grid-following (b) DC current. 180 190 200 210 220 230 240 Time [s] 93.4 93.6 93.8 94 94.2 94.4 94.6 94.8 SOC [%] Config.II-BESS-Grid-forming Config.II-BESS-Grid-following (c) Battery SOC. Fig. 14: Con verter DC voltage, DC current and BESS SOC at bus 17 in Config. II-BESS for Case 2 . the grid-following con verter whereas the PCC voltage for the grid-forming con verter experiences a way low drop (it varies only of ± 3% ). In addition, during the whole transient period, the voltage variation for the grid-following con verter appears larger than for the case of the grid-forming con verter . Although the grid-following control injects higher amount of reacti ve power , the voltage re gulation result is not as good as for the grid-forming control. This is because the grid-forming control allows the con verter operating as voltage source which is capable of better sustaining the PCC voltage. Fig. 13 sho ws con verter DC voltage, DC current, and battery SOC for Case 1 . The DC voltage varies corresponding to the change of DC current. The SOC of BESS is decreasing in a way that corresponds to the integrated of injected power into the grid due to the frequency regulation. 2) Case 2: T o represent a less e xtreme contingency , in Case 2 we trip G4 to cause less generation loss. Fig. 12 shows the simulation results of reproducing the same contingency for 21st Power Systems Computation Conference PSCC 2020 Porto, Portugal — June 29 – July 3, 2020 Config. II and Config. II-BESS. Fig. 12a presents the frequency responses for Config. II and Config. II-BESS. It illustrates that the con verter unit increases the frequency Nadir from 0.9589 for Config. II to 0.9665 for Config. II-BESS and ameliorate the frequency oscillations by decreasing the transient duration from 75 s to 35 s. Fig. 12b and Fig. 12c show the acti ve and reacti ve power injected by the con verter unit. For both the grid-following and grid-forming control, the injected active power tracks frequency deviations accordingly with their droop coefficients. During the transient, the reactiv e power injected by the grid- following con verter rises up to 0.520 p.u., while the reactiv e power injected by the grid-forming con verter only goes up to 0.260 p.u. Fig. 12d shows the amplitude of the grid voltage at the PCC of the conv erter units. It demonstrates the benefit of the grid- forming conv erter as voltage source in prev enting the PCC voltage from large variation. In contrast, the grid-following con verter experiences a voltage sag ( − 6% of nominal voltage) within 100 ms after the contingency and a generally higher voltage variation during the transient. Fig. 14c shows con verter DC voltage, DC current, and battery SOC for Case 2 . As for the previous Case 1 , the DC voltage v aries as a function of DC current and the SOC of BESS decreases as a result of the BESS frequency regulating action. V . C O N C L U S I O N S In this paper we inv estigated the impact of VSCs on the dynamics of a reduced-inertia grid that interfaces a mix of synchronous machines and power -electronics-interfaced wind turbines. T o this end, we proposed three 39-bus power system configurations as an extension of the IEEE 39-bus bench- mark power system. The first one corresponds to the original benchmark network. The second configuration replaces four synchronous machine-based power plants with type-3 wind turbines. The third configuration is identical to the second with the exception of including a power electronic-interfaced BESS. Correspondingly , we built three full-replica dynamic models that are executed on a real-time simulator to reproduce the same contingencies and conduct post-contingency analysis with respect to the system dynamics. The simulation results verified the substantial influence of inertia reduction on the post-contingency dynamics of the power system and quantitati vely prov ed that the connected VSC, implemented with the grid-following control with sup- porting mode or the PLL-free grid-forming control, can assist in limiting the frequenc y decreasing and in damping the frequency oscillations. The performance of the grid voltages at the PCC of the con verter has demonstrated the benefit of the grid-forming con verter to maintain the PCC voltage during transient, along with an important improv ement of the post- contingency frequency transient in terms of both Nadir and damping. Our future work will utilize long time steady-state sim- ulations to quantify and analyze the benefits of BESSs for frequency response services. R E F E R E N C E S [1] A. Z. Amin, “Renew able energy prospects for the european union, ” International Renewable Energy Agency (IREN A) and European Com- mission, T ech. Rep., Feb 2018. [2] M. Miller, L. Bird, J. Cochran, M. Milligan, M. Bazilian, E. Denny , J. Dillon, J. Bialek, M. O’Malley , and K. Neuhoff, “Res-e-next: Next generation of res-e policy instruments, ” NREL, T ech. Rep., 2013. [3] AEMO, “Review of the black system south australia report system ev ent of 28 september 2016, ” Australian Energy Market Operator , T ech. Rep., 2017. [4] RG-CE System Protection & Dynamics Sub Group, “Frequency stability ev aluation criteria for the synchronous zone of continental europe, ” ENTSO-E, T ech. Rep., 2016. [5] ERCOT Concept Paper, “Future ancillary services in ercot,, ” T ech. Rep,, T ech. Rep., 2013. [6] RG-CE System Protection & Dynamics Sub Group, “Rate of change of frequency (rocof) withstand capability , ” ENTSO-E, T ech. Rep., 2018. [7] F . Sossan, E. Namor, R. Cherkaoui, and M. Paolone, “ Achieving the dispatchability of distribution feeders through prosumers data driven forecasting and model predictive control of electrochemical storage, ” IEEE T ransactions on Sustainable Energy , vol. 7, no. 4, pp. 1762–1777, Oct 2016. [8] P . Mercier, R. Cherkaoui, and A. Oudalov, “Optimizing a battery energy storage system for frequency control application in an isolated power system, ” IEEE T ransactions on P ower Systems , vol. 24, no. 3, pp. 1469– 1477, Aug 2009. [9] B. Dunn, H. Kamath, and J.-M. T arascon, “Electrical energy storage for the grid: A battery of choices, ” Science , vol. 334, no. 6058, pp. 928–935, 2011. [10] G. W ang, G. K onstantinou, C. D. T ownsend, J. Pou, S. V azquez, G. D. Demetriades, and V . G. Agelidis, “ A revie w of power electronics for grid connection of utility-scale battery energy storage systems, ” IEEE T ransactions on Sustainable Energy , vol. 7, no. 4, pp. 1778–1790, Oct 2016. [11] E. Namor, F . Sossan, R. Cherkaoui, and M. Paolone, “Control of battery storage systems for the simultaneous provision of multiple services, ” IEEE T ransactions on Smart Grid , vol. 10, no. 3, pp. 2799–2808, May 2019. [12] A. Mehrizi-Sani and R. Irav ani, “Potential-function based control of a microgrid in islanded and grid-connected modes, ” IEEE T ransactions on P ower Systems , vol. 25, no. 4, pp. 1883–1891, Nov 2010. [13] J. Rocabert, A. Luna, F . Blaabjerg, and P . Rodrguez, “Control of power con verters in ac microgrids, ” IEEE T ransactions on P ower Electronics , vol. 27, no. 11, pp. 4734–4749, Nov 2012. [14] M. Paolone, A. Monti, T . Gaunt, T . V an Cutsem, X. Guillaud, V . V ittal, M. Liserre, C. V ournas, and S. Meliopoulos, “Fundamentals of power systems modelling in the presence of conv erter-interfaced generation, ” June 2020, to be published in 21st Power Systems Computation Con- ference (PSCC). [15] J. Beerten, O. Gomis-Bellmunt, X. Guillaud, J. Rimez, A. van der Meer, and D. V an Hertem, “Modeling and control of hvdc grids: A key challenge for the future power system, ” in 2014 P ower Systems Computation Confer ence , Aug 2014, pp. 1–21. [16] J. A. Baroudi, V . Dinav ahi, and A. M. Knight, “ A revie w of power con verter topologies for wind generators, ” Renewable Energy , vol. 32, no. 14, pp. 2369 – 2385, 2007. [17] F . Milano, F . Drfler, G. Hug, D. J. Hill, and G. V erbi, “Foundations and challenges of low-inertia systems (invited paper), ” in 2018 P ower Systems Computation Conference (PSCC) , June 2018, pp. 1–25. [18] A. Adrees, J. V . Milanovi, and P . Mancarella, “Effect of inertia het- erogeneity on frequency dynamics of low-inertia power systems, ” IET Generation, T ransmission Distribution , vol. 13, no. 14, pp. 2951–2958, 2019. [19] P . V . Brogan, R. J. Best, D. J. Morrow, K. McKinley, and M. L. K ubik, “Effect of bess response on frequency and rocof during underfrequency transients, ” IEEE T ransactions on P ower Systems , vol. 34, no. 1, pp. 575–583, Jan 2019. 21st Power Systems Computation Conference PSCC 2020 Porto, Portugal — June 29 – July 3, 2020 [20] DESL-EPFL, “Extension of the IEEE 39-b us T est Network for the Study of Fundamental Dynamics of Modern Power System, ” 2019. [Online]. A vailable: https://github.com/DESL- EPFL/ Extension- of- the- IEEE- 39- bus- T est- Networkfor- the- Study- of- Fundamental- Dynamicsof- Modern- Power - System [21] R. Byerly , D. Sherman, and R. Bennon, “Phase II: frequency domain analysis of low-frequency oscillations in large electric power systems. V olume 1.” W estinghouse Electric Corp., Pittsburgh, P A (USA). Ad- vanced Systems, T ech. Rep., 1982. [22] “Dynamic models for steam and hydro turbines in power system studies, ” IEEE T ransactions on P ower Apparatus and Systems , no. 6, pp. 1904–1915, 1973. [23] “Ieee draft recommended practice for excitation system models for power system stability studies, ” IEEE P421.5/D38 , pp. 1–202, Jan 2015. [24] “Ieee guide for synchronous generator modeling practices and applica- tions in po wer system stability analyses, ” IEEE Std 1110-2002 (Re vision of IEEE Std 1110-1991) , pp. 1–72, 2003. [25] “Determination of synchronous machine stability study models. volume 1, ” W estinghouse Electric Corp., Pittsbur gh, P A (USA). Advanced Systems, T ech. Rep., 1981. [26] “Determination of synchronous machine stability study models. volume 2, ” W estinghouse Electric Corp., Pittsbur gh, P A (USA). Advanced Systems, T ech. Rep., 1981. [27] P . Pourbeik et al. , “Dynamic models for turbine-governors in po wer system studies, ” IEEE T ask F orce on T urbine-Governor Modeling , 2013. [28] “Ieee guide for the application of turbine governing systems for hydro- electric generating units - redline, ” IEEE Std 1207-2011 (Revision to IEEE Std 1207-2004) - Redline , pp. 1–139, June 2011. [29] “Hydraulic turbine and turbine control models for system dynamic studies, ” IEEE T ransactions on P ower Systems , vol. 7, no. 1, pp. 167– 179, Feb 1992. [30] P . Kundur, N. J. Balu, and M. G. Lauby , P ower system stability and contr ol . McGra w-hill New Y ork, 1994, vol. 7. [31] R. Ramos, I. Hiskens et al. , “Benchmark systems for small-signal stability analysis and control, ” IEEE Power and Energy Society , T ech. Rep. PES-TR18, August 2015. [32] “Load representation for dynamic performance analysis (of power sys- tems), ” IEEE T ransactions on P ower Systems , vol. 8, no. 2, pp. 472–482, May 1993. [33] A. Dervi ˇ skadi ´ c, P . Romano, M. Pignati, and M. Paolone, “ Architecture and experimental validation of a low-latency phasor data concentrator , ” IEEE Tr ansactions on Smart Grid , vol. 9, no. 4, pp. 2885–2893, July 2018. [34] C. Dufour and J. Belanger, “ A real-time simulator for doubly fed induction generator based wind turbine applications, ” in 2004 IEEE 35th APESC , vol. 5, June 2004, pp. 3597–3603. [35] R. Pena, J. C. Clare, and G. M. Asher , “Doubly fed induction generator using back-to-back pwm con verters and its application to variable-speed wind-energy generation, ” IEE Proceedings - Electric P ower Applica- tions , vol. 143, no. 3, pp. 231–241, May 1996. [36] GE Energy , “ Analysis of wind generation impact on ercot ancillary services requirements, ” 2008. [37] K. Coughlin and J. H. Eto, “ Analysis of wind power and load data at multiple time scales, ” Lawrence Berkele y National Laboratory (LBNL), Berkeley , CA (United States), T ech. Rep., 2010. [38] Y . Zuo, F . Sossan, M. Bozorg, and M. Paolone, “Dispatch and primary frequency control with electrochemical storage: A system-wise verifica- tion, ” in 2018 IEEE PES ISGT -Europe , Oct 2018, pp. 1–6. [39] M. Chen and G. Rincon-Mora, “ Accurate electrical battery model capable of predicting runtime and i-v performance, ” IEEE T ransactions on Ener gy Con version , vol. 21, June 2006. [40] B. Y . Liaw , G. Nagasubramanian, R. G. Jungst, and D. H. Doughty , “Modeling of lithium ion cellsa simple equi valent-circuit model ap- proach, ” Solid State Ionics , vol. 175, 2004. [41] E. Namor, F . Sossan, E. Scolari, R. Cherkaoui, and M. Paolone, “Experi- mental assessment of the prediction performance of dynamic equiv alent circuit models of grid-connected battery energy storage systems, ” in IEEE ISGT , 2018. [42] C. Dufour , J. Mahseredjian, and J. Belanger , “ A combined state-space nodal method for the simulation of power system transients, ” IEEE T ransactions on P ower Delivery , vol. 26, no. 2, pp. 928–935, April 2011. [43] R. Shah, J. C. Snchez, R. Preece, and M. Barnes, “Stability and control of mixed acdc systems with vsc-hvdc: a revie w , ” IET Generation, T ransmission Distribution , vol. 12, no. 10, pp. 2207–2219, 2018. [44] M. S. Khan and M. R. Ira vani, “Hybrid control of a grid-interactiv e wind energy con version system, ” IEEE T ransactions on Energy Con version , vol. 23, no. 3, pp. 895–902, Sep. 2008. [45] Q. T aoufik, C. Quentin, L. Chuanyue, G. Xa vier , C. Frederic, G. Franc ¸ ois, and K. Xavier , “Deliverable 3.2: Local control and sim- ulation tools for large transmission systems, ” in MIGRATE pr oject , https://www .h2020-migrate.eu/downloads.html, Dec 2018. [46] G. Denis, T . Prevost, P . Panciatici, X. Kestelyn, F . Colas, and X. Guil- laud, “Improving robustness against grid stiffness, with internal control of an ac v oltage-controlled vsc. ” in 2016 IEEE P ower and Energy Society General Meeting (PESGM) , July 2016, pp. 1–5. [47] G. Denis, T . Prevost, P . Panciatici, X. Kestelyn, F . Colas, and X. Guil- laud, “Review on potential strategies for transmission grid operations based on power electronics interfaced voltage sources, ” in 2015 IEEE P ower Ener gy Society General Meeting , July 2015, pp. 1–5. 21st Power Systems Computation Conference PSCC 2020 Porto, Portugal — June 29 – July 3, 2020
Original Paper
Loading high-quality paper...
Comments & Academic Discussion
Loading comments...
Leave a Comment