Comparison of AATR and WTEC indices in the studies of the level of ionospheric disturbance
A comparative statistical analysis of AATR and WTEC indices was conducted based on data from the ISTP SB RAS GNSS receivers network. It is shown that at high levels of ionospheric disturbance (for WTEC > 0.1 TECU), the AATR index is proportional to the WTEC index with a factor of $1.5min^{-1}$. At small levels of ionospheric disturbance (for WTEC < 0.1 TECU), this proportionality is violated. It is shown that the contribution of daily dynamics of the background ionosphere to the AATR index is higher than to the WTEC index. This leads to a higher sensitivity of the WTEC index to disturbances. This also leads to violating the proportionality between WTEC and AATR indices at low levels of ionospheric disturbance. It is shown that at high latitudes the dynamics of the WTEC and AATR indices correlate significantly with the level of geomagnetic disturbance Kp. At mid-latitudes, the contribution of solar radiation variations (F10.7 index) and vertical seismic variations exceeds the influence of Kp variations. The program for calculating WTEC indices, used in the paper is put into open access.
💡 Research Summary
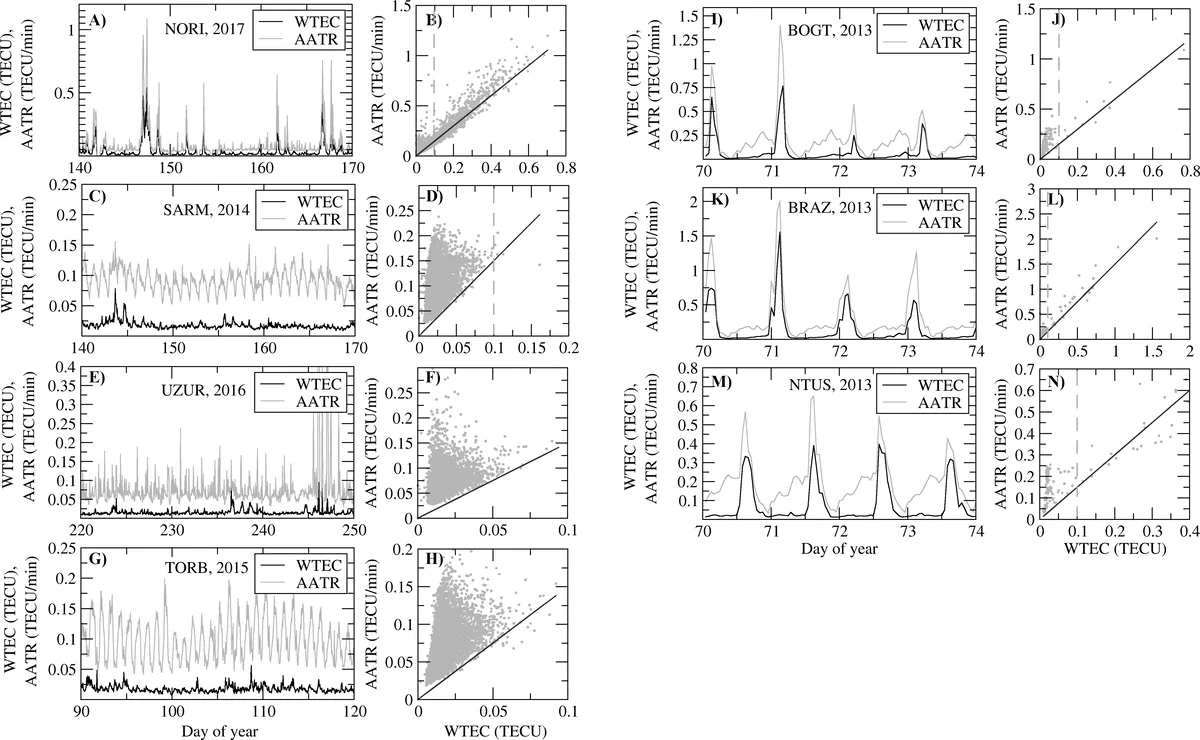
The paper presents a systematic comparison of two total electron content (TEC)‑based indices—AATR (Along‑Arc TEC Rate) and WTEC (Variations of Vertical TEC)—for monitoring ionospheric disturbances. Using dual‑frequency GNSS data from the ISTP SB RAS network, the authors processed continuous, gap‑free STEC series from 2014 to 2017 at high‑latitude (NORI), mid‑latitude (Baikal network, 10 stations), and low‑latitude (IGS stations NTUS, BOGT, BRAZ) sites. After rigorous preprocessing (LLI‑based gap detection, cycle‑slip removal via second‑derivative thresholds of 17–26 TECU min⁻², and exclusion of satellite elevations below 15°), they computed AATR as the RMS of the slant‑to‑vertical ROT (rate of change of TEC) over one‑hour windows (units TECU min⁻¹) and WTEC as the weighted average of absolute vertical TEC fluctuations filtered with a 10‑minute moving average (units TECU, 30 s resolution). Both algorithms were merged into an open‑source software package, and WTEC series were down‑sampled to one‑hour resolution for direct comparison.
Statistical analysis revealed a clear regime dependence. For WTEC > 0.1 TECU—commonly observed at high latitudes and the equatorial region—the two indices obey a linear relationship AATR ≈ 1.5 min⁻¹ · WTEC, with correlation coefficients exceeding 0.85. This indicates that both indices capture the same large‑scale ionospheric perturbations (e.g., geomagnetic storm‑driven disturbances). In contrast, at mid‑latitudes where WTEC values are typically below 0.1 TECU, the proportionality breaks down; AATR values remain relatively high due to a persistent diurnal background component, leading to an inequality AATR ≥ 1.5 · WTEC. The authors interpret this as AATR containing an additional constant term (~0.1 TECU min⁻¹) that becomes significant only when WTEC is small.
To elucidate the drivers of these variations, the authors performed multiple linear regression using four external parameters: geomagnetic activity (Kp), background vertical TEC from global ionosphere maps (VTEC), solar radio flux (F10.7), and vertical seismic displacement (dZ) from the nearby Talaya station. At high latitudes, Kp emerged as the dominant predictor (β≈0.62, adjusted R²≈0.71), confirming that geomagnetic storms dominate ionospheric dynamics there. At mid‑latitudes, solar flux (β≈0.34) and seismic activity (β≈0.28) contributed more strongly than Kp (β≈0.15), highlighting the importance of solar radiation and ground‑generated acoustic waves in generating medium‑scale TEC fluctuations. VTEC showed a modest negative influence on both indices, reflecting that higher background electron density reduces the relative amplitude of disturbances.
Sensitivity tests with specific events (e.g., the 2015 geomagnetic storm and the 2013 Chelyabinsk meteor) demonstrated that during strong disturbances the two indices are interchangeable at high and low latitudes. However, for subtle perturbations typical of mid‑latitude conditions, WTEC proved more responsive, detecting variations as low as 0.05 TECU, whereas AATR’s signal was masked by its larger diurnal background component.
The paper concludes that AATR and WTEC, while derived from the same STEC data and covering similar spatial footprints (≈1500–2000 km radius), differ in temporal resolution and sensitivity to background dynamics. WTEC is preferable for detecting weak, medium‑scale disturbances, especially at mid‑latitudes, whereas AATR can be used effectively at high latitudes where disturbances are strong. The open‑source implementation provided by the authors enables consistent, reproducible calculation of both indices, facilitating future studies of ionospheric variability and improving GNSS service quality assessments.
Comments & Academic Discussion
Loading comments...
Leave a Comment