Anomaly Detection and Prototype Selection Using Polyhedron Curvature
💡 Research Summary
The paper introduces a novel geometric approach to anomaly detection, instance ranking, and prototype selection, centered on the concept of polyhedron curvature. Each data point is treated as a vertex of an imagined polyhedron whose faces are defined by its k‑nearest neighbors (k‑NN). The curvature at a vertex is quantified by the sum of cosine similarities between all pairs of edge vectors emanating from that vertex. Because a sharper corner (smaller interior angles) yields larger cosine values, the resulting anomaly score is directly proportional to the curvature: higher scores indicate more anomalous points.
The basic method, Curvature Anomaly Detection (CAD), computes this score using a simple O(k²) summation (Equation 1). For out‑of‑sample points, the same k‑NN search is performed against the training set, and the score is evaluated in the same way. To automatically separate normal from anomalous points, the authors apply a two‑cluster K‑means to the score distribution; the cluster with the larger mean is declared anomalous.
Recognizing that many real‑world data sets exhibit non‑linear structures, the authors extend CAD to a kernelized version (K‑CAD). A mapping φ: X → H projects data into a high‑dimensional feature space. Distances and inner products are computed via a kernel function k(·,·). The neighbor vectors are represented by kernel entries, which are normalized to obtain cosine‑like similarities. The anomaly score in feature space becomes the average of the normalized kernel matrix entries (Equation 2). Experiments reveal that for certain kernels (RBF, Laplacian, polynomial) the score ordering reverses, prompting the authors to suggest either multiplying scores by –1 or selecting the cluster with the smaller mean as anomalous.
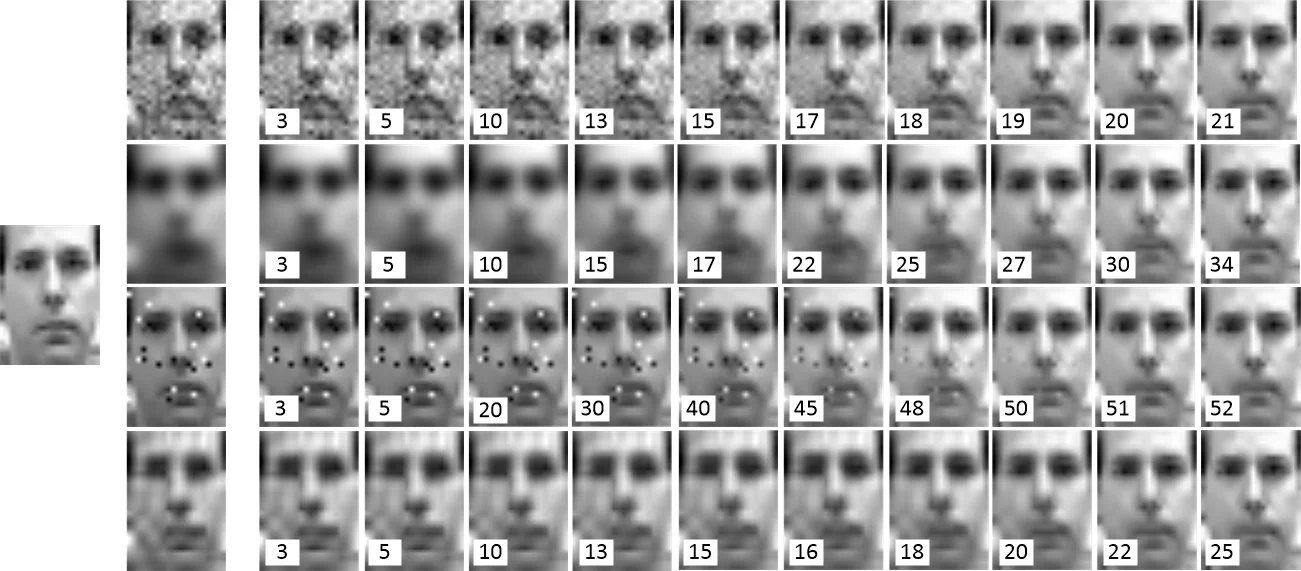
Beyond detection, the paper defines an “anomaly landscape” – a scalar field over the input space where each location’s value equals its anomaly score – and an “anomaly path”, the trajectory that a point would follow when moving from a normal to an anomalous state (or vice‑versa). The path is obtained by gradient descent on the CAD score (Equation 3). Because the gradient can be analytically derived only for the original Euclidean formulation, anomaly paths are unavailable for K‑CAD. The authors demonstrate the utility of these concepts in an image denoising experiment, where moving points downhill on the landscape effectively removes noise.
The inverse perspective, Inverse CAD (iCAD), simply multiplies CAD scores by –1, thereby turning the anomaly ranking into a relevance ranking. High iCAD scores correspond to points that are most representative of the normal class. This ranking can be used for prototype selection in two ways: (I) retain a top‑percentage of points with the highest scores, or (II) apply K‑means clustering to the scores and keep the cluster with the larger mean. Kernel iCAD (K‑iCAD) follows the same principle in feature space, with the same caveat about kernel‑dependent score reversal.
Experimental evaluation includes three synthetic 2‑D data sets (two moons, homogeneous clusters, heterogeneous clusters) and five real‑world benchmark data sets (Speech, Optical Digits, Arrhythmia, Wine, Musk) with anomaly proportions ranging from 1.65 % to 15 %. Using k = 10, CAD/K‑CAD are compared against Isolation Forest, LOF, One‑Class SVM (RBF kernel), and Elliptic Envelope. Results are reported in terms of average Area Under the ROC Curve (AUC) and average runtime over 10‑fold cross‑validation (2‑fold for the small Wine data). K‑CAD consistently achieves higher AUCs, especially on high‑dimensional data (e.g., 400‑dim speech), while maintaining comparable computational cost. The synthetic experiments illustrate that CAD correctly flags boundary points as anomalies, whereas K‑CAD (with appropriate kernels) can treat those same points as normal, highlighting the influence of kernel choice.
In conclusion, the authors present a conceptually simple yet powerful method that leverages geometric curvature to detect outliers and select representative prototypes. The approach is easy to implement, requires only nearest‑neighbor searches and inner‑product calculations, and can be readily kernelized to handle non‑linear structures. Limitations include the O(k²) cost per point and sensitivity to kernel parameters, which the authors acknowledge as directions for future work. Potential extensions involve theoretical analysis of kernel‑induced score reversal, scalable approximations for large‑scale data (e.g., approximate nearest neighbors), and broader applications of anomaly landscapes and paths in domains such as image restoration, time‑series anomaly explanation, and active learning.
Comments & Academic Discussion
Loading comments...
Leave a Comment