Analysis of retinal and choroidal images measured by laser Doppler holography
Laser Doppler holography (LDH) is a full-field imaging technique that was recently used in the human eye to reveal blood flow contrasts in the retinal and choroidal vasculature non-invasively, and with high temporal resolution. We here demonstrate th…
Authors: L. Puyo, M. Paques, M. Fink
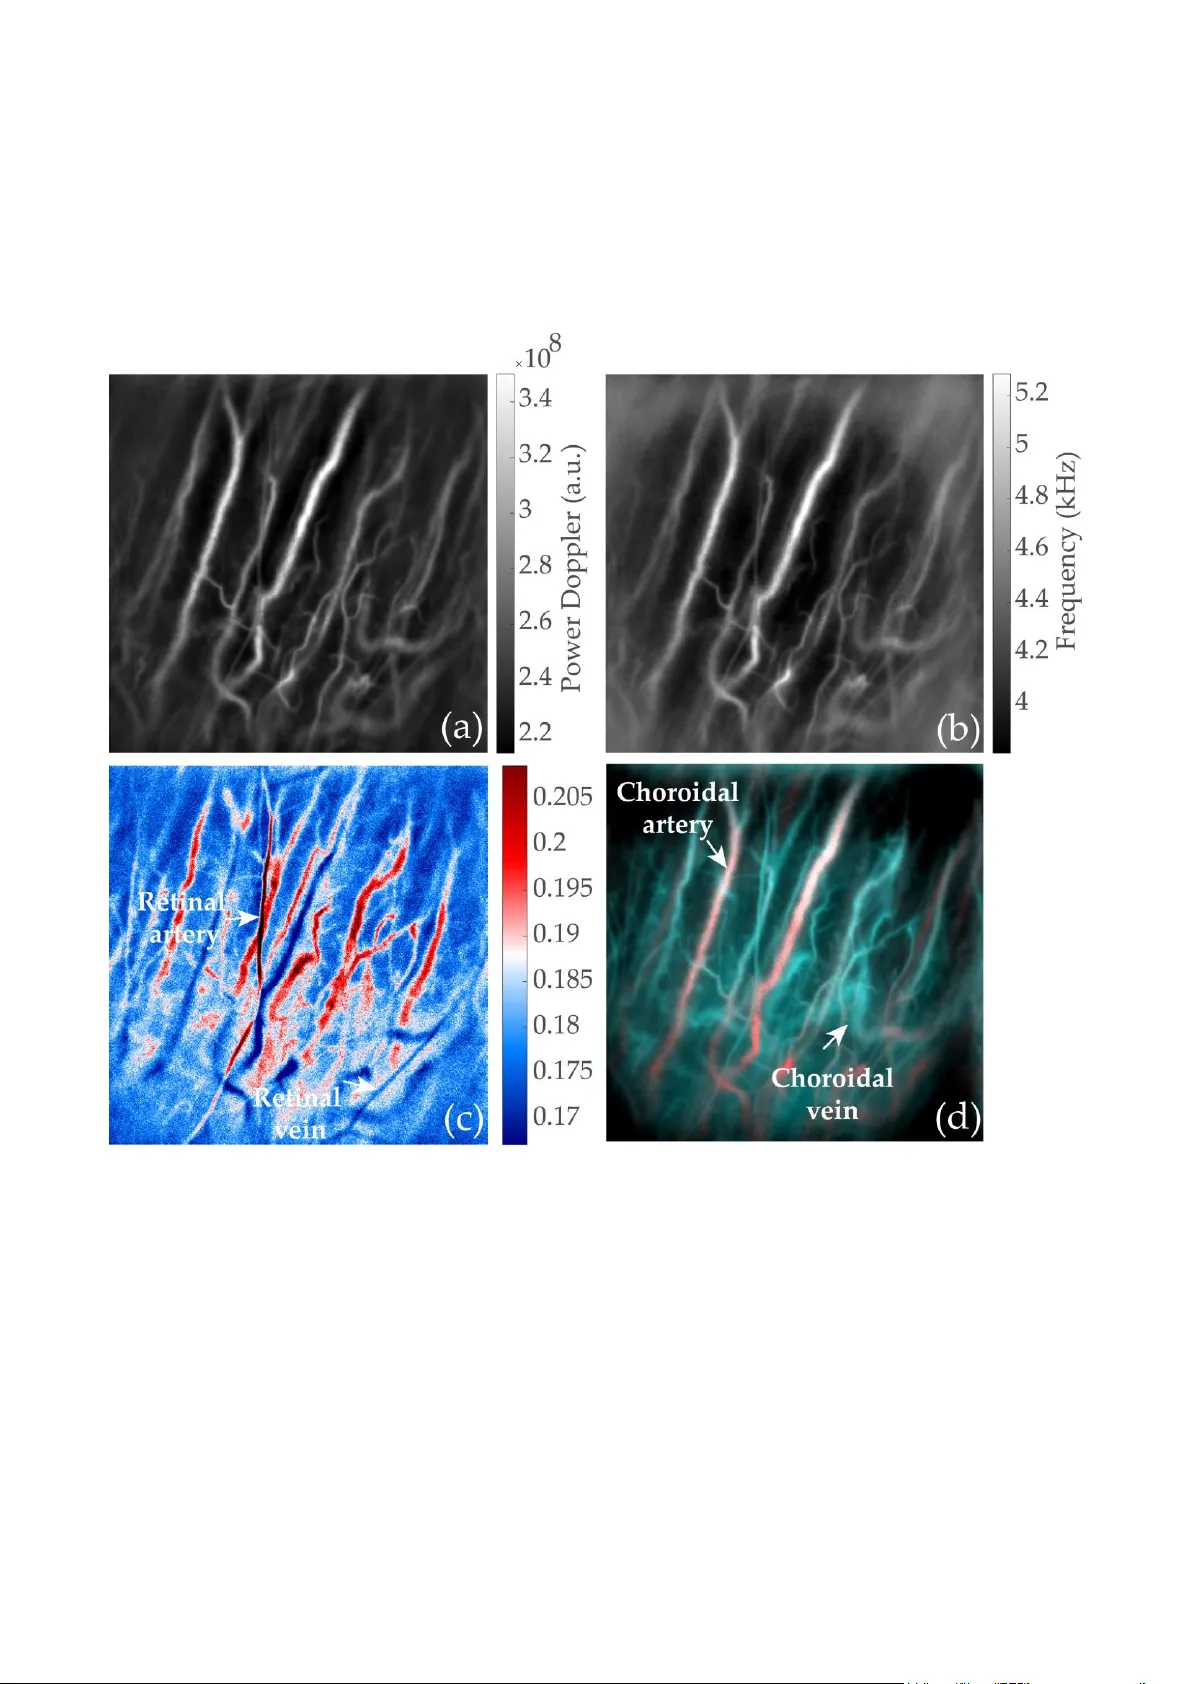
Analysis of retinal and cho roidal images measured by laser Doppler holography L. Puyo* a , M. Paques b , c , M. Fink a , J-A Sahel b, c , M. Atlan a a Institut La ngevin, CNRS, PSL Research University, ESPCI Paris, 1 rue Jussieu. Paris. France b I nstitut de la Vision, 17 rue Moreau, 75012 Paris. France c Centre d'investigation clinique des Quinze-Vingts. INSERM. 28 rue de Charenton, Paris. France ABSTRACT Laser Doppler holograph y (LDH) is a full -field imaging techniq ue that was recently used in the hu man eye to rev eal blood flow contrasts in the ret inal a nd c horoidal vasculature non -invasively, and with high temporal resol ution. We here demonstrate that the abilit y o f LDH to perform q uantitative flow measurements with high tempor al resolution enable s arteriovenous differentiation in the retina a nd choro id. In the retina, ar teries and vei ns can be differentiated on the bas is of their resp ective po wer Do ppler wavefor ms. Choroid al ar teries and vei ns can i nstead be discri minated b y computing low and high freque ncy power Do ppler images to reveal lo w and high blood flow images, r espectively. Keywords: Digital holography , op hthalmology, blood flo w , choroid, laser Doppler 1. INTRODUCTION The study of th e retinal and choroidal circulations is of major interest to improve our understanding of increasing ly prevalent disea ses suc h as diabetic retinopath y, age -related macular degeneration (AM D), glaucoma, and h ypertension. In the last decade, the irruption and development of o ptical coherence to mography (O CT) and subsequen tly of OCT - angiography ( OCT-A) has allo wed for a comprehensive stud y of the fundus vasculat ure anato my in health a nd disea se [1 , 2], but these tech nologies have so far not been able to de monstrate b lood flow d ynamics measurements due to t heir limited temporal resolutio n. Other techniques such as laser speckle flowgraphy are able to evidence retinal hypoperfusion inher ent to some ocular diseases as is the case in glauco ma [ 3]. Laser Doppler flo wmetry ( LDF) is another blood flo w monitoring tec hnique based o n a short- ti me Fourier tra nsform method , carried out to a nalyze the time profile charac teristics o f the Doppler spectrum to extract blood f low co ntrast with a temporal resolution sufficient to observe the cha nges transient to cardiac cycles [4]. However, this technique is perfor med only at a single lo cation, and scanning i mplementations with the aim of imaging a two dimensional (2 -D) field o f view have to make a tradeoff between temporal reso lution and the spatial e xtent of the i nvestigated area. Thus so far flying spot and line-scanning LDF have not de monstrated hemodynamics meas urements over a 2 -D field of view [5 , 6]. Laser Doppler holography (LDH) is a full - field ima ging te chnique that was r ecently used in t he human e ye, to reveal blood flow contrasts in retinal and c horoidal vascular networks, non -invasively, with high te mporal resolution [7 , 8]. It consists in the measurement of optical holograms acquired with near infrared radiation (785 nm) w ith an ultrahigh - speed camera , follo wed by a temporal Fourier transfor m analysis o f the digital holograms. Several contributio ns such as pulsatile b lood f low in retinal and choroid al cap illaries and large vessels, ocular m ovements and o ptical diffusion participate to the power Dop pler signal measured in LDH. We here de monstrate the use of t wo differe nt processe s to analyze the reconstructed po wer Dop pler images in o rder to achieve an arteriovenous differentiatio n i n the reti na a nd choroid. In the retina, t he p rocess is b ased on analyzing sy stolo diastolic blood flo w variations on the full-field of view , and as ar teries present greater v ariations of blood flow, th ey can be easily discri minated fro m veins . This a nalysis is carried out through the calculatio n of the pixel -wise resistivity index. Then we take ad vantage of t he f act tha t LDH allows to r econstruct sep arate images corresponding to different ranges of Dopp ler broadening. T wo d ifferent po wer Doppler images correspo nding to t he low and high freque ncy shifts are built. I n t he ce ntral vision, these t wo images can each preferentiall y reveal a certain type of vessels. Figure 1 . Optical setup. L1, L2 and L3: converging lenses. PBS: Polarizing Beam-Splitter. BS: Beam-Splitter. Light source: single frequency laser diode (SWL- 7513 -H-P, New port). The retina is illuminated with the narrow frequency laser, then the Doppler broadened beam is combined with the reference beam. The resulting interfe rence pattern is recorded with a CMOS camera (Phantom V2511, Ametek) running at a frame rate up to 75 kHz in 512x512 format. 2. METHODS & RESULTS The experi mental setup u sed for this study, sho wn in Fig . 1 , co nsists of a fiber Mac h -Zehnder op tical interferometer. T he light source is a 45 mW single -mode, fiber la ser diod e (Newport SW L- 7513 -H-P) at wavelengt h 7 85 nm , spatially a nd temporally co herent. T he retina is ill uminated with 1.5 mW of constant expo sure over 4 x 4 mm. A Polarizing Beam Splitter (PBS) cube is used in the obj ect arm to illuminate the e ye and co llect the lig ht b ackscattered b y the retina with the ca mera. The ob ject and collimated reference wa ves are c ombined using a non -polarizing beam splitter cube a nd the y interfere o n t he sensor p lane. T he polarization of the reference wave is adjusted with a half -wave plate and a polarizer to optimize fringe co ntras t. Inter ferograms are record ed on a fast CMOS ca mera ( Ametek - Ph antom V251 1, 60 or 75 kHz, 512x51 2 format, quantum efficiency 40 %, 12-bit pi xel depth , pixel s ize 28 µm) a nd are pr ocessed offline using Matlab . The ra w inter ferograms are fir st p ropagated nu merically using t he angular spectr um propaga tion method. Except i n the cases of unusuall y s w ollen c horoid , the depth of field of the i mages is lar ge e nough so that both the retinal and chor oidal vasculatures are reconstructed in the same holographic i mage. T hen in our ap proach, cross-beati ng ter ms of the interferograms ca rry the optical Doppler broadening a nd d ata processing co nsists of measuring t he local o ptical te mporal fluctuations. To that end a short-time Fourier trans form an alysis is performed with a window size of 51 2 images (twin) and an o verlap bet ween t w o c onsecutive windows o f 256 images. T he po wer Doppler images are obtained by inte grating the highest frequencies o f the Fo urier transfor m of the sq uared magnitude of t he reconstructed holograms. T he frequency threshold is generally set between 6 and 10 kHz. Once the po wer Doppler movie sequence of the LDH measurement has been calculated, the intensity variations are analyzed p ixel -wise. The standard deviation and average power Doppler images are calculated and their ratio y ields t he coef ficient o f variation i mage. Because they have greater bloo d flo w variations durin g cardiac c ycles than i n veins, ar teries co me out in red. The p rocess used to obtain t he arteriovenou s maps in the retina fro m the raw interfero grams is illustrated in Fig. 2. Figure 2. Processing of the holograms after nume rical prop agation. T he short -time Fourier transform analysis is ca rried out to obtain a blood flow movie with a sliding window of 6.8 ms in the case of a 75 kHz measurement. The standard deviation and average power Doppler images are calculated. Their ratio y ields the coefficient of variatio n image; with this colorma p arteries come out in red, and veins in dark blue. To discriminate these contributions, we a nalyzed t he reconstructed po wer Doppler wavefor ms u sing different Doppler f requency ranges. Very lo w freq uency shifts are domi nated by g lobal e ye movements s uch as fixational e ye movements and fundus pulsatio ns. Low frequency s hifts reveal slo w ocular movements and vessels ca rrying slo w b lood flows. On the contrary high frequency shifts re veal blood vessels ca rrying great b lood flows. In practice we us e the frequency ra nges 2 .5 – 6 kHz and 10 – 30 kHz to reveal the low and hi gh blood flows. T hese t wo ima ges are th en merged into a single co mposite color image: low blood flow are encoded in cyan and high b lood flow in red [ 8 ]. Figure 3. Different images are obtained using various imag e processing on the same dataset. (a) Power Doppler image showing most vessels from the retina and choroid. (b) Mean frequency shift calculated from the Doppler power spectrum density revealing vessels with a simila r contrast. (c) Coefficient of variation image revealing retinal arteries in red and retinal veins in blue. (d) Composite color image revealing choroidal arteries in red and choroidal vei ns in blue. In Fig. 3 w e s how t he results o f the two methods we m entioned. First in Fig. 3(a) and (b) are displayed the power Dop pler and mean frequency s hift images that reveal the retinal a nd choroidal vasculatures. T he arteries and veins from both vasculature can ho wever not be disti nguished o n the basis o f the flow value s as they are averaged over se veral cardiac cycles. Ho wever i n the coefficient o f variatio n map in Fig. 3(c), a differenc e o f co ntrast bet ween retinal arteries and veins ca n b e observed. The retinal arteries co me out in r ed due to their larger systolodiastolic variations whereas the retinal arteries co me out in blue. T he effect of this pr ocessing for choroidal vessels is les s efficient . Finally, in the composite co lor image i n Fi g. 3(d) , choroidal arteries which are visible i n the hi gh Dopp ler frequency shift i mage (n ot displayed h ere) come out in red , whereas c horoidal veins co me out in blue b ecause they ar e r evealed in the low frequency shift image. LD H is thus able to d istinguish arteries and veins fro m both the retinal and choroidal layers. 3. CONCLUSION We have found that wideband laser Dop pler holograp hy operating at 785 nm can image th e r etinal and choroidal vasculatures n on -invasively while keep ing t he retinal fu ll-field exposure under 10 mW /cm². Power Doppler measurements at hig h te mporal resolution in the retina allo w to reveal t he sp ecific blood flow b ehavior in arteries and veins. Coefficient of variat ions maps can be calculated from pixel- wise flow variations a nd lead to a retinal arter iovenous discrimination. In the chor oid, the instru ment is esp ecially sensiti ve to large blood flo ws and thus preferentia lly re veals choroidal arter ies and ar terioles, eve n at large dept h. Additionally , bandp ass filteri ng the Do ppler spectr um allows to separate vessels accord ing to their flows which opens po ssibilities for b asic flow anal ysis i n the c horoid. Indeed, because there exists large differences of blood flow in the choro id bet ween arteries and veins, a basic flo w analysis leads to an arteriovenous segregatio n. ACKNOWLEDG EMENTS This work was supp orted by LABEX WIFI (Labo ratory of Excellence ANR - 10 -LABX-24) within the French Progra m Investments for the Future u nder Reference ANR -10-IDEX- 0001 -02 PSL, and the European Research Co uncil (ERC Synergy HELMHO LTZ, grant agree ment #610 110) REFERENC ES [1] Kashani, A. H., Chen, C. L., Gahm, J . K. , Zheng, F., Richter, G. M. , Rosenfeld, P . J ., Shi Y, & Wang, R. K. “ Optical coherence tom ogra phy angi ography: A co mprehensive revie w of current me t hods and clinical applications” Pr og. Retin. Eye Res., 60 , 66-100. ( 2017). [2] Mrejen, S., & Spaide, R. F. “ Optical co herence to mography: imaging o f the choroid and beyond ” Survey o f ophthalmology, 58(5), 387 -429 (2013). [3] Mursch-Edlmayr, A. S., Luft, N., P odkowinski, D., Ri ng, M., Schmetterer , L., & Bolz, M. “ Laser speckle flowgraphy derived characteristics of optic nerve head perfusion i n normal tension glaucoma and healthy individuals: a Pilo t study ” Sci. Repo rts, 8(1), 5343. (2018) [4] Riva, C. E., Geiser , M., Petrig, B. L., & Ocular Blood Flo w Research Association. “ Ocular blood flow assessment using con ti nuous laser Dopp ler flowmetry” Acta ophthalmologica, 88 (6), 622 - 629. (2010) [5] Michelson, G., Sch mauss, B. , La nghans, M. J., Har azny, J ., & Gr oh, M. J. “ Principle, validit y, and reliab ility of scanning laser Dop pler flowmetry ” Journal of glaucoma, 5 (2), 99 -105. (1996). [6] Mujat, M., Lu, Y., Maguluri, G., Zhao, Y., Iftimia, N., & F erguson, R. D. “ Visualizing the vasculat ure of the entire human eye posterio r hemi sphere without a contrast agent” Bio med. Opt. Express, 10( 1), 167 -180. (2019) [7] Puyo, L., Paques, M., Fin k, M. , S ahel, J. A., & Atla n, M . “ In vivo laser Do ppler holography o f the human retina ” Bio med. Opt. Express, 9(9 ), 4113-4129 (2018). [8] Puyo, L., P aques, M., Fink, M. , Sahel, J . A., & Atlan, M. “ Choroidal vasculature imaging with laser Do ppler holography ” Bio med. Opt. Express 10(2), 995- 1012. (2019).
Original Paper
Loading high-quality paper...
Comments & Academic Discussion
Loading comments...
Leave a Comment