Are all the frames equally important?
In this work, we address the problem of measuring and predicting temporal video saliency - a metric which defines the importance of a video frame for human attention. Unlike the conventional spatial saliency which defines the location of the salient …
Authors: Oleksii Sidorov, Marius Pedersen, Nam Wook Kim
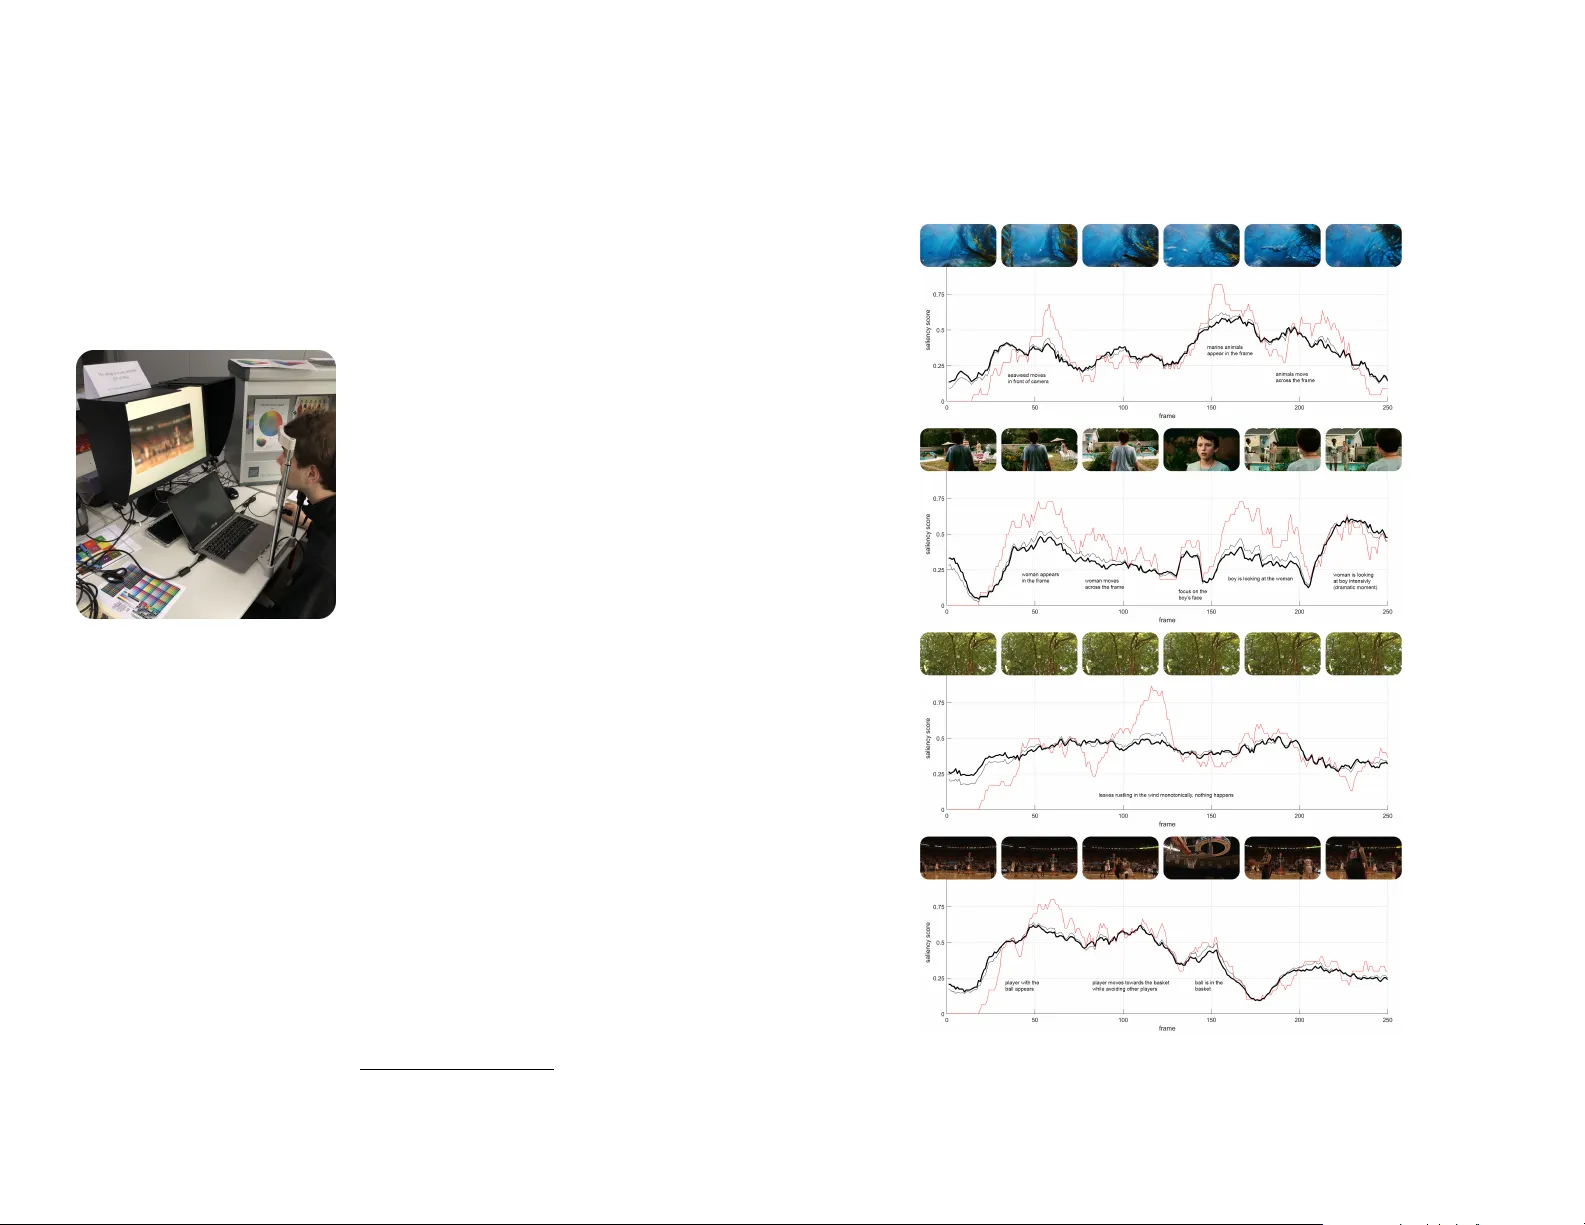
Are All the Frames Equall y Impor tant? Oleksii Sidoro v Marius Peder sen The Norwegian Colour and Visual Computing Laboratory , NTNU Gjøvik, Norwa y oleksiis@stud.ntnu.no marius.pedersen@ntnu.no Nam W ook Kim Harvard University Cambridge, USA namwkim@seas.harvard.edu Sumit Shekhar Adobe Research San Jose, USA sushekha@adobe.com P ermission to make digital or hard copies of par t or all of this work f or personal or classroom use is granted without f ee provided that copies are not made or distributed for profit or commercial adv antage and that copies bear this notice and the full citation on the first page. Cop yrights for third-party components of this work must be honored. For all other uses , contact the owner/author(s). CHI ’20 Extended Abstracts, April 25–30, 2020, Honolulu, HI, USA. © 2020 Copyright is held by the author/o wner(s). ACM ISBN 978-1-4503-6819-3/20/04. http://dx.doi.org/10.1145/3334480.3382980 Abstract In this work, we address the problem of measuring and pre- dicting temporal video saliency - a metric which defines the impor tance of a video frame f or human attention. Unlike the conv entional spatial saliency which defines the location of the salient regions within a frame (as it is done f or still im- ages), temporal saliency considers impor tance of a fr ame as a whole and ma y not exist apart from context. The proposed interf ace is an interactiv e cursor-based al- gorithm for collecting e xper imental data about temporal saliency . W e collect the first human responses and perform their analysis. As a result, we show that qualitativ ely , the produced scores hav e ver y e xplicit meaning of the semantic changes in a frame, while quantitativ ely being highly corre- lated between all the observers. Apar t from that, we sho w that the proposed tool can simul- taneously collect fixations similar to the ones produced by e ye-tr ack er in a more aff ordable wa y . Fur ther , this ap- proach ma y be used for creation of first tempor al saliency datasets which will allow training computational predic- tive algorithms. The proposed interf ace does not rely on any special equipment, which allo ws to run it remotely and cov er a wide audience. A uthor Ke ywor ds Attention; video; saliency; temporal saliency; e ye-trac king CCS Concepts • Information systems → Multimedia information sys- tems; • Human-centered computing → Human computer interaction (HCI); User interface toolkits; Introduction It seems obvious that some fr agments of a video are more impor tant than others. Such fragments concentr ate most of the view er’ s attention while others remain of no interest. The naïve e xamples are: a culmination scene in a movie , a screamer in a horror film, the moment of an e xplosion, or e ven a slight motion in v ery calm footage. W e denote such fragments as groups of fr ames with high temporal saliency . Inf or mation about tempor al saliency is an essential par t of a video characterization which gives v aluable insights about the video structure. Such information is directly applicable in video compression (frames which do not attract attention ma y be compressed more), video summarization (salient frames contain the most of perceiv ed video content), in- de xing, memorability prediction, and others tasks. So , the reader ma y expect that there is a big n umber of algorithms and techniques aimed at measuring and predicting tempo- ral saliency . Howe ver , this is not the case. The most, if not all, of the well-known w orks on video saliency are aimed at spatial saliency , i.e. , a prediction of spatial distribution of the obser v er’s attention across the fr ame (in a similar wa y as if it was an individual image). W e hypothesiz e that this is due to the absence of established methodology f or measur ing temporal saliency in the e xperiment, which is cr ucial f or ob- taining ground truth data. Conventionally , saliency data are collected using ey e-trac king, which is a technique that pro- duces a continuous temporal signal. In other words , it does not allow to diff erentiate between the frames as a whole, because each frame produces the same kind of output – a pair of gaze fixation coordinates with a rate defined b y hardware . In this work, we propose a new methodology f or measur- ing temporal video saliency in the e xperiment – the first, to the best of our knowledge , method of this kind. For this, w e de velop a special interf ace based on mouse-contingent moving-windo w approach for measuring saliency maps of static images. W e also show that it can simultaneously gather meaningful spatial inf or mation which can serve as an appro ximation of gaze fixations. During the experiment, obser v ers are presented with re- peated blurry video-sequences which they can par tially deblur using mouse clic k (Fig. 1). Users can deb lur a cir- cular region with a center at cursor location which appro x- imates the confined area of f ocus in the human ey e fo v ea surrounded by a b lurred peripher y [3]. Since the number of clicks is limited - observers are f orced to use clicks only on most "interesting" frames which attract their attention. Sta- tistical analysis of the collected clicks allo ws to assign the corresponding le vel of importance to each frame. This infor- mation can be applied directly in numerous tasks of video processing. T o summarize , unlike the con ventional approaches which only tr y to understand where the observer looks, we also study when the obser v er pa y the most attention. Related works The straightf orward method of retrie ving the information about attention is based on the utilization of commercial ey e-trac kers ( e .g. EyeLink, T obii). Hardware-based e ye- trac king has been used widely in various studies on human- computer interaction [6][13]. A less accurate, b ut much more aff ordable , wa y of measuring saliency is based on measuring the mouse cursor position which was prov en to correlate strongly with gaze fixations [4][5][15]. The most successful algorithms of this type utilize a moving-windo w paradigm, which masks inf ormation outside of the area ad- jacent to the cursor and requires a user to mov e the cur- sor (f ollowed b y a window around it) to mak e other regions visible . Such algor ithms include Restricted F ocus Viewer software b y Jansen et al. [7] and more recent SALICON [8] and Bubb leView [10]. These algorithms were also used in large online crowdsourcing e xper iments due to the nativ e scalability of cursor-based approaches. Howe ver , they were studied only in the conte xt of spatial saliency of static im- ages. This is f air for static images , but f or video-sequences, temporal inf ormation is commonly ev en more impor tant than spatial regions. Fur thermore, there are no well-known e xperimental datasets which can provide this kind of in- f or mation 1 and be used f or training of computational algo- rithms. For e xample, the popular video saliency datasets Hollywood-2 [16], UCF spor ts [12], SA V AM [2], DHF1K [17] only provide e ye-tr acking results which are constant in the temporal domain. Figure 1: The proposed interface. A more representative video demonstration is av ailable online: [link] . Methodology Our approach is inspired by mo ving-window gaz e approx- imations methods f or still images. In the proposed setup all video frames are b lurred. Clicking the mouse deblurs a round window around the cursor . Users are demonstrated repeated video sequence during which they can click the mouse f or shor t periods of time. The total number of times when the frame was deb lurred defines temporal saliency score, while location of the cursor when the mouse b utton is pressed appro ximates gaze fixation location and allows to detect what caused the interest. Discretization Shor t fragment of a video is more lik ely to attract user’ s at- tention rather than a single frame , so we let the users k eep the mouse button pressed instead of clic king on each frame they find interesting. How ev er, when not f orced explicitly , 1 A comprehensive list of saliency datasets: http://saliency .mit.edu/datasets.html obser v ers tend to keep the mouse button pressed all the time, which is natural. Thus, to obtain v ar iation of scores , it is crucial to restr ict users artificially . Our solution is to sim- ply limit the amount of deblurred fr ames (time period), after which clicking the mouse b utton stops working, and addi- tionally limit the amount of deblurred fr ames per one con- tinuous clic k. The users cannot see the limits, instead, they learn them dur ing a test trial and then follo w them intuitiv ely . F or example , a 10-second video ma y hav e up to 4 seconds of deblurred fr ames, b ut no more than 1 second at once. In the result, a user can make 4 long clic ks 1 second each or a larger number of shor t clic ks, while w e are guaranteed to hav e at least four discrete responses after one run. Repetition The idea of repeating the videos ma y be used to gather more responses from one obser v er and have richer statis- tics. Moreov er , if a salient ev ent happens at the end, the obser v er may reach the limit bef ore seeing it, so it is neces- sar y to mak e a second round. Also , ey e-motion and cogni- tive processing are f aster than clicking the mouse, so giving the user an oppor tunity to predict when an e v ent will hap- pen is beneficial f or the creation of more accurate saliency maps with a shor ter dela y . Howe v er , we observed that in the majority of the cases, the first run is the most informa- tive one , and the user is able to detect most salient inf or- mation without preparation. Subsequent repeats lead to shifting the user’ s attention to smaller details. Eventually , we used repetition in our e xperiments, but analyz e diff erent numbers of repeats in results. Other parameters Other impor tant parameters are the b lur radius and the ra- dius of the window . Their definition requires more detailed study . The task given to an observer also influences where they look [18][10], so , this parameter depends on the par- ticular conte xt in which the experiment is perf ormed. In our case, we are interested in basic w atching of a video without a par ticular task, so we w orked under a "free-view" setup . Figure 2: Exper imental setup (the light is off during the session). Experimental setup The e xperiments were performed offline using a special setup in the laboratory (Fig. 2) f or the sake of fully-controlled conditions (in future we are also planning to run the ex- periment on Amazon Mechanical T urk f or gathering larger database, which would be impossib le to do with an eye- trac ker). The displa y used is 24.1" EIZO ColorEdge CG241W color-calibrated with X-Rite Ey e-One Pro . The distance be- tween the displa y and the obser v er was 50 cm. The code is written in MatLab with Psychtoolbox-3 [11] and is publicly a v ailable b y the link 2 . Videos with ground-truth ey e-trac king data were taken from SA V AM dataset [2] due to their high quality and diverse content. We used eight 10-seconds long HD videos includ- ing two test videos. The content of the videos is div erse and includes: a basketball game with a score moment, a calm shot of leav es in the wind, mar ine animals underwater , a cinematic scene of a child coming home, a surveillance camera f ootage of two men meeting, a suff ocating div er emerging from the water . Interf ace parameters: radius of a circular window – 200 px ( 6 . 2 ◦ visual angle), blur k ernel – Gaussian with stan- dard de viation of 15, video duration – 10 s, limit of deb lurred frames per one round – 4 s (100 frames), limit of deb lurred frames at one clic k – 1 s (25 frames), number of repetitions – 5, frame-rate of the videos – 25 fps , video resolution – 1280 px × 720 px ( 38 . 2 ◦ × 22 ◦ visual angle), videos are silent. The obser v ers were invited from the Univ ersity staff and students. 30 subjects in total, 15 women and 15 men. Age: 21-42 (mean 25.6). 2 https://github .com/acecreamu/temporal-saliency Figure 3: The produced temporal saliency graphs. Thick b lack line C 1 − 5 , red line C 1 , thin blac k line C ( W ) 1 − 5 . Zoom is required. P earson Correlation Coefficient (mean std ) K olmogorov-Smirnov test (mean p -value) C 1 C 1 − 2 C 1 − 5 C ( W ) 1 − 5 C 1 C 1 − 2 C 1 − 5 C ( W ) 1 − 5 "The underwater world" 0.663 0 . 082 0.694 0 . 082 0.740 0 . 074 0.770 0 . 064 0.119 0.048 0.011 0.036 "Cinematic scene" 0.615 0 . 092 0.711 0 . 057 0.803 0 . 053 0.789 0 . 051 0.164 0.107 0.033 0.067 "Leav es in the wind" 0.694 0 . 068 0.563 0 . 099 0.545 0 . 108 0.647 0 . 092 0.081 0.073 0.044 0.057 "Basketball game" 0.741 0 . 072 0.766 0 . 070 0.863 0 . 050 0.845 0 . 051 0.164 0.099 0.055 0.063 "Diver suff ocating" 0.789 0 . 050 0.788 0 . 054 0.820 0 . 057 0.834 0 . 051 0.134 0.092 0.043 0.068 "Meeting of the two" 0.660 0 . 089 0.701 0 . 085 0.740 0 . 069 0.753 0 . 069 0.121 0.112 0.061 0.053 T able 1: Inter-obser v er consistency of the measured temporal saliency maps. C 1 − N denotes sum of N rounds used for computation. Figure 4: The compar ison of spatial saliency maps. T op row in each pair – e ye-tr acking results, bottom – our results . Zoom is required. Results and discussion The proposed interf ace allows measuring both temporal and spatial saliency at the same time, thus , we e valuate the accuracy of both these outputs. T empor al saliency results Considering that there are no ground truth temporal saliency data, we e v aluate the output of the algorithm by analyzing the produced temporal saliency "maps" and estimating inter-obser v er consistency . The examples of obtained tem- poral saliency "maps" are illustrated in Fig. 3. The demon- stration of the videos with saliency scores encoded as a color-map is av ailable online: [link] . Figure 3 demon- strates three plots f or each video which correspond to dif- f erent av eraging approaches: the sum of all clicks from all five video repeats ( C 1 − 5 ); the sum of clicks only from the first round without repeating ( C 1 ); and the weighted sum of clicks from 5 rounds ( C ( W ) 1 − 5 = P 5 n =1 C n W n , where W n = { 1 , 0 . 8 , 0 . 6 , 0 . 4 , 0 . 2 } ). All the scores are nor malized by a maxim um number of clicks the fr ame can hav e. Qualitative analysis sho ws that most of the peaks on the temporal saliency graph correspond to the semantically meaningful salient ev ents on the video . This is the main achie vement of the proposed interf ace. It can also be seen that an intentionally taken monotonic video without salient e vents ("lea ves in the wind") has relativ ely flat saliency graph without strongly pronounced peaks (which could be e ven flatter when the response statistics is larger). Apar t from that, it ma y be seen that in the case of other videos, the output of the first round (red line) is very similar to the total output of all five rounds . This means that ev en when in the ne xt rounds obser v ers star t e xploring smaller , less salient details, the y still retur n to the "main" e vents and f ollow a similar pattern of clicks as in the first round. Also , adding weights to the sum (thin b lack line) does not influ- ence the results significantly , which again indicates the similarity of clicks from all the rounds. How ev er, using N rounds indeed allows to gather N times more responses making the graph smoother and, as w e show ne xt, pro- duces more consistent responses from each obser v er. In order to estimate consistency between diff erent groups of obser v ers, we synthetically split obser v ers into two groups of 15 people each. Then, we compute temporal saliency maps f or each group independently and compare the re- sults. The comparison is done using the P earson Correla- tion Coefficient between the saliency maps from diff erent groups, as w ell as perf or ming the K olmogorov-Smirnov test between two distributions and reporting the p-value. Re- sults are av eraged between 100 random splits (standard de viation is also repor ted f or PCC). T ab le 1 shows that the correlation between responses from diff erent obser v ers is very high, up to 0.86. Increasing the number of rounds con- sidered increases the correlation of responses significantly , with maximum v alues achie ved when all fiv e rounds are included. Spatial saliency results The spatial saliency maps produced by e ye-tr acking data versus our interf ace can be compared visually in Fig. 4. (fixation points are blurred with a Gaussian of sigma equal to 1 ◦ of visual angle (33 px)). As may be seen, the results are very similar , ev en though we did not use any special A UC (mean std ) NSS (mean std ) "The underwater world" 0.617 0 . 108 0.73 0 . 78 "Cinematic scene" 0.712 0 . 119 1.59 1 . 05 "Leav es in the wind" 0.548 0 . 055 0.18 0 . 21 "Basketball game" 0.727 0 . 114 1.52 0 . 93 "Diver suff ocating" 0.794 0 . 113 2.66 1 . 41 "Meeting of the two" 0.625 0 . 060 0.95 0 . 43 T able 2: Compar ison of the measured spatial saliency maps and gaze-fixations obtained using e ye-trac ker . equipment and collected spatial data additionally to the main temporal output. Saliency maps are e valuated quantitativ ely using stan- dard saliency metrics: Area under ROC Curve (A UC) [9][1] and Normalized Scanpath Saliency (NSS) [14]. T able 2 presents statistics of the scores computed per frame. Re- sults demonstrate both good and poor perf ormance, and diff er significantly from video to video . Additionally , quality of spatial saliency can be assessed visually via the ren- dered videos with map ov erlay [link] , as w ell as the videos with both ey e-trac king (blue dots) and our results (red dots) simultaneously [link] . Conclusions In this work, we presented a nov el mouse-contingent inter- f ace designed for measuring temporal and spatial video saliency . T emporal saliency is a no vel concept which is studied incongruously less than it should in comparison to spatial saliency . T emporal video saliency allo ws identifying the impor tant fragments of a video b y assigning a saliency score to each frame. The analysis of the e xperimental study shows that the use of the proposed interf ace allows to accu- rately appro ximate the temporal saliency "map" as well as gaze-fixations of the observers at the same time. REFERENCES [1] Ali Borji, Hamed R T a v akoli, Dic ky N Sihite, and Laurent Itti. 2013. Analysis of scores, datasets , and models in visual saliency prediction. In IEEE ICCV . 921–928. [2] Y ury Gitman, Mikhail Erofee v, Dmitriy V atolin, Andrey Bolshako v, and Ale xe y F edorov. 2014. Semiautomatic Visual-Attention Modeling and Its Application to Video Compression. In IEEE ICIP . P ar is, F rance, 1105–1109. [3] F rédér ic Gosselin and Philippe G Sch yns. 2001. Bubb les: a technique to rev eal the use of information in recognition tasks. Vision research 41, 17 (2001), 2261–2271. [4] Qi Guo and Eugene Agichtein. 2010. T o wards predicting web searcher gaze position from mouse mov ements. In CHI’10 Extended Abstracts . A CM, 3601–3606. [5] Jeff Huang, Ryen White, and Georg Buscher. 2012. User see, user point: gaze and cursor alignment in web search. In SIGCHI . A CM, 1341–1350. [6] Rober t J . K. Jacob and K eith S. Karn. 2003. Eye T r acking in Human-Computer Interaction and Usability Research: Ready to Deliver the Promises. Mind 2, 3 (2003), 4. [7] Anthony R J ansen, Alan F Blackw ell, and KIM Marriott. 2003. A tool f or tracking visual attention: The restricted f ocus viewer . Behavior research methods, instruments, & computers 35, 1 (2003), 57–69. [8] Ming Jiang, Shengsheng Huang, Juan yong Duan, and Qi Zhao. 2015. Salicon: Saliency in context. In IEEE CVPR . 1072–1080. [9] Tilke J udd, Krista Ehinger, F rédo Durand, and Antonio T orr alba. 2009. Lear ning to predict where humans look. In IEEE ICCV . IEEE, 2106–2113. [10] Nam W ook Kim, Zoy a Bylinskii, Michelle A Borkin, Krzysztof Z Gajos, A ude Oliva, F redo Durand, and Hanspeter Pfister. 2017. Bubb leView: an interf ace for crowdsourcing image importance maps and tracking visual attention. A CM T OCHI 24, 5 (2017), 36. [11] Mario Kleiner, David Brainard, Denis P elli, Allen Ingling, Richard Murra y, Christopher Broussard, and others. 2007. Whatâ ˘ A ´ Zs new in Psychtoolbo x-3. (2007). [12] Stef an Mathe and Cristian Sminchisescu. 2015. Actions in the ey e: Dynamic gaze datasets and learnt saliency models f or visual recognition. IEEE TP AMI 37, 7 (2015), 1408–1424. [13] Jak ob Nielsen and Kara P er nice. 2010. Ey etrac king web usability . New Riders. [14] Rober t J P eters, Asha Iyer, Laurent Itti, and Christof K och. 2005. Components of bottom-up gaze allocation in natural images. Vision research 45, 18 (2005), 2397–2416. [15] K err y Rodden, Xin Fu, Anne A ula, and Ian Spiro. 2008. Eye-mouse Coordination P atter ns on W eb Search Results P ages. In CHI’08 Extended Abstracts (CHI EA ’08) . ACM, Ne w Y ork, NY , USA, 2997–3002. [16] E. Vig, M. Dorr, and D . Co x. 2014. Large-Scale Optimization of Hierarchical F eatures f or Saliency Prediction in Natural Images. In IEEE CVPR . 2798–2805. [17] W enguan W ang, Jianbing Shen, F ang Guo, Ming-Ming Cheng, and Ali Borji. 2018. Re visiting video saliency: A large-scale benchmark and a new model. In IEEE CVPR . 4894–4903. [18] Alfred L Y arb us. 1967. Eye movements and vision . Plenum, Ne w Y ork, NY , USA.
Original Paper
Loading high-quality paper...
Comments & Academic Discussion
Loading comments...
Leave a Comment