A novel initialisation based on hospital-resident assignment for the k-modes algorithm
This paper presents a new way of selecting an initial solution for the k-modes algorithm that allows for a notion of mathematical fairness and a leverage of the data that the common initialisations from literature do not. The method, which utilises t…
Authors: Henry Wilde, Vincent Knight, Jonathan Gillard
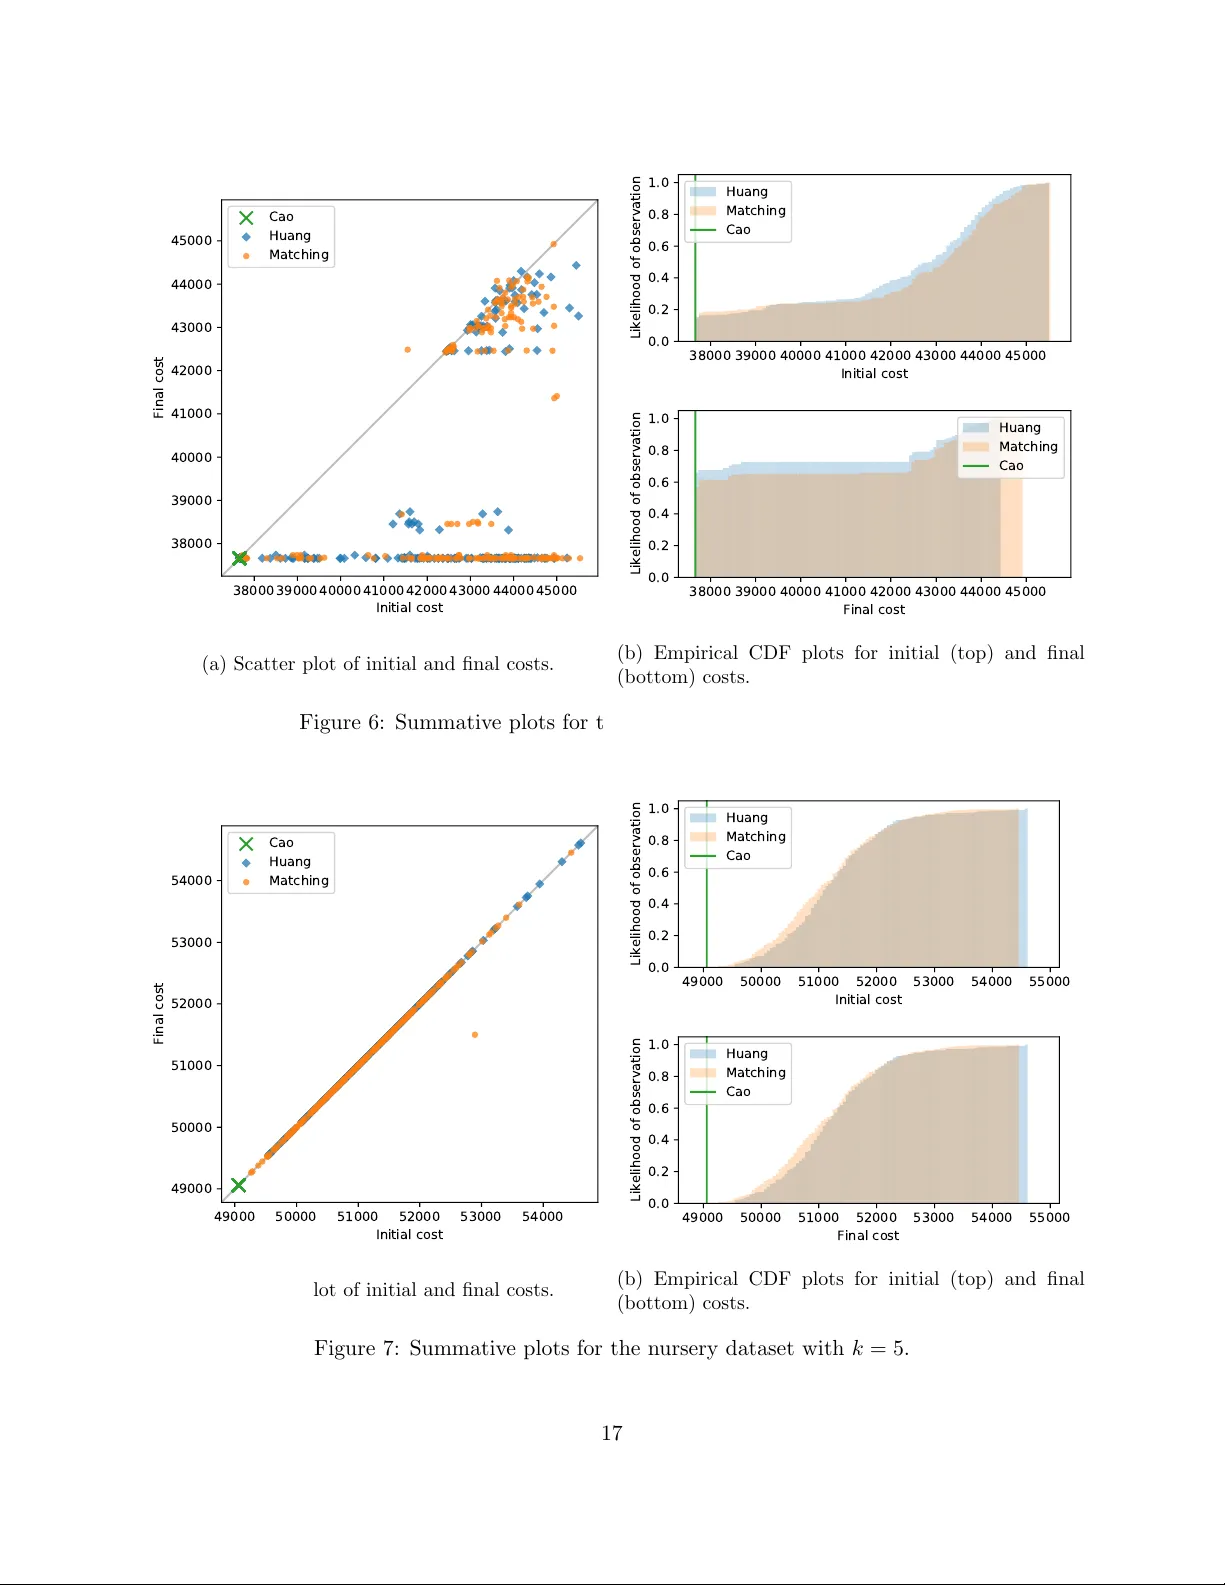
A no v el initialisation based on hospital-residen t assignmen t for the k -mo des algorithm Henry Wilde, Vincen t Knight and Jonathan Gillard F ebruary 10, 2020 Abstract This pap er presents a new w ay of selecting an initial solution for the k -mo des algorithm that allo ws for a notion of mathematical fairness and a lev erage of the data that the common initial- isations from literature do not. The metho d, which utilises the Hospital-Residen t Assignmen t Problem to find the set of initial cluster centroids, is compared with the current initialisations on b oth b enc hmark datasets and a b o dy of newly generated artificial datasets. Based on this analysis, the proposed metho d is sho wn to outp erform the other initialisations in the ma jority of cases, esp ecially when the n umber of clusters is optimised. In addition, we find that our metho d outp erforms the leading established metho d sp ecifically for low-densit y data. 1 In tro duction This w ork fo cusses on k -mo des clustering — an extension to k -means that p ermits the sensible clustering of categorical (i.e. ordinal, nominal or otherwise discrete) data as set out in the seminal w orks by Huang [9, 10, 11]. In particular, the in terest of this pap er is in ho w the p erformance of the k -mo des algorithm is affe cted by the qualit y of its initial solution. The initialisation metho d prop osed in this work extends the metho d presented by Huang [11] by using results from game theory to ensure mathematical fairness and to lev er the full learning opp ortunities presented b y the data being clustered. In doing so, it is demonstrated that the prop osed metho d is able to outp erform b oth of the established initialisations for k -mo des. The pap er is structured as follo ws: • Section 1 introduces the k -mo des algorithm and its established initialisation metho ds. • Section 2 provides a brief ov erview of matc hing games and their v arian ts b efore a statement of the prop osed initialisation. • Section 3 presents analyses of the initialisations on b enc hmark and new, artificial datasets. • Section 4 concludes the paper. 1.1 The k -mo des algorithm The following notation will be used throughout this w ork to describe the ob jects associated with clustering a categorical dataset: 1 • Let A := A 1 × · · · × A m denote the attribute sp ac e . In this work, only categorical attributes are considered, i.e. for each j = 1 , . . . , m it follo ws that A j := n a ( j ) 1 , . . . , a ( j ) d j o where d j = | A j | is the size of the j th attribute. • Let X := X (1) , . . . , X ( N ) ⊂ A denote a dataset where each X ( i ) ∈ X is defined as an m -tuple X ( i ) := x ( i ) 1 , . . . , x ( i ) m where x ( i ) j ∈ A j for each j = 1 , . . . , m . The elements of X are referred to as data p oints or instanc es . • Let Z := ( Z 1 , . . . , Z k ) b e a partition of a dataset X ⊂ A in to k ∈ Z + distinct, non-empty parts. Such a partition Z is called a clustering of X . • Eac h cluster Z l has asso ciated with it a mo de (see Definition 2) which is denoted b y z ( l ) = z ( l ) 1 , . . . , z ( l ) m ∈ A . These p oin ts are also referred to as r epr esentative p oints or c entr oids . The set of all current cluster mo des is denoted as Z = z (1) , . . . , z ( k ) . Definition 1 describ es a dissimilarit y measure b et ween categorical data p oints. Definition 1. L et X ⊂ A b e a dataset and c onsider any X ( a ) , X ( b ) ∈ X . The dissimilarity b etwe en X ( a ) and X ( b ) , denote d by d X ( a ) , X ( b ) , is given by: d X ( a ) , X ( b ) := m X j =1 δ x ( a ) j , x ( b ) j wher e δ ( x, y ) = ( 0 , if x = y 1 , otherwise. (1) With this metric, the notion of a representativ e p oin t of a cluster is addressed. With numeric data and k -means, such a p oin t is taken to b e the mean of the p oints within the cluster. With categorical data, how ev er, the mo de is used as the measure for cen tral tendency . This follo ws from the concept of dissimilarit y in that the p oint that b est represen ts (i.e. is closest to) those in a cluster is one with the most frequent attribute v alues of the p oints in the cluster. The following definitions and theorem formalise this and a method to find such a p oint. Definition 2. L et X ⊂ A b e a dataset and c onsider some p oint z = ( z 1 , . . . , z m ) ∈ A . Then z is c al le d a mo de of X if it minimises the fol lowing: D ( X , z ) = N X i =1 d X ( i ) , z (2) Definition 3. L et X ⊂ A b e a dataset. Then n a ( j ) s denotes the frequency of the s th c ate gory a ( j ) s of A j in X , i.e. for e ach A j ∈ A and e ach s = 1 , . . . , d j : n a ( j ) s := n X ( i ) ∈ X : x ( i ) j = a ( j ) s o (3) F urthermor e, n a ( j ) s N is c al le d the relative frequency of c ate gory a ( j ) s in X . Theorem 1. Consider a dataset X ⊂ A and some U = ( u 1 , . . . , u m ) ∈ A . Then D ( X , U ) is minimise d if and only if n ( u j ) ≥ n a ( j ) s for al l s = 1 , . . . , d j for e ach j = 1 , . . . , m . A pr o of of this the or em c an b e found in the App endix of [11]. 2 Theorem 1 defines the pro cess by whic h cluster mo des are up dated in k -mo des (see Algorithm 3), and so the final comp onent from the k -means paradigm to b e configured is the ob jective (cost) function. This function is defined in Definition 4, and follo wing that a practical statement of the k -mo des algorithm is giv en in Algorithm 1 as set out in [11]. Definition 4. L et Z = { Z 1 , . . . , Z k } b e a clustering of a dataset X , and let Z = z (1) , . . . , z ( k ) b e the c orr esp onding cluster mo des. Then W = ( w i,l ) is an N × k partition matrix of X such that: w i,l = ( 1 , if X ( i ) ∈ Z l 0 , otherwise. With this, the cost function is define d to b e the summe d within-cluster dissimilarity: C W , Z := k X l =1 N X i =1 m X j =1 w i,l δ x ( i ) j , z ( l ) j (4) Algorithm 1: The k -mo des algorithm Input: a dataset X , a num b er of clusters to form k Output: a clustering Z of X Select k initial modes z (1) , . . . , z ( k ) ∈ X Z ← z (1) , . . . , z ( k ) Z ← z (1) , . . . , z ( k ) for X ( i ) ∈ X do Z l ∗ ← SelectClosest X ( i ) Z l ∗ ← Z l ∗ ∪ X ( i ) Upda te z ( l ∗ ) end rep eat for X ( i ) ∈ X do Let Z l b e the cluster X ( i ) curren tly belongs to Z l ∗ ← SelectClosest X ( i ) if l 6 = l ∗ then Z l ← Z l \ X ( i ) and Z l ∗ ← Z l ∗ ∪ X ( i ) Upda te z ( l ) and Upda te z ( l ∗ ) end end un til No p oint changes cluster 1.2 Initialisation pro cesses The standard selection method to initialise k -mo des is to randomly sample k distinct p oints in the dataset. In all cases, the initial modes m ust be points in the dataset to ensure that there are no empt y clusters in the first iteration of the algorithm. The remainder of this section describ es tw o w ell-established initialisation methods that aim to preemptively lever the structure of the data at hand. 3 Algorithm 2: SelectClosest Input: a data p oint X ( i ) , a set of current clusters Z and their mo des Z Output: the cluster whose mo de is closest to the data p oint Z l ∗ Select z l ∗ ∈ Z that minimises: d X ( i ) , z l ∗ Find their asso ciated cluster Z l ∗ Algorithm 3: Upd a te Input: an attribute space A , a mo de to update z ( l ) and its cluster Z l Output: an up dated mo de Find z ∈ A that minimises D ( Z l , z ) z ( l ) ← z 1.2.1 Huang’s method Amongst the original w orks b y Huang, an alternativ e initialisation metho d was presented that selects mo des by distributing frequently o ccurring v alues from the attribute space among k potential mo des [11]. The pro cess, denoted as Huang’s metho d, is describ ed in full in Algorithm 4. Huang’s metho d considers a set of p otential mo des, b Z ⊂ A , that is then replaced by the actual set of initial mo des, Z ⊂ X . The statement of ho w the set of potential mo des are formed is ambiguous in the original pap er — as is alluded to in [13]. Here, as is done in practical implementations of k -mo des, this has b een in terpreted as being done via a w eighted random sample (see Algorithm 5). Algorithm 4: Huang’s metho d Input: a dataset X ⊂ A , a num b er of mo des to find k Output: a set of k initial modes Z Z ← ∅ b Z ← SamplePotentialModes ( X ) for ˆ z ∈ b Z do Select X ( i ∗ ) ∈ X \ Z that minimises d X ( i ) , ˆ z Z ← Z ∪ X ( i ∗ ) end 1.2.2 Cao’s method The second initialisation pro cess that is widely used with k -mo des is known as Cao’s metho d [3]. This metho d selects the initial mo des according to their densit y in the dataset whilst forcing dissimilarit y b et ween them. Definition 5 formalises the concept of density and its relationship to relativ e frequency . The method, whic h is describ ed in Algorithm 6, is deterministic — unlike Huang’s metho d which relies on random sampling. Definition 5. Consider a dataset X ⊂ A = { A 1 , . . . , A m } . Then the av erage density of any p oint 4 Algorithm 5: SamplePotentialModes Input: a dataset X ⊂ A , a num b er of mo des to find k Output: a set of k potential modes b Z b Z ← ∅ for j = 1 , . . . , m do for s = 1 , . . . , d j do Calculate n a ( j ) s N end end while b Z < k do Create an empty m -tuple ˆ z ( l ) for j = 1 , . . . , m do Sample a ( j ) s ∗ from A j with resp ect to the relativ e frequencies of A j ˆ z ( l ) j ← a ( j ) s ∗ end b Z ← b Z ∪ ˆ z ( l ) end X i ∈ X with r esp e ct to A is define d [3] as: Dens X ( i ) = P m j =1 Dens j X ( i ) m wher e Dens j X ( i ) = n X ( t ) ∈ X : x ( i ) j = x ( t ) j o N (5) Observe that: n X ( t ) ∈ X : x ( i ) j = x ( t ) j o = n x ( i ) j = N X t =1 1 − δ x ( i ) j , x ( t ) j A nd so, an alternative definition for (5) c an b e derive d: Dens X ( i ) = 1 mN m X j =1 N X t =1 1 − δ x ( i ) j , x ( t ) j = 1 − 1 mN D X , X ( i ) (6) 2 Matc hing games and the prop osed metho d Both of the initialisation metho ds describ ed in Section 1.2 ha ve a gree dy component. Cao’s metho d essen tially chooses the densest p oint that has not already b een chosen whilst forcing separation b et ween the set of initial mo des. In the case of Huang’s, ho wev er, the greediness only comes at the end of the metho d, when the set of p otential modes is replaced by a set of instances in the dataset. Sp ecifically , this means that in an y practical implementation of this metho d the order in whic h a set of p otential mo des is iterated o ver can affect the set of initial mo des. Thus, there is no guaran tee of consistency . 5 Algorithm 6: Cao’s metho d Input: a dataset X , a num b er of mo des to find k Output: a set of k initial modes Z Z ← ∅ for X ( i ) ∈ X do Calculate Dens X ( i ) end Select 1 ≤ i 1 ≤ N whic h maximises Dens X ( i ) Z ← Z ∪ X ( i 1 ) while Z < k do Select X ( i ∗ ) / ∈ Z whic h maximises min z ( l ) ∈ Z Dens X ( i ) × d X i , z ( l ) Z ← Z ∪ X ( i ∗ ) end The initialisation prop osed in this work extends Huang’s metho d to b e order-in v ariant in the final allo cation — thereb y eliminating its greedy component — and provides a more in tuitive starting p oint for the k -mo des algorithm. This is done by constructing and solving a matching game b etw een the set of potential mo des and some subset of the data. In general, matching games are defined by t w o sets (parties) of play ers in which eac h pla yer creates a preference list of at least some of the play ers in the other party . The ob jective then is to find a ‘stable’ mapping b etw een the tw o sets of pla yers such that no pair of pla yers is (rationally) unhapp y with their matching. Algorithms to ‘solv e’ — i.e. find stable matchings to — instances of matc hing games are often structured to b e party-orien ted and aim to maximise some form of so cial or party-based optimalit y [6, 7, 8, 12, 15, 16]. The particular constrain ts of this case — where the k p otential mo des must be allo cated to a nearb y unique data p oint — mirror those of the so-called Hospital-Resident Assignmen t Problem (HR). This problem gets its name from the real-world problem of fairly allo cating medical students to hospital p osts. A resident-optimal algorithm for solving HR w as presen ted in [8] and was adapted in [20] to tak e adv antage of the structure of the game. This adapted algorithm is giv en in Algorithm 7. A practical implemen tation of this algorithm has b een implemented in Python as part of the matching library [24] and is used in the implemen tation of the proposed metho d for Section 3. The game used to mo del HR, its matc hings, and its notion of stabilit y are defined in Defini- tions 6 — 8. A summary of these definitions in the context of the prop osed k -mo des initialisation is giv en in T able 1 before a formal statement of the prop osed method in Algorithm 11. Definition 6. Consider two distinct sets R , H and r efer to them r esidents and hospitals. Each h ∈ H has a c ap acity c h ∈ N asso ciate d with them. Each player r ∈ R and h ∈ H has asso ciate d with it a strict pr efer enc e list of the other set’s elements such that: • Each r ∈ R r anks a non-empty subset of H , denote d by f ( r ) . • Each h ∈ H r anks al l and only those r esidents that have r anke d it, i.e. the pr efer enc e list of h , denote d g ( h ) , is a p ermutation of the set { r ∈ R | h ∈ f ( r ) } . If no such r esidents exist, h is r emove d fr om H . 6 This c onstruction of r esidents, hospitals, c ap acities and pr efer enc e lists is c al le d a game and is denote d by ( R , H ) . Definition 7. Consider a game ( R , H ) . A matc hing M is any mapping b etwe en R and H . If a p air ( r , h ) ∈ R × H ar e matche d in M then this r elationship is denote d M ( r ) = h and r ∈ M − 1 ( h ) . A matching is only c onsider e d v alid if al l of the fol lowing hold for al l r ∈ R , h ∈ H : • If r is matche d then M ( r ) ∈ f ( r ) . • If h has at le ast one match then M − 1 ( h ) ⊆ g ( h ) . • h is not over-subscrib e d, i.e. M − 1 ( h ) ≤ c h . A valid matching is c onsider e d stable if it do es not c ontain any blo cking p airs. Definition 8. Consider a game ( R , H ) . Then a p air ( r , h ) ∈ R × H is said to blo ck a matching M if al l of the fol lowing hold: • Ther e is mutual pr efer enc e, i.e. r ∈ g ( h ) and h ∈ f ( r ) . • Either r is unmatche d or they pr efer h to M ( r ) . • Either h is under-subscrib e d or h pr efers r to at le ast one r esident in M − 1 ( h ) . Ob ject in k -mo des initialisation Ob ject in a matching game P otential mo des The set of residents Data p oints closest to p oten tial modes The set of hospitals Similarit y b et ween a p otential mo de and a p oint Resp ectiv e position in each other’s preference lists The data p oin t to replace a p otential mode A pair in a matc hing T able 1: A summary of the relationships b et ween the comp onents of the initialisation for k -mo des and those in a matching game ( R, H ). 3 Exp erimen tal results T o giv e comparativ e results on the qualit y of the initialisation pro cesses considered in this w ork, four well-kno wn, categorical, lab elled datasets — breast cancer, m ushro om, n ursery , and so yb ean (large) — will b e clustered b y the k -mo des algorithm with eac h of the initialisation processes. These datasets hav e been c hosen to fall in line with the established literature, and for their relative sizes and complexities. Each dataset is op enly a v ailable under the UCI Mac hine Learning Repository [5], and their characteristics are summarised in T able 2. F or the purp oses of this analysis, incomplete instances (i.e. where data is missing) are excluded and the remaining dataset characteristics are rep orted as ‘adjusted’. All of the source co de used to produce the results and data in this analysis — including the datasets inv estigated in Section 3.3 — are arc hiv ed at DOI 10.5281/zenodo.3639282. In addition to this, the implemen tation of the k -mo des algorithm and its initialisations is av ailable under DOI 10.5281/zeno do.3638035. 7 Algorithm 7: The hospital-resident algorithm (residen t-optimal) Input: a set of residents R , a set of hospitals H , a set of hospital capacities C , tw o preference list functions f , g Output: a stable, resident-optimal mapping M b etw een R and H for h ∈ H do M − 1 ( h ) ← ∅ end while Ther e exists any unmatche d r ∈ R with a non-empty pr efer enc e list do T ake any suc h residen t r and their most preferred hospital h Ma tchP air ( s, h ) if M − 1 ( h ) > c h then Find their worst matc h r 0 ∈ M − 1 ( h ) Unma tchP air ( r 0 , h ) end if M − 1 ( h ) = c h then Find their worst matc h r 0 ∈ M − 1 ( h ) for e ach suc c essor s ∈ g ( h ) to r 0 do DeleteP air ( s, h ) end end end Algorithm 8: Ma tchP air Input: a residen t r , a hospital h , a matc hing M Output: an up dated matching M M − 1 ( h ) ← M − 1 ( h ) ∪ { r } Algorithm 9: Unma tchP air Input: a residen t r , a hospital h , a matc hing M Output: an up dated matching M M − 1 ( h ) ← M − 1 ( h ) \ { r } Algorithm 10: DeleteP air Input: a residen t r , a hospital h Output: up dated preference lists f ( r ) ← f ( r ) \ { h } g ( h ) ← g ( h ) \ { r } 8 Algorithm 11: The prop osed initialisation method Input: a dataset X ⊂ A , a num b er of mo des to find k Output: a set of k initial modes Z Z ← ∅ H ← ∅ R ← SamplePotentialModes ( X ) for r ∈ R do Find the set of k data points H r ⊂ X that are the least dissimilar to r Arrange H r in to descending order of similarity with resp ect to r , denoted by H ∗ r H ← H ∪ H r f ( r ) ← H ∗ r end for h ∈ H do c h ← 1 Sort R in to descending order of similarity with resp ect to h , denoted by R ∗ g ( h ) ← R ∗ end Solv e the matc hing game defined by ( R, H ) to obtain a matching M for r ∈ R do Z ← Z ∪ { M ( r ) } end N m No. classes Missing v alues Adjusted N Adjusted no. classes No. clusters found Breast cancer 699 10 2 T rue 683 2 8 Mushro om 8124 22 2 T rue 5644 2 17 Nursery 12960 8 5 F alse 12960 5 23 So yb ean 307 35 19 T rue 266 15 8 T able 2: A summary of the b enchmark datasets. 9 This analysis do es not consider ev aluative metrics related to classification such as accuracy , recall or precision as is commonly done [1, 3, 4, 11, 18, 19, 22, 23]. Instead, only internal measures are considered such as the cost function defined in (4). This metric is lab el-inv ariant and its v alues are comparable across the different initialisation metho ds. F urthermore, the effect of eac h initialisation metho d on the initial and final clusterings can b e captured with the cost function. An additional, and often useful, metric is the silhouette co efficien t. This measures the ratio b etw een the in tra-cluster cohesion and in ter-cluster separation of a particular clustering. Therefore, it could b e used in a similar wa y to reveal the effect of eac h initialisation metho d at the b eginning and end of a run of k -mo des. Unfortunately , this metric loses its intuition under the distance measure employ ed here and is omitted. The remaining p erformance measures used are the n um b er of iterations for the k -mo des algorithm to terminate and the time taken to terminate in seconds. The final piece of information required in this analysis is a c hoice for k for eac h dataset. An immediate c hoice is the n umber of classes that are presen t in a dataset but this is not necessarily an appropriate c hoice since the classes may not b e representativ e of true clusters [17]. How ever, this analysis will consider this case as there ma y b e practical reasons to limit the v alue of k . The other strategy for choosing k considered in this work uses the knee point detection algorithm introduced in [21]. This strategy was chosen o ver other p opular metho ds such as the ‘elbow’ method as its results are definitive. The knee p oint detection algorithm w as employ ed ov er v alues of k from 2 up to b √ N c for each dataset. The num b er of clusters determined by this strategy is rep orted in the final column of T able 2. 3.1 Using knee p oin t detection algorithm for k T ables 3 — 6 summarise the results of each initialisation metho d on the b enchmark datasets where the n umber of clusters has been determined by the knee p oin t detection algorithm. Eac h column sho ws the mean v alue of each metric and its standard 250 rep etitions of the k -mo des algorithm. By examining these tables it w ould seem that the prop osed metho d and Huang’s method are comparable across the b oard — although the proposed metho d is faster despite taking more iter- ations in general whic h may relate to a more intuitiv e initialisation. More imp ortantly though, it app ears that Cao’s metho d p erforms the best out of the three initialisation metho ds: in terms of initial and final costs Cao’s metho d impro ves, on av erage, by roughly 10 p ercen t against the next b est metho d for the three datasets that it succeeds with; the n umber of iterations is comparable; and the computation time is substantially less than the other tw o considering it is a deterministic metho d and need only b e run once to achiev e this p erformance. Ho wev er, in the k -means paradigm, a particular clustering is selected based on it having the minim um final cost ov er a num b er of runs of the algorithm — not the mean — and while Cao’s metho d is very reliable, in that there is no v ariation at all, it do es not alwa ys pro duce the b est clustering p ossible. There is a trade-off to b e made b etw een computational time and p erformance here. In order to gain more insight into the p erformance of each metho d, less gran ular analysis is required. Figures 1 — 4 displa y the cost function results for eac h dataset in the form of a scatter plot and tw o empirical cumulativ e densit y function (CDF) plots, highligh ting the breadth and depth of the b ehaviours exhibited b y each initialisation metho d. Lo oking at Figure 1 it is clear that in terms of final cost Cao’s metho d is middling when compared to the other metho ds. This was apparent from T able 3 and, indeed, Huang’s and the prop osed method are b oth v ery comparable when lo oking at the main bo dy of the results. Ho wev er, 10 Initial cost Final cost No. iterations Time Cao 3118.00 (0.000) 2774.00 (0.000) 4.00 (0.000) 0.30 (0.012) Huang 2856.50 (104.245) 2748.83 (64.514) 2.68 (0.817) 0.22 (0.046) Matc hing 2870.11 (101.869) 2752.59 (52.387) 2.72 (0.760) 0.16 (0.021) T able 3: Summative metric results for the breast cancer dataset with k = 8. Initial cost Final cost No. iterations Time Cao 20381.00 (0.000) 20376.00 (0.000) 2.00 (0.000) 4.68 (0.205) Huang 23027.24 (1209.753) 21869.06 (747.766) 2.90 (0.934) 5.11 (1.138) Matc hing 23279.36 (1498.324) 21855.50 (751.641) 3.02 (0.936) 2.77 (0.325) T able 4: Summative metric results for the m ushro om dataset with k = 17. Initial cost Final cost No. iterations Time Cao 35544.00 (0.000) 35544.00 (0.000) 1.00 (0.000) 4.98 (0.152) Huang 37535.06 (372.596) 37535.06 (372.596) 1.00 (0.000) 3.58 (0.121) Matc hing 37484.29 (327.467) 37484.29 (327.467) 1.00 (0.000) 3.14 (0.141) T able 5: Summative metric results for the n ursery dataset with k = 23. Initial cost Final cost No. iterations Time Cao 1654.00 (0.000) 1585.00 (0.000) 4.00 (0.000) 0.28 (0.014) Huang 1829.31 (92.308) 1708.55 (69.740) 3.58 (1.019) 0.28 (0.063) Matc hing 1827.76 (86.852) 1711.49 (73.319) 3.42 (0.963) 0.17 (0.022) T able 6: Summative metric results for the so yb ean dataset with k = 8. 11 2600 2700 2800 2900 3000 3100 3200 Initial cost 2600 2700 2800 2900 3000 3100 3200 Final cost Cao Huang Matching (a) Scatter plot of initial and final costs. 2600 2700 2800 2900 3000 3100 3200 Initial cost 0.0 0.2 0.4 0.6 0.8 1.0 Likelihood of observation Huang Matching Cao 2600 2700 2800 2900 3000 3100 3200 Final cost 0.0 0.2 0.4 0.6 0.8 1.0 Likelihood of observation Huang Matching Cao (b) Empirical CDF plots for initial (top) and final (b ottom) costs. Figure 1: Summativ e plots for the breast cancer dataset with k = 8. since the criterion for the b est clustering (in practical terms) is having the minimum final cost, it is eviden t that the prop osed method is superior; that the metho d pro duces clusterings with a larger cost range (indicated by the trailing righ t-hand side of each CDF plot) is irrelev ant for the same reason. This pattern of largely similar b eha viour betw een Huang’s and the prop osed metho d is apparent in each of the figures here, and in eac h case the prop osed metho d outp erforms Huang’s. In fact, in all cases except for the nursery dataset, the proposed method achiev es the lo w est final cost of all the metho ds and, as suc h, performs the b est in practical terms on these particular datasets. In the case of the n ursery dataset, Cao’s metho d is unquestionably the b est p erforming initial- isation metho d. It should b e noted that none of the metho ds w ere able to find an initial clustering that could b e impro ved on, and that this dataset exactly describ es the entire attribute space in whic h it exists. This prop ert y could b e why the other metho ds fall behind Cao’s so decisiv ely in that Cao’s metho d is able to definitiv ely c ho ose the k most dense-whilst-separated points from the attribute space as the initial cluster centres whereas th e other tw o metho ds are in essence randomly sampling from this space. That each initial solution in these rep etitions is lo cally optimal remains a mystery . 3.2 Using num b er of classes for k As is discussed ab ov e, the often automatic c hoice for k is the num b er of classes presen t in the data; this subsection rep eats the analysis from the subsection abov e but with this traditional choice for k . T ables 7 — 10 contain the analogous summaries of each initialisation method’s performance on the b enchmark datasets o ver the same num b er of rep etitions. 12 20000 22000 24000 26000 28000 30000 Initial cost 20000 22000 24000 26000 28000 30000 Final cost Cao Huang Matching (a) Scatter plot of initial and final costs. 20000 22000 24000 26000 28000 30000 Initial cost 0.0 0.2 0.4 0.6 0.8 1.0 Likelihood of observation Huang Matching Cao 20000 22000 24000 26000 28000 30000 Final cost 0.0 0.2 0.4 0.6 0.8 1.0 Likelihood of observation Huang Matching Cao (b) Empirical CDF plots for initial (top) and final (b ottom) costs. Figure 2: Summativ e plots for the m ushro om dataset with k = 17. 35500 36000 36500 37000 37500 38000 38500 Initial cost 35500 36000 36500 37000 37500 38000 38500 Final cost Cao Huang Matching (a) Scatter plot of initial and final costs. 35500 36000 36500 37000 37500 38000 38500 39000 Initial cost 0.0 0.2 0.4 0.6 0.8 1.0 Likelihood of observation Huang Matching Cao 35500 36000 36500 37000 37500 38000 38500 39000 Final cost 0.0 0.2 0.4 0.6 0.8 1.0 Likelihood of observation Huang Matching Cao (b) Empirical CDF plots for initial (top) and final (b ottom) costs. Figure 3: Summativ e plots for the n ursery dataset with k = 23. 13 Initial cost Final cost No. iterations Time Cao 3315.00 (0.000) 3172.00 (0.000) 2.00 (0.000) 0.13 (0.005) Huang 3393.80 (120.772) 3348.51 (144.849) 1.54 (0.653) 0.10 (0.024) Matc hing 3406.73 (111.686) 3355.56 (144.621) 1.61 (0.638) 0.09 (0.018) T able 7: Summative metric results for the breast cancer dataset with k = 2. Initial cost Final cost No. iterations Time Cao 37662.00 (0.000) 37662.00 (0.000) 1.00 (0.000) 0.94 (0.035) Huang 41974.07 (2393.889) 39226.25 (2483.933) 3.11 (1.430) 1.92 (0.679) Matc hing 42175.54 (2520.163) 39617.53 (2637.574) 3.03 (1.439) 1.38 (0.491) T able 8: Summative metric results for the m ushro om dataset with k = 2. Initial cost Final cost No. iterations Time Cao 49060.00 (0.000) 49060.00 (0.000) 1.00 (0.000) 1.80 (0.090) Huang 51229.45 (902.503) 51229.45 (902.503) 1.00 (0.000) 1.72 (0.116) Matc hing 51107.52 (910.258) 51101.95 (903.525) 1.00 (0.063) 1.37 (0.128) T able 9: Summative metric results for the n ursery dataset with k = 5. Initial cost Final cost No. iterations Time Cao 1364.00 (0.000) 1314.00 (0.000) 2.00 (0.000) 0.33 (0.009) Huang 1588.89 (83.682) 1446.22 (59.844) 4.02 (1.081) 0.45 (0.085) Matc hing 1582.56 (87.418) 1447.08 (60.154) 4.01 (1.128) 0.24 (0.025) T able 10: Summative metric results for the so yb ean dataset with k = 15. 14 1600 1700 1800 1900 2000 2100 2200 Initial cost 1600 1700 1800 1900 2000 2100 2200 Final cost Cao Huang Matching (a) Scatter plot of initial and final costs. 1600 1700 1800 1900 2000 2100 2200 Initial cost 0.0 0.2 0.4 0.6 0.8 1.0 Likelihood of observation Huang Matching Cao 1600 1700 1800 1900 2000 2100 2200 Final cost 0.0 0.2 0.4 0.6 0.8 1.0 Likelihood of observation Huang Matching Cao (b) Empirical CDF plots for initial (top) and final (b ottom) costs. Figure 4: Summativ e plots for the so yb ean dataset with k = 8. An immediate comparison to the previous tables is that for all datasets bar the soybean dataset, the mean costs are significantly higher and the computation times are lo w er. These effects come directly from the c hoice of k in that higher v alues of k will require more chec ks (and thus compu- tational time) but will t ypically lead to more homogeneous clusters, reducing their within-cluster dissimilarit y and therefore cost. Lo oking at these tables on their own, Cao’s metho d is the sup erior initialisation metho d on a verage: the means are substantially low er in terms of initial and final cost; there is no deviation in these results; again, the total computational time is a fraction of the other tw o metho ds. It is also apparen t that Huang’s metho d and the prop osed extension are v ery comparable on av erage. As b efore, finer in v estigation will require finer visualisations. Figures 5 — 8 sho w the same plots as in the previous subsection except the n umber of clusters has been taken to b e the n umber of classes presen t in eac h dataset. Figures 5 & 6 indicate that a particular b ehaviour emerged during the runs of the k -mo des algorithm. Sp ecifically , eac h solution falls in to one of (predominantly) t wo types: effectiv ely no impro vemen t on the initial clustering, or terminating at some clustering with a cost that is b ounded b elo w across all such solutions. Inv ariably , Cao’s metho d achiev es or approaches this low er b ound and unless Cao’s metho d is used, these particular choices for k mean that the p erformance of the k -mo des algorithm is exceptionally sensitive to its initial clustering. Moreo ver, the other t w o metho ds are effectiv ely indistinguishable in these cases and so if a robust solution is required, Cao’s metho d is the only viable option. Figure 7 corresp onds to the nursery dataset results with k = 5. In this set of runs, the same pattern emerges as in Figure 3 where sampling the initial centres from amongst the most dense p oin ts (via Huang’s metho d and the prop osed) is an inferior strategy to one considering the entire 15 3200 3300 3400 3500 3600 Initial cost 3200 3300 3400 3500 3600 Final cost Cao Huang Matching (a) Scatter plot of initial and final costs. 3200 3300 3400 3500 3600 Initial cost 0.0 0.2 0.4 0.6 0.8 1.0 Likelihood of observation Huang Matching Cao 3200 3300 3400 3500 3600 Final cost 0.0 0.2 0.4 0.6 0.8 1.0 Likelihood of observation Huang Matching Cao (b) Empirical CDF plots for initial (top) and final (b ottom) costs. Figure 5: Summativ e plots for the breast cancer dataset with k = 2. attribute space suc h as with Cao’s metho d. Again, no metho d is able to improv e on the initial solution except for one rep etition with the matc hing initialisation metho d. The primary conclusion from this analysis is th at while Huang’s metho d is largely comparable to the proposed extension, there is no substantial evidence from these use cases to use Huang’s method o ver the one prop osed in this w ork. In fact, Figure 8 is the only instance where Huang’s metho d w as able to outp erform the prop osed metho d. Other than this, the proposed metho d consisten tly p erforming better (or as well as) Huang’s method in terms of minimal final costs and computational time o ver a num b er of runs in b oth the cases where an external framew ork is imp osed on the data (b y c ho osing k to be the n umber of classes) and not. F urthermore, though not discussed in this w ork, the matching initialisation metho d has the scope to allo w for exp ert or prior knowledge to b e included in an initial clustering b y using some ad ho c preference list mec hanism. 3.3 Artificial datasets F ollowing on from the conclusions of the analysis thus far, the comp etition b etw een Cao’s method and the prop osed matching metho d may b e studied more deeply . All of the results leading up to this point w ere conducted using benchmark datasets and while there are certainly b enefits to comparing metho ds in this wa y , it do es not afford a rich understanding of ho w any of them perform more generally . This stage of the analysis relies on a metho d for generating artificial datasets in tro duced in [25]. In essence, this metho d is an ev olutionary algorithm which acts on entire datasets to explore the space in which p otentially all possible datasets exist. The k ey comp onent of this metho d is an ob jectiv e function that tak es a dataset and returns a v alue that is to b e minimised; this function is referred to as the fitness function. 16 38000 39000 40000 41000 42000 43000 44000 45000 Initial cost 38000 39000 40000 41000 42000 43000 44000 45000 Final cost Cao Huang Matching (a) Scatter plot of initial and final costs. 38000 39000 40000 41000 42000 43000 44000 45000 Initial cost 0.0 0.2 0.4 0.6 0.8 1.0 Likelihood of observation Huang Matching Cao 38000 39000 40000 41000 42000 43000 44000 45000 Final cost 0.0 0.2 0.4 0.6 0.8 1.0 Likelihood of observation Huang Matching Cao (b) Empirical CDF plots for initial (top) and final (b ottom) costs. Figure 6: Summativ e plots for the m ushro om dataset with k = 2. 49000 50000 51000 52000 53000 54000 Initial cost 49000 50000 51000 52000 53000 54000 Final cost Cao Huang Matching (a) Scatter plot of initial and final costs. 49000 50000 51000 52000 53000 54000 55000 Initial cost 0.0 0.2 0.4 0.6 0.8 1.0 Likelihood of observation Huang Matching Cao 49000 50000 51000 52000 53000 54000 55000 Final cost 0.0 0.2 0.4 0.6 0.8 1.0 Likelihood of observation Huang Matching Cao (b) Empirical CDF plots for initial (top) and final (b ottom) costs. Figure 7: Summativ e plots for the n ursery dataset with k = 5. 17 1300 1400 1500 1600 1700 1800 Initial cost 1300 1400 1500 1600 1700 1800 Final cost Cao Huang Matching (a) Scatter plot of initial and final costs. 1300 1400 1500 1600 1700 1800 Initial cost 0.0 0.2 0.4 0.6 0.8 1.0 Likelihood of observation Huang Matching Cao 1300 1400 1500 1600 1700 1800 Final cost 0.0 0.2 0.4 0.6 0.8 1.0 Likelihood of observation Huang Matching Cao (b) Empirical CDF plots for initial (top) and final (b ottom) costs. Figure 8: Summativ e plots for the so yb ean dataset with k = 15. In order to reveal the n uances in the p erformance of Cao’s metho d and the prop osed initialisation on a particular dataset, tw o cases are considered: where Cao’s metho d outp erforms the prop osed, and vice versa. Both cases use the same fitness function — with the latter using its negative — whic h is defined as follows: f ( X ) = C cao − C match (7) where C cao and C match are the final costs when a dataset X is clustered using Cao’s metho d and the prop osed matc hing method respectively with k = 3. F or the sak e of computational time, the prop osed initialisation w as given 25 rep etitions as opp osed to the 250 rep etitions in the remainder of this section. Apart from the sign of f , the dataset generation pro cesses used iden tical parameters in each case and the datasets considered here are all of comparable shape. This pro cess yielded approximately 35,000 unique datasets for eac h case, and the ensuing anal- ysis only considers the top-performing percentile of datasets from each. Figure 9 sho ws the fitness distribution of the top p ercentile in eac h case. It should b e clear from (7) that large negative v alues are preferable here. With that, and b earing in mind that the generation of these datasets was parameterised in a consisten t manner, it app ears that the attempt to outp erform Cao’s metho d pro ved somewhat easier. This is indicated by the substantial difference in the lo cations of the fitness distributions. Giv en the quantit y of data a v ailable, to understand the patterns that ha ve emerged, they m ust b e summarised; in this case, univ ariate statistics are used. Despite the datasets all b eing of similar shap es, there are some discrepancies. With the num b er of rows this is less of an issue but any comparison of statistics across datasets of differen t widths is difficult without prior kno wledge of the datasets. Moreo ver, there is no guarantee of contingency amongst the attributes, and the 18 3000 2500 2000 1500 1000 500 Fitness 0 20 40 60 80 100 120 Frequency C c a o C m a t c h C m a t c h C c a o Figure 9: Histograms of fitness for the top p erforming p ercen tile in eac h case. comparison of more than a handful of v ariables b ecomes complicated even when the attributes are iden tifiable. T o combat this and bring uniformity to the datasets, eac h dataset is represented as their first principal comp onen t obtained via centred Principal Comp onen t Analysis (PCA) [14]. While some subtleties may b e lost, this represen tation captures the most important characteristics of each dataset in a single v ariable meaning they can b e compared directly . Since the transformation by PCA is centred, all measures for central tendency are mo ot. In fact, the mean and median are not interpretable here given that the original data is categorical. As suc h, the univ ariate statistics used here describ e the spread and shap e of the principal comp onents, and are split in to tw o groups: • Cen tral moments: v ariance, sk ewness and kurtosis. • Empirical quan tiles: interquartile range, lo wer decile and upp er decile. Figures 10 & 11 show the distributions of the six univ ariate statistics across all of the principal comp onen ts in each case. In addition to this, they show a fitted Gaussian k ernel densit y estimate [2] to accentuate the general shap e of the histograms. What becomes immediately clear from each of these plots is that for datasets where Cao’s metho d succeeds, the general spread of their first principal comp onent is m uch tigh ter than in the case where the prop osed initialisation metho d succeeds. This is particularly evident in Figure 10a where relatively lo w v ariance in the first case indicates a higher lev el of densit y in the original categorical data. The patterns in the quantiles further this. Although Figure 11a suggests that the components of Cao-preferable datasets can hav e higher in terquartile ranges than in the second case, the lo wer and upper deciles tend to be closer together as is seen in Figures 11b & 11c. This suggests that despite the b o dy of the comp onent being spread, its extremities are not. In Figures 10b & 10c, the most notable con trast b etw een the t w o cases is the range in v alues for b oth sk ewness and kurtosis. This supports the evidence thus far that individual datasets hav e higher densities and lo wer v ariet y (i.e. tighter extremities) when Cao’s method succeeds o ver the 19 prop osed initialisation. In particular, larger v alues of sk ewness and kurtosis translate to high similarit y b etw een the instances in a categorical dataset whic h is equiv alent to having high density . Ov erall, this analysis has rev ealed that if a dataset sho ws clear evidence of high-densit y points, then Cao’s metho d should b e used o ver the prop osed method. How ever, if there is no such evidence, the prop osed metho d is able to find a substantially b etter clustering than Cao’s method. 4 Conclusion In this paper a no vel initialisation metho d for the k -mo des w as in tro duced that built on the metho d set out in the seminal pap er [11]. The new metho d models the final ‘replacemen t’ pro cess in the original as an instance of the Hospital-Resident Assignment Problem that may b e solved to b e mathematically fair and stable. F ollowing a thorough description of the k -mo des algorithm and the established initialisation metho ds, a comparativ e analysis was conducted amongst the three initialisations using b oth bench- mark and artificial datasets. This analysis revealed that the prop osed initialisation was able to outp erform b oth of the other methods when the choice of k w as optimised according to a mathe- matically rigorous elbow method. How ever, the proposed metho d was unable to beat Cao’s metho d (established in [3]) when an external framew ork was imp osed on eac h dataset by c ho osing k to b e the num b er of classes present. The proposed metho d should be emplo yed ov er Cao’s when there are no hard restrictions on what k ma y b e, or if there is no immediate evidence that the dataset at hand has some notion of high densit y . Otherwise, Cao’s metho d remains the most reliable initialisation in terms of computational time and final cost. References [1] D. Arthur and S. V assilvitskii. k -means++: The adv antages of careful seeding. In Pr o c e e dings of the Eighte enth Annual A CM-SIAM Symp osium on Discr ete Algorithms , SODA ’07, pages 1027–1035, 2007. ISBN 978-0-898716-24-5. URL http://dl.acm.org/citation.cfm?id= 1283383.1283494 . [2] D. M. Bashtann yk and R. J. Hyndman. Bandwidth selection for kernel conditional density estimation. Computational Statistics and Data Analysis , 36:279–298, 2001. ISSN 0167-9473. [3] F. Cao, J. Liang, and L. Bai. A new initialization metho d for categorical data clustering. Exp ert Systems with Applic ations , 36:10223–10228, 2009. URL https://pdfs.semanticscholar. org/1955/c6801bca5e95a44e70ce14180f00fd3e55b8.pdf . [4] F. Cao, J. Liang, D. Li, L. Bai, and C. Dang. A dissimilarity measure for the k -mo des clustering algorithm. Know le dge-Base d Systems , 26:120–127, 2012. doi: 10.1016/j.knosys.2011.07.011. [5] D. Dua and C. Graff. UCI Machine Learning Rep ository, 2017. URL http://archive.ics. uci.edu/ml . [6] A. Erdil and H. Ergin. Two-sided matching with indifferences. Journal of Ec onomic The ory , 171:268–292, 2017. doi: 10.1016/j.jet.2017.07.002. 20 20 40 60 80 100 120 Variance 0.00 0.01 0.02 0.03 0.04 Density C c a o C m a t c h C m a t c h C c a o (a) 1.0 1.2 1.4 1.6 1.8 Skewness 0 2 4 6 8 Density C c a o C m a t c h C m a t c h C c a o (b) 0.5 0.0 0.5 1.0 1.5 Kurtosis 0.0 0.5 1.0 1.5 2.0 2.5 3.0 Density C c a o C m a t c h C m a t c h C c a o (c) Figure 10: Distribution plots for the (a) v ariance, (b) sk ewness and (c) kurtosis of the first principal comp onen ts in eac h case. 21 2 4 6 8 10 12 Interquartile range 0.00 0.05 0.10 0.15 0.20 0.25 Density C c a o C m a t c h C m a t c h C c a o (a) 10 9 8 7 6 5 4 Lower decile 0.0 0.1 0.2 0.3 0.4 0.5 0.6 0.7 Density C c a o C m a t c h C m a t c h C c a o (b) 8 10 12 14 16 18 20 22 Upper decile 0.00 0.05 0.10 0.15 0.20 0.25 Density C c a o C m a t c h C m a t c h C c a o (c) Figure 11: Distribution plots for the (a) interquartile range, (b) lo wer decile and (c) upp er decile of the first principal comp onen ts in eac h case. 22 [7] T. F uku, A. Namatame, and T. Kaizo ji. Col le ctive Efficiency in Two-Side d Matching , pages 115–126. 2006. doi: 10.1007/3- 540- 28547- 4 10. [8] D. Gale and L. Shapley . College admissions and the stability of marriage. The Americ an Mathematic al Monthly , 69(1):9–15, 1962. doi: 10.2307/2312726. [9] Z. Huang. Clustering large data sets with mixed numeric and categorical v alues. In The First Pacific-Asia Confer enc e on Know le dge Disc overy and Data Mining , pages 21–34, 1997. [10] Z. Huang. A fast clustering algorithm to cluster very large categorical data sets in data mini ng. In Pr o c e e dings of the SIGMOD Workshop on R ese ar ch Issues on Data Mining and Know le dge Disc overy , pages 1–8, 1997. [11] Z. Huang. Extensions to the k -means algorithm for clustering large data sets with categor- ical v alues. Data Mining and Know le dge Disc overy , 2(3):283–304, 1998. doi: 10.1023/A: 1009769707641. [12] K. Iwama and S. Miy azaki. Stable Marriage with Ties and Inc omplete Lists , pages 2071–2075. Springer New Y ork, 2016. doi: 10.1007/978- 1- 4939- 2864- 4 805. [13] F. Jiang, G. Liu, J. Du, and Y. Sui. Initialization of k -mo des clustering using outlier detection tec hniques. Information Scienc es , 332:167–183, 2016. doi: 10.1016/j.ins.2015.11.005. [14] I. T. Jolliffe. Princip al Comp onent A nalysis and F actor A nalysis , pages 115–128. Springer New Y ork, 1986. doi: 10.1007/978- 1- 4757- 1904- 8 7. [15] A. Kwanashie, R. W. Irving, D. F. Manlo ve, and C. T. S. Sng. Profile-based optimal matchings in the student/pro ject allo cation problem. In Combinatorial Algorithms , pages 213–225, 2015. doi: 10.1007/978- 3- 319- 19315- 1 19. [16] D. F. Manlov e, R. W. Irving, K. Iwama, S. Miyazaki, and Y. Morita. Hard v arian ts of stable marriage. The or etic al Computer Scienc e , 276(1):261–279, 2002. doi: 10.1016/S0304- 3975(01) 00206- 7. [17] F. M ´ emoli. Metric structures on datasets: Stability and classification of algorithms. In Com- puter A nalysis of Images and Patterns , pages 1–33. Springer Berlin Heidelb erg, 2011. doi: 10.1007/978- 3- 642- 23678- 5 1. [18] M. K. Ng, M. J. Li, J. Z. Huang, and Z. He. On the impact of dissimilarit y measure in k -mo des clustering algorithm. IEEE T r ansactions on Pattern Analysis and Machine Intel ligenc e , 29 (3):503–507, 2007. doi: 10.1109/TP AMI.2007.53. [19] A. Olao de, G. Naghdy , and C. T odd. Unsup ervised image classification by Probabilistic Latent Seman tic Analysis for the annotation of images. In International Confer enc e on Digital Image Computing: T e chniques and Applic ations , 2014. doi: 10.13140/2.1.1909.4086. [20] A. Roth. The ev olution of the labor market for medical in terns and residents: A case study in game theory . Journal of Politic al Ec onomy , 92(6):991–1016, 1984. doi: 10.1086/261272. 23 [21] V. Satopaa, J. Albrech t, D. Irwin, and B. Ragha v an. Finding a ‘kneedle’ in a ha ystack: Detecting knee points in system b ehavior. In Pr o c e e dings of the 2011 31st International Confer enc e on Distribute d Computing Systems Workshops , pages 166–171, 07 2011. doi: 10.1109/ICDCSW.2011.20. [22] S. E. Schaeffer. Graph clustering. Computer Scienc e R eview , 1(1):27–64, 2007. ISSN 1574-0137. doi: 10.1016/j.cosrev.2007.05.001. [23] N. Sharma and N. Gaud. k -mo des clustering algorithm for categorical data. International Journal of Computer Applic ations , 127(17):1–6, 2015. doi: 10.5120/ijca2015906708. [24] The Matching library dev elop ers. Matching: v1.1, 2019. URL http://dx.doi.org/10.5281/ zenodo.2711847 . [25] H. Wilde, V. Knigh t, and J. Gillard. Evolutionary dataset optimisation: learning algorithm qualit y through ev olution. Applie d Intel ligenc e , 2019. doi: 10.1007/s10489- 019- 01592- 4. 24
Original Paper
Loading high-quality paper...
Comments & Academic Discussion
Loading comments...
Leave a Comment