A System for Real-Time Interactive Analysis of Deep Learning Training
Performing diagnosis or exploratory analysis during the training of deep learning models is challenging but often necessary for making a sequence of decisions guided by the incremental observations. Currently available systems for this purpose are li…
Authors: Shital Shah, Rol, Fern
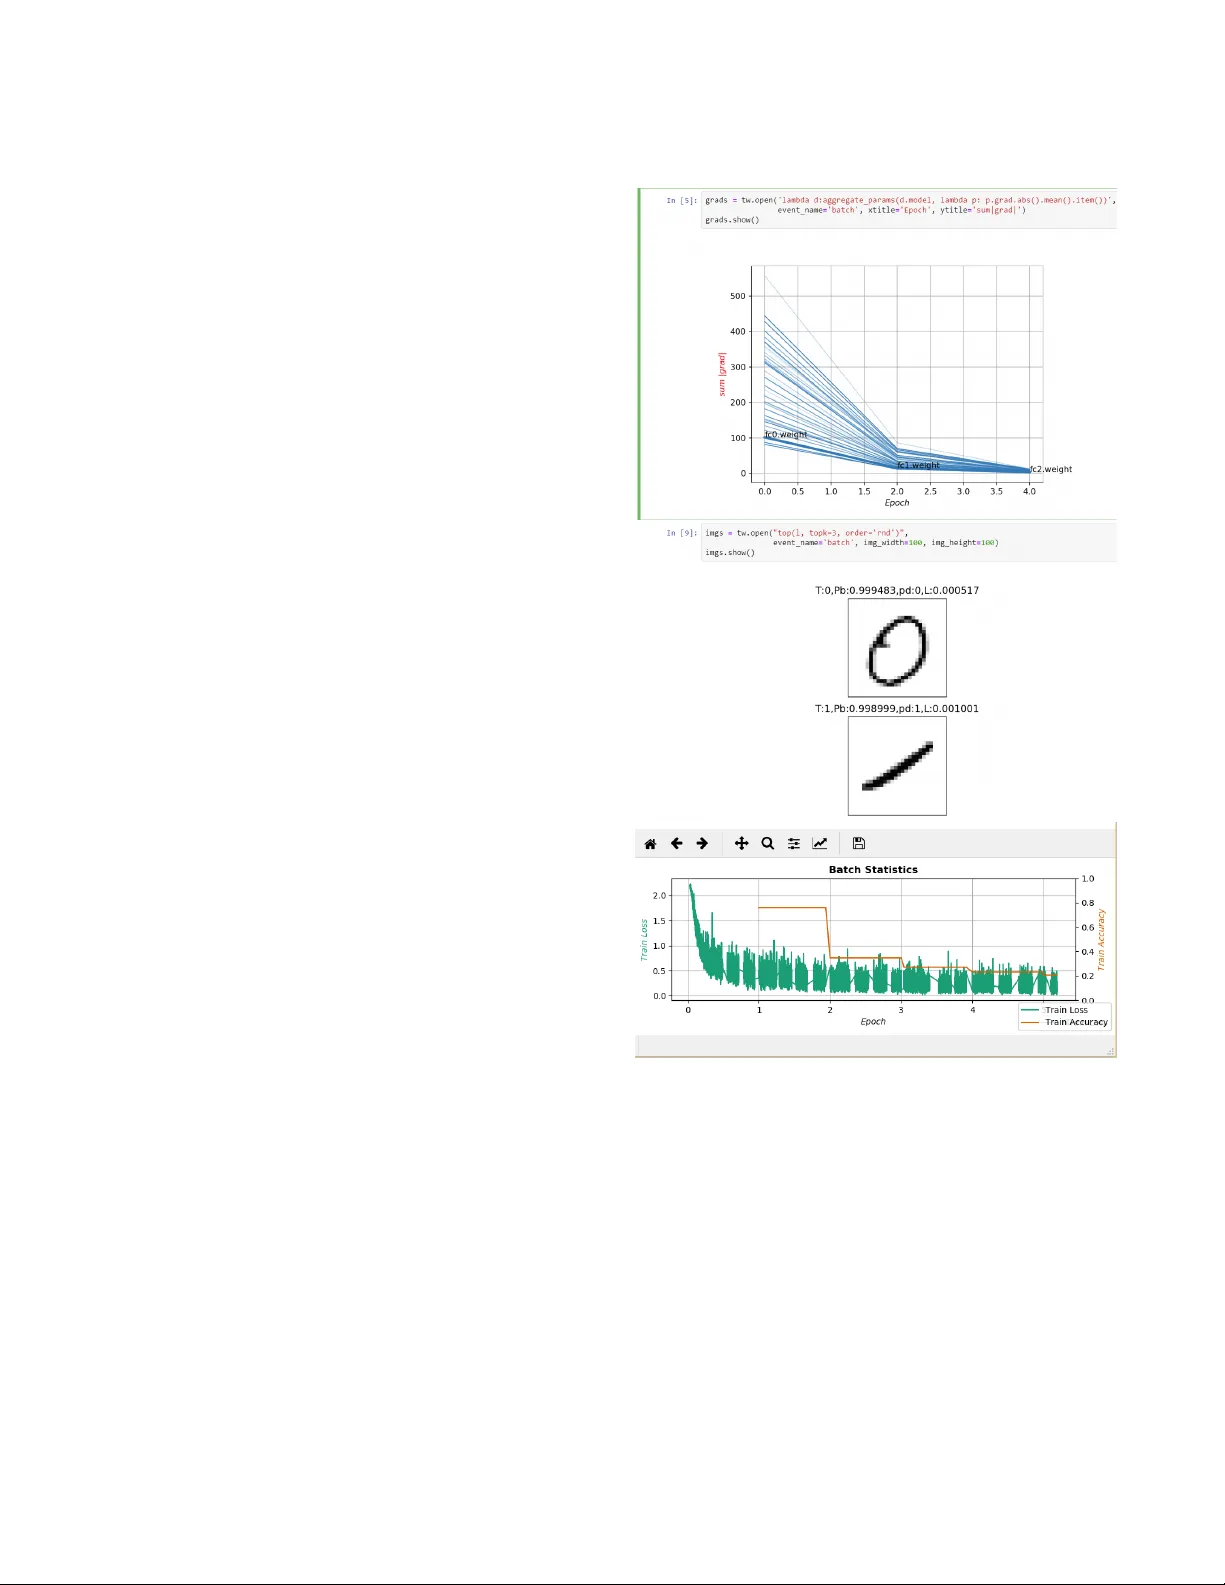
A System for Real- Time Interactive Analysis of Deep Learning T raining Shital Shah Microsoft Research Redmond, W ashington shitals@microsoft.com Roland Fernandez Microsoft Research Redmond, W ashington rfernand@microsoft.com Steven Drucker Microsoft Research Redmond, W ashington sdrucker@microsoft.com ABSTRA CT Performing diagnosis or exploratory analysis during the training of deep learning models is challenging but often necessary for making a sequence of decisions guide d by the incremental obser vations. Currently available systems for this purpose are limited to monitoring only the logge d data that must be spec ied before the training process starts. Each time a new information is desired, a cycle of stop-change- restart is required in the training process. These limitations make interactive exploration and diagnosis tasks dicult, im- posing long tedious iterations during the model de velopment. W e present a new system that enables users to perform inter- active queries on live processes generating real-time infor- mation that can be rendered in multiple formats on multiple surfaces in the form of several desir ed visualizations simul- taneously . T o achieve this, we model various exploratory in- spection and diagnostic tasks for deep learning training pro- cesses as specications for streams using a map-reduce par- adigm with which many data scientists are already familiar . Our design achieves generality and extensibility by dening composable primitives which is a fundamentally dierent ap- proach than is used by currently available systems. The open source implementation of our system is available as T ensor- W atch project at https://github.com/microsoft/tensorwatch. CCS CONCEPTS • Human-centered computing → Interactive systems and tools ; Visualization systems and tools ; • Computer systems organization → Architectures ; Real-time sys- tems . Permission to make digital or hard copies of all or part of this work for personal or classroom use is granted without fee provided that copies are not made or distributed for prot or commercial advantage and that copies bear this notice and the full citation on the rst page. Copyrights for comp onents of this work owned by others than the author(s) must be honored. Abstracting with credit is p ermitted. T o copy otherwise, or republish, to post on servers or to redistribute to lists, requires prior specic permission and /or a fe e. Request permissions from permissions@acm.org. EICS ’19, June 18–21, 2019, V alencia, Spain © 2019 Copyright held by the owner/author(s). Publication rights licensed to A CM. A CM ISBN 978-1-4503-6745-5/19/06. https://doi.org/10.1145/3319499.3328231 KEYWORDS debugging; diagnostics; exploratory insp ection; monitoring; visualization; deep learning; map-reduce; streams A CM Reference Format: Shital Shah, Roland Fernandez, and Steven Drucker. 2019. A Sys- tem for Real- Time Interactive Analysis of Deep Learning Training. In A CM SIGCHI Symposium on Engineering Interactive Computing Systems (EICS ’19), June 18–21, 2019, V alencia, Spain . ACM, New Y ork, N Y , USA, 6 pages. https://doi.org/10.1145/3319499.3328231 1 INTRODUCTION The rise of deep learning is complimented by ev er increasing model complexity , size of the datasets, and corresponding longer training times to develop the mo del. For example, nishing 90-epoch ImageNet-1k training with ResNet-50 takes 14 days to complete on an N VIDIA M40 GP U[ 26 ]. Researchers and practitioners often nd themselves losing productivity due to the inability to quickly obtain desired information dynamically from the training process without having to incur stop-change-restart cycles. While a few solu- tions have been developed for real-time monitoring of deep learning training, there has been a distinct lack of systems that oer dynamic expressiveness through conversational style interactivity supporting the exploratory paradigm. In this paper we oer a new system that enables the dy- namic specication of queries and eliminates the require- ment to halt the learning process each time a new output is desired. W e also enable the displays of multiple, simulta- neous visualizations that can be generated on-demand by routing to them the desired information chosen by the user . The pillars of our architecture are general enough to ap- ply our system design to other domains with similar long running processes. Our main contributions are (1) system design based on dynamic stream generation using map-reduce as the Do- main Sp ecic Language (DSL) to perform interactive analysis of long running processes such as machine learning train- ing (2) separation of concerns that allows to build dynamic stream processing pipeline with visualizations agnostic of rendering surfaces, and (3) abstraction to allow the compari- son of previously generated heterogeneous data along with EICS ’19, June 18–21, 2019, V alencia, Spain Shital Shah, Roland Fernandez, and Steven Drucker the live data in a desired set of visualizations, all specie d at the runtime. 2 RELA TED W ORK T ensorBoard[ 25 ] is currently among the most popular of monitoring tools, oering a variety of capabilities includ- ing data exploration using dimensionality reduction, and model data ow graphs. However , its monitoring capabili- ties are limited to viewing only the data that was e xplicitly specied to be logged before the training starts. While the tool provides some interactivity in visualization widgets, no interactivity is provided in terms of dynamic queries. Fur- thermore, fe w pre-dened visualizations are oered in the dashboard in a pre-congured tabbed interface and thus somewhat limited in other layout preferences. The logging-based model is also used by other frameworks, including Visdom[ 6 ] and VisualDL[ 1 ]. Several authors[ 6 , 14 , 23 ] have identied the research opportunities in diagnostic aspects of deep learning training and interactively analyzing it due to time consuming trial-and-error procedures. Map-reduce is an extensively studie d paradigm originated from the functional programming [21] and successfully uti- lized for constructing data ows and performing large scale data processing in the eld of distributed computing [ 5 , 7 , 12 ]. Many variants of map-reduce has been created[ 2 ] for a va- riety of scenarios, and it has also gained wide adoption for the various data analysis tasks[9, 18]. Visualizations based on streams have b een studied deeply for the real-time data scenarios[ 8 , 24 ] with various systems aiming to enhance interactivity , adaptability , performance and dynamic congurations[ 10 , 11 , 15 , 20 ]. Quer y driven visualizations have been popular for databases utilizing SQL and big data using custom DSLs[ 3 , 19 , 22 ]. This paradigm also becomes a cornerstone in our system design. 3 SCENARIOS W e describe a few real-world scenarios in this section to develop an intuition of the requirements and understanding of problems often faced by the practitioners. Diagnosing Deep Learning Training John is the deep learning practitioner with the task of devel- oping a model for gender identication from a large labeled dataset of human faces. As each experiment takes several minutes e ven on a reduced subset of the data, John wishes to view training loss and accuracy trends in real time. In many experiments, training loss does not seem to b e reducing and to understand the cause John needs to view the gradient ow chart. Howev er , this requires John to terminate the train- ing process, add additional logging for this information, and then restart the training. As John obser ves the gradient ow chart, he starts suspecting that his network may be suer- ing from the vanishing gradient problem. T o be sure, John now wishes to view gro wth of weights and the distribution of initial values. This new information again causes a stop- change-restart cycle adding signicant cost to obtain each new piece of information in the diagnostic process that is inherently iterative . Analyzing The Model Interpretation Results Susan is using a GAMs framework[ 13 ] to analyze the im- pact of each feature in her model. As a data scientist, she depends on Jupyter Notebook to perform her analysis. As the computation takes sev eral minutes b efore generating the desired charts, Susan wants to display progressive visual- izations displaying partial results as the y evolve. Instead of designing and implementing a custom system for her one-o experiment, it would be ideal if she could simply generate a stream of data using map-r educe paradigm that she is al- ready familiar with. This stream can then be easily painted to the desired rendering surface such as Jupyter Notebook to display progressive r eal-time visualization as her mo dels evolve in time . Diagnosing and Managing Deep Learning Jobs Rachel spins up several dozens of deep learning jobs as part of her experiments in GP U cloud infrastructure. These long running jobs may take many days to complete and there- fore are expensive to run in cloud. However , it turns out that many of the po orer performing jobs could be identi- ed much earlier and be terminated, thus freeing up the expensive resources. How ever , designing and building such infrastructure is time consuming and requires additional engineering skills. It would be ideal for Rachel if she could simply output streams of performance data from her jobs and then create a small monitoring application that consumes these streams. 4 SYSTEM DESIGN Ke y Actors Our system design contains the following key actors as shown in Figure 1: (1) A long running process P such as a deep learning training process. (2) Zero or more clients that may be located on the same or dierent machines as P . (3) An agent A that is emb edded in P listening to requests from the clients The Long Running Process W e abstract three spe cic characteristics of a long running process P : A System for Real- Time Interactive Analysis of Deep Learning Training EICS ’19, June 18–21, 2019, V alencia, Spain Figure 1: Collab oration diagram for our system depicting interactions between various actors. Standard notations are used with numb ered interactions indicating their se quence with alphab et sux denoting the potential concurrency . Our system includes the long running process generating various events, clients making requests for stream using map-reduce queries (denoted by MRx) for the desired events and the agent responding back with resultant streams that can b e directe d to desired visualizations or other processes. (1) P may generate many types of events during its life- time. Each type of event may occur multiple times, but the sequence of events is always serialized, i.e., there is never mor e than one ev ent of the same type occurring at the same time in the same process. (2) As ev ents of each typ e are strictly order ed so that we can optionally assign a group to any arbitrary contigu- ous set of ev ents. This ability will enable windowing for the reduce operator discussed later . (3) For each ev ent, optionally a set of values may be avail- able for the obser vation. For example, on a batch com- pletion event the metrics for that batch may be avail- able for the obser vation. The process informs the agent when an event occurs and provides access to these ob- servables. The Client At any point in time multiple clients may exist simultane- ously issuing the queries and consuming corresponding r e- sultant streams. Each query can be viewed as a str eam speci- cation with the following attributes: (1) The event type for which a stream should be generate d. An event type may have multiple associated streams but each stream has only one associated event type. (2) An expression in the form of map-r educe op erations. This expression is applied to the observables at the time of event and the output be comes the value in the resultant stream. The client may utilize the resultant stream by directing it to multiple processes such as visualizations chosen at the runtime. Thus the same str eam may generate a visualization as well as become input to another process in the data ow pipeline. The Agent The agent runs in-process in the host long running process P and characterized by the following responsibilities: (1) Listening to incoming requests for the creation of a stream. This is done asynchronously without blocking the host process P . (2) When P informs the agent that an event has occurred, the agent determines if any active streams exist for that event. If so, the agent executes the map-reduce computation attache d to each stream for that event and sends the result of this computation back to the client. An imp ortant aspe ct of the agent design is that if there are no streams requested for an event then there is almost no EICS ’19, June 18–21, 2019, V alencia, Spain Shital Shah, Roland Fernandez, and Steven Drucker performance penalty . Also, there is no performance penalty for having access to the large numbers of observables. This means that user may specify all of the variables of interest as observables beforehand and later use queries to use subset of them depending on the task. Example: Implementation for Deep Learning Training As an example of how above actors and abstractions may b e utilized, consider the deep learning training scenario. This process performs computation in series of epochs, comple- tion of each is an ep och event . During each ep och, we execute several batches of data, completion of each be coming a batch event . At each batch event we may obser ve the metric ob- ject that contains several statistics for the batch. Contiguous set of batch events within each epoch can be treated as one group. At the end of an epoch, we may want to compute some aggregated statistics which can easily be done by spec- ifying the map-reduce expr ession that extracts the desir ed value from the metric object and performing the aggregation operation on it. Multiple Processes and Streams The ab ove abstractions can easily be utilized to eciently inspect many simultaneously running processes and make decisions such as early termination or modify desired param- eters at the runtime. A user can also compare and visualize arbitrarily chosen subsets of jobs. Modifying the State of a Long Running Process Our design trivially enables a useful capability of changing the observables of the long running process. In the context of de ep learning training, this can be used for interactive hyper parameter tuning guided by obser vations [ 4 ]. W e sim- ply allow users to send commands from interfaces such as Jupyter Notebook to the agent running in the host pr ocess. The agent then executes these commands on observables presented to it by the host process at the specied events. Stream Persistence One of the signicant disadvantages of many current systems is the requirement that data of interest must be logged to the disk storage, which can become an expensive bottleneck. Our design with stream abstraction trivially enables pay- what-you-use model so that users can sele ctively specify at runtime to p ersist only those streams that they may b e interested in viewing or comparison in the future . 5 STREAM VISU ALIZA TION Once a stream is produced, it can be visualized, stored or processed further in users data ow graph. Figure 2: Screenshot of three simultaneous real-time visu- alizations on two dierent surfaces generated dynamically by an user for the MNIST training process. On the top is an interactive session in Jupyter Notebook where the user spec- ies map-reduce queries in a cell for each desired visualiza- tion. The rst output cell at the top shows evolution of aver- age absolute gradients for each layer with lighter lines indi- cating the older plots. The second output cell shows random sample of predictions so far . At the bottom is the plot of two batch statistics rendered in a separate native application. Adaptive Visualizers As we allow users to generate arbitrary streams dynamically , it becomes important that visualization widgets are speci- cally designed for automatic conguration by reecting on A System for Real- Time Interactive Analysis of Deep Learning Training EICS ’19, June 18–21, 2019, V alencia, Spain data available in the stream. W e adopt the adaptive visual- ization paradigm[ 16 , 17 ] for this purp ose. For example, a visualizer may de cide to paint a stream that has a tuple of two numeric values as a 2D line chart, tuple of 3 numeric values as a 3D line chart and tuple of 2 numeric and 1 string value as annotated 2D line chart. The user may override to select a precise rendering for a given stream. A visualizer may allow adding or removing streams dy- namically . The streams may not have the same data type allowing for the heterogeneous visualizations such as dis- play of a histogram and a line chart overlays. If a visualizer receives incompatible streams than it may display an error . In the context of deep learning, this enables capabilities such as viewing multiple related metrics in the same visualization or comparing data generated by multiple experiments in the same visualization. Frame Based Animated Visualizations Many useful visualizations may consume values in a stream one after another as they arrive, e.g. , line charts. Another interesting scenario is to consider each value in the stream providing the complete data for each frame in the visual- ization. This enables users to create dynamic specication for the animated visualizations using familiar map-reduce paradigm. In the context of deep learning training, this al- lows users to create on-demand custom visualizations such as per-layer gradient statistics change over time , display of sample predictions sorted by loss value and so on. 6 STREAM GENERA TION USING MAP-REDUCE Background There are many variants of the map-reduce model[ 2 ] and dierences in various implementations. W e will focus on the variant that is popular among data scientists and readily available in widely used programming languages such as Python. The map-reduce paradigm consists of two higher order operators: map and reduce . The map op erator accepts a func- tion M and a list of values V . The M is applied to each value in V to transform it to some other value or choose not to output any value, i.e. , the lter operation. The reduce operator accepts a function R and a list of values V . The R processes each value in V to produce an aggregated output value. For instance the operation of sum over a sequence can b e done as reduce operation with R that initializes aggregated value to 0 and then consumes each value in the sequence to produce new aggregated value. Extending Map-Reduce While the map operator consumes a stream and outputs a stream, the reduce operator consumes stream and outputs an aggregated value instead of a stream. The reduce opera- tor’s output is not generated until the entire stream ends. In several of our scenarios, we rather desire that the reduce op- erator works on a group of contiguous values in the stream, aggregating values in that group and outputting a stream. For instance, we may want to compute the average duration for batches within each epoch and generate a stream with these averages as epochs progresses. T o achieve this, we introduce an extension to allow us leveraging the existing infrastructure and avoid need for entirely new domain specic language. In our extension, we simply require that each value in the stream is accompanie d by an optional binar y value B which when t r u e triggers the output from the reduce operator . There are two advantages oer ed by this design: (1) B can b e set at any time by the host process P enabling many of our core scenarios trivially . (2) B can also be set by a client at any time. This enables the scenarios where the user dynamically denes the aggregation window . For example, the user may wish to view a metric averaged over e very 5 minutes. 7 IMPLEMENT A TION W e implement our design using Python and other frame- works describe d in this section. W e will b e releasing our implementation as an open source cross-platform oering. For networking stack we utilize the ZeroMQ librar y to implement publisher-subscrib er mo del b etween the agent and the client. Out of the box, we oer implementations for MatplotLib as well as Plotly frameworks for various visual- izations including line charts, histograms and image matrix. MatplotLib allows a variety of UX backends, many of which can run as native application or in Notebo ok interface for exploratory tasks. The Jupyter Lab allows transforming Note- book in to the user dened dashb oards. One of the key requirements in our system model is the implementation of the map-reduce extension describe d in Section 6. W e achieve this by implementing a component we call postable iterator . The postable iterator allows to p ost input sequence of tuple { v al ue , B } , where B is group com- pletion ag described in the Se ction 6. The postable iterator then evaluates the map-reduce expr ession and returns the output value of map or reduce op erator or signals the caller that no output was produced for the posted value. One of the key diculties in implementation using lan- guages such as Python and frameworks such as ZeroMQ, MatplotLib, and Jupyter Noteb ook is managing the limita- tions imposed for multi-threading. W e adopt the coop era- tive concurrency model with callbacks combining with the producer-consumer pattern to work ar ound many of these limitations. EICS ’19, June 18–21, 2019, V alencia, Spain Shital Shah, Roland Fernandez, and Steven Drucker 8 CONCLUSION W e describ ed the design of a system that brings data stream- ing and map-reduce style queries to the domain of machine learning training for enabling the new scenarios of diagnosis and exploratory inspection. W e identied several advantages of our system over currently popular systems, including the ability to perform interactive queries, dynamic construction of data ow pipelines, and decoupled adaptive visualizations as nodes in such pipelines. W e plan to release our system as an open source cross-platform oering to help researchers and engine ers p erform diagnosis and exploratory tasks more eciently for the deep learning training processes. A CKNO WLEDGMENTS W e would like to thank Susan Dumais for her guidance and advice on this project. REFERENCES [1] [n. d.]. Visualize your deep learning training and data awlessly . https://github.com/PaddlePaddle/VisualDL [2] Foto N. Afrati, Vinayak Borkar , Michael Carey , Neoklis Polyzotis, and Jerey D . Ullman. 2011. Map-reduce Extensions and Recursive Queries. In Proceedings of the 14th International Conference on Extending Data- base T e chnology (EDBT/ICDT ’11) . ACM, New Y ork, NY, USA, 1–8. https://doi.org/10.1145/1951365.1951367 [3] Shivnath Babu and Jennifer Widom. 2001. Continuous Queries over Data Streams. SIGMOD Rec. 30, 3 (Sept. 2001), 109–120. https://doi. org/10.1145/603867.603884 [4] James S. Bergstra, Rémi Bardenet, Y oshua Bengio, and Balázs Kégl. 2011. Algorithms for Hyper-Parameter Optimization. In Ad- vances in Neural Information Processing Systems 24 , J. Shawe- T aylor , R. S. Zemel, P. L. Bartlett, F. Pereira, and K. Q. W einb erger (Eds.). Curran Associates, Inc., 2546–2554. http://papers.nips.cc/paper/ 4443- algorithms- for- hyper- parameter- optimization.pdf [5] Bryan Catanzaro, Narayanan Sundaram, and Kurt Keutzer . 2008. A map reduce framework for programming graphics pr ocessors. [6] Jaegul Cho o and Shixia Liu. 2018. Visual Analytics for Explainable Deep Learning. IEEE Computer Graphics and A pplications 38, 4 (jul 2018), 84–92. https://doi.org/10.1109/mcg.2018.042731661 [7] Jerey Dean and Sanjay Ghemawat. 2008. MapReduce. Commun. A CM 51, 1 (jan 2008), 107. https://doi.org/10.1145/1327452.1327492 [8] Chandrajit Bajaj (Ed.), Chandrajit Bajaj, and C Fl John Wiley . 1998. Data Visualization T e chniques. [9] Jaliya Ekanayake, Shrideep Pallickara, and Georey Fox. 2008. MapRe- duce for Data Intensive Scientic Analyses. In 2008 IEEE Fourth Inter- national Conference on eScience . IEEE. https://doi.org/10.1109/escience. 2008.59 [10] B. Ellis. 2014. Real- Time A nalytics: Techniques to A nalyze and Visu- alize Streaming Data . Wiley . https://books.google.com/books?id= DFnOA w AA QBAJ [11] Stephen Few . 2006. Information Dashboard Design: The Eective Visual Communication of Data . O’Reilly Media, Inc. [12] Alan F. Gates, Olga Natkovich, Shubham Chopra, Pradeep Kamath, Shravan M. Narayanamurthy , Christopher Olston, Benjamin Reed, Santhosh Srinivasan, and Utkarsh Srivastava. 2009. Building a High- level Dataow System on T op of Map-Re duce: The Pig Experience. Proc. VLDB Endow . 2, 2 (Aug. 2009), 1414–1425. https://doi.org/10. 14778/1687553.1687568 [13] Tre vor Hastie and Robert Tibshirani. 1986. Generalized Additive Models. Statist. Sci. 1, 3 (aug 1986), 297–310. https://doi.org/10.1214/ ss/1177013604 [14] Shixia Liu, Xiting W ang, Mengchen Liu, and Jun Zhu. 2017. T o- wards better analysis of machine learning models: A visual analyt- ics perspective. Visual Informatics 1, 1 (mar 2017), 48–56. https: //doi.org/10.1016/j.visinf.2017.01.006 [15] Ivan Logre and Anne-Marie Déry-Pinna. 2018. MDE in Supp ort of Visualization Systems Design: A Multi-Staged Approach T ailored for Multiple Roles. Proc. ACM Hum.-Comput. Interact. 2, EICS, Article 14 (June 2018), 17 pages. https://doi.org/10.1145/3229096 [16] Constantinos Mourlas. 2009. Intelligent user interfaces : adaptation and personalization systems and technologies . Information Science Reference, Hershey , P A. [17] Kawa Nazemi. 2016. Adaptive Semantics Visualization . Springer Inter- national Publishing. https://doi.org/10.1007/978- 3- 319- 30816- 6 [18] Andrew Pavlo, Erik Paulson, Ale xander Rasin, Daniel J. Abadi, David J. De Witt, Samuel Madden, and Michael Stonebraker . 2009. A Com- parison of Approaches to Large-scale Data Analysis. In Proceedings of the 2009 ACM SIGMOD International Conference on Management of Data (SIGMOD ’09) . ACM, New Y ork, N Y , USA, 165–178. https: //doi.org/10.1145/1559845.1559865 [19] B. Plale and K. Schwan. 2003. Dynamic quer ying of streaming data with the dQUOB system. IEEE Transactions on Parallel and Distribute d Systems 14, 4 (apr 2003), 422–432. https://doi.org/10.1109/tpds.2003. 1195413 [20] Jonathan C. Roberts. 2007. State of the Art: Coordinated & Multiple Views in Exploratory Visualization. In Fifth International Conference on Coordinated and Multiple Views in Explorator y Visualization (CMV 2007) . IEEE. https://doi.org/10.1109/cmv .2007.20 [21] Guy L. Steele. 1995. Parallelism in Lisp. A CM SIGPLAN Lisp Pointers VIII, 2 (may 1995), 1–14. https://doi.org/10.1145/224133.224134 [22] K. Stockinger , J. Shalf, K esheng Wu, and E. W . Bethel. [n. d.]. Quer y- Driven Visualization of Large Data Sets. In VIS 05. IEEE Visualization, 2005. IEEE. https://doi.org/10.1109/visual.2005.1532792 [23] Nako Sung, Minkyu Kim, Hyunwoo Jo, Y oungil Y ang, Jingwoong Kim, Leonard Lausen, Y oungkwan Kim, Gayoung Lee, Dong-Hyun K wak, Jung-W oo Ha, and Sunghun Kim. 2017. NSML: A Machine Learning Platform That Enables Y ou to Focus on Y our Models. CoRR abs/1712.05902 (2017). arXiv:1712.05902 http://arxiv .org/abs/1712. 05902 [24] Jonas Traub, Nikolaas Steenbergen, P hilipp Grulich, Tilmann Rabl, and V olker Markl. 2017. Iš: Interactive Real- Time Visualization for Streaming Data. https://doi.org/10.5441/002/edbt.2017.61 [25] Kanit W ongsuphasawat, Daniel Smilkov , James W exler , Jimbo Wil- son, Dandelion Mane, Doug Fritz, Dilip Krishnan, Fernanda B. Vie- gas, and Martin W attenberg. 2018. Visualizing Dataow Graphs of Deep Learning Mo dels in T ensorFlow . IEEE Transactions on Vi- sualization and Computer Graphics 24, 1 (jan 2018), 1–12. https: //doi.org/10.1109/tvcg.2017.2744878 [26] Y ang Y ou, Zhao Zhang, Cho-Jui Hsieh, James Demmel, and Kurt Keutzer . 2018. ImageNet T raining in Minutes. In Proceedings of the 47th International Conference on Parallel Processing (ICPP 2018) . ACM, New Y ork, N Y , USA, Article 1, 10 pages. https://doi.org/10.1145/3225058. 3225069
Original Paper
Loading high-quality paper...
Comments & Academic Discussion
Loading comments...
Leave a Comment