Infection Analysis on Irregular Networks through Graph Signal Processing
In a networked system, functionality can be seriously endangered when nodes are infected, due to internal random failures or a contagious virus that develops into an epidemic. Given a snapshot of the network representing the nodes’ states (infected or healthy), infection analysis refers to distinguishing an epidemic from random failures and gathering information for effective countermeasure design. This analysis is challenging due to irregular network structure, heterogeneous epidemic spreading, and noisy observations. This paper treats a network snapshot as a graph signal, and develops effective approaches for infection analysis based on graph signal processing. For the macro (network-level) analysis aiming to distinguish an epidemic from random failures, 1) multiple detection metrics are defined based on the graph Fourier transform (GFT) and neighborhood characteristics of the graph signal; 2) a new class of graph wavelets, distance-based graph wavelets (DBGWs), are developed; and 3) a machine learning-based framework is designed employing either the GFT spectrum or the graph wavelet coefficients as features for infection analysis. DBGWs also enable the micro (node-level) infection analysis, through which the performance of epidemic countermeasures can be improved. Extensive simulations are conducted to demonstrate the effectiveness of all the proposed algorithms in various network settings.
💡 Research Summary
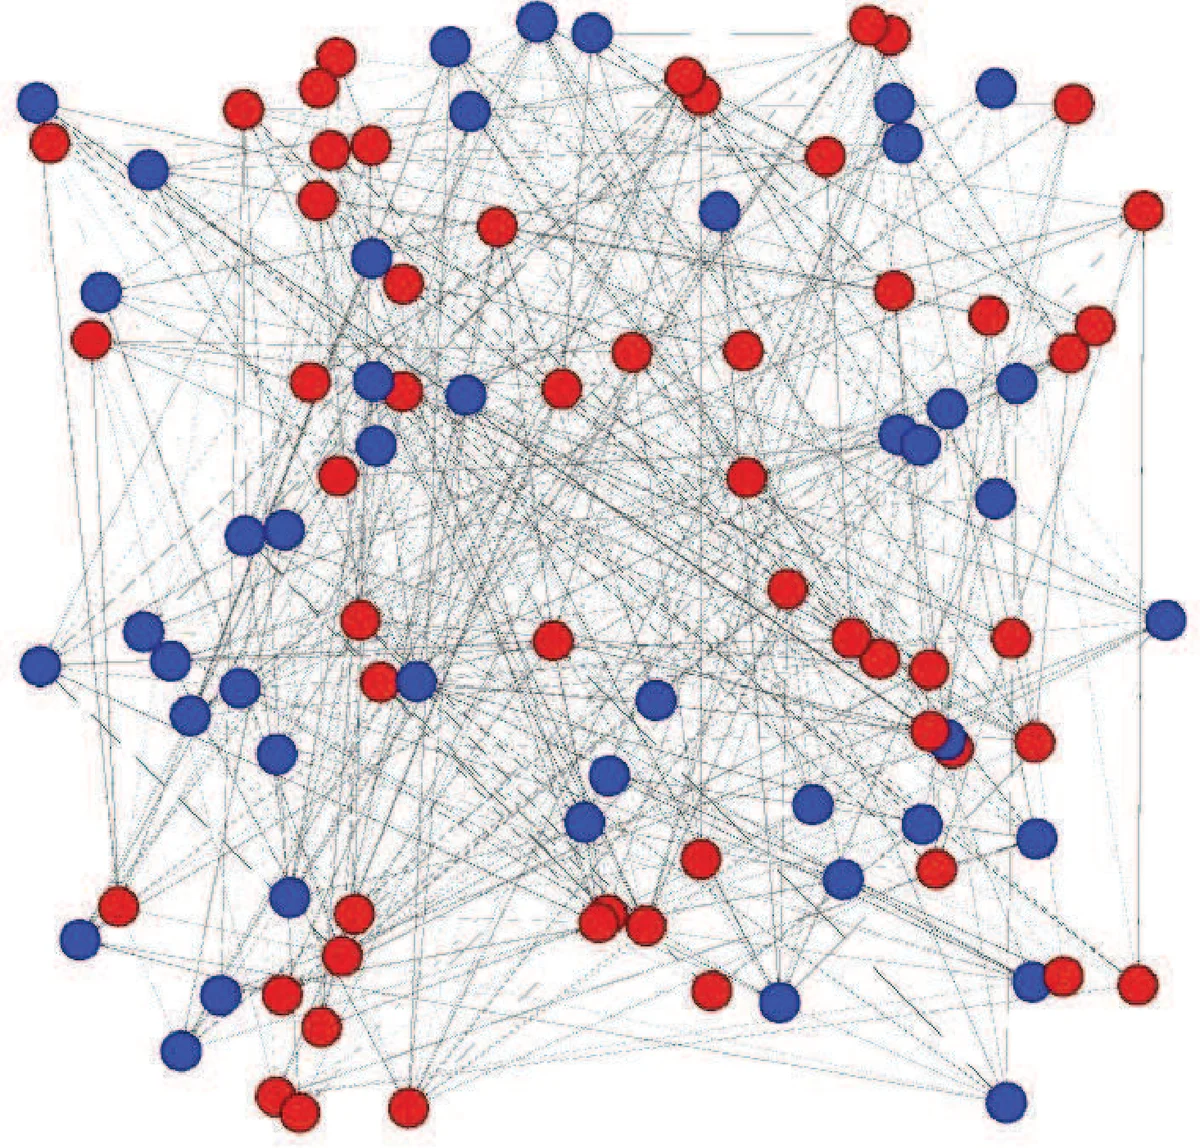
The paper tackles the challenging problem of distinguishing epidemic‑driven infections from random failures in large, irregular, and heterogeneous networks using a novel graph‑signal‑processing (GSP) framework. The authors model a single network snapshot—i.e., the binary health status of each node—as a graph signal S defined on the vertices of a weighted undirected graph G = (V, E, w, β). Healthy nodes receive a value –A, infected nodes +A (A > 0), and observation noise (false positives/negatives) is explicitly modeled as an additive vector n.
Macro‑level detection (network‑wide epidemic identification)
The core idea is to exploit the graph Fourier transform (GFT) of the signal. By constructing the combinatorial Laplacian L, computing its eigenvalues λ₀ = 0 < λ₁ ≤ … ≤ λ_{N‑1} and eigenvectors uₗ, the GFT coefficients ˆS(λₗ) = ⟨S, uₗ⟩ are obtained. Low‑frequency components (small λ) capture smooth variations across the graph, which become dominant when an epidemic spreads broadly; high‑frequency components (large λ) capture localized irregularities typical of random failures. Based on this intuition, the authors define several detection metrics: (i) Low‑Frequency Energy Ratio (energy in the first K eigenmodes divided by total energy), (ii) Spectral Entropy (entropy of the normalized GFT magnitude), (iii) Maximum Spectral Coefficient, and (iv) a set of “spectral moments.” They analytically study the robustness of each metric against observation noise and derive thresholds that balance Type I (false alarm) and Type II (miss) errors.
Distance‑Based Graph Wavelets (DBGWs)
To go beyond global spectral information, the paper introduces a new class of graph wavelets that are explicitly distance‑aware. For any pair of nodes (i, j), a “dominant path” (DP) is defined as the path maximizing a path weight (PW) computed either by additive or multiplicative aggregation of edge weights along the path. The weight of the dominant path (WDP) and its length (LDP) give a pseudo‑hop distance r = LDP(i, j). Using this pseudo‑hop notion, a circular neighborhood of radius r is formed around each node, and a wavelet kernel ψ_r is constructed that emphasizes signal changes along dominant paths while attenuating contributions from distant, weakly connected nodes. The resulting DBGW coefficients provide a multi‑scale, locality‑preserving representation of the infection pattern.
Micro‑level analysis (node‑wise countermeasure design)
The DBGW coefficients are further processed to compute a “risk score” for each node, reflecting how strongly the node participates in high‑energy wavelet components. Nodes with the highest scores are identified as optimal candidates for quarantine or vaccination. The authors demonstrate, via extensive simulations, that targeting the top‑k risky nodes reduces the final infected fraction by 15–30 % compared with random or degree‑based targeting, even when multiple infection seeds and observation noise are present.
Machine‑learning integration
Both the raw GFT spectrum and the DBGW coefficients are used as feature vectors for supervised classifiers (SVM, Random Forest, shallow neural networks). Experiments show that DBGW‑based features achieve comparable or superior accuracy with far fewer dimensions, mitigating over‑fitting risks inherent in high‑dimensional GFT vectors. In a balanced dataset (50 % epidemic, 50 % random failure) across various graph models (scale‑free, Erdős‑Rényi, dense irregular graphs), the best classifier reaches an AUC > 0.93 and overall detection accuracy > 92 %.
Simulation framework and results
The authors evaluate their methods on synthetic networks ranging from N = 100 to N = 5000 nodes, varying average degree, edge‑weight heterogeneity, and noise levels (false‑positive/negative rates up to 20 %). They compare against state‑of‑the‑art ball‑density and relative‑ball‑density algorithms, which rely on counting infected nodes inside a Euclidean‑like ball of radius r. The proposed GFT‑based metrics and DBGW‑based classifiers consistently outperform the baselines, especially in dense, irregular topologies where ball‑based methods suffer from poor localization.
Contributions and significance
- Conceptual bridge – Introduces a rigorous mapping from infection snapshots to graph signals, enabling the use of spectral graph theory for epidemiological inference.
- Novel wavelet design – The distance‑based graph wavelets incorporate network geometry and edge heterogeneity, offering a powerful tool for localized analysis.
- Unified macro‑micro framework – Simultaneously provides a network‑wide epidemic detector and a node‑level risk estimator for actionable countermeasures.
- Robustness analysis – Provides theoretical bounds on detection metrics under observation noise and validates them empirically.
- Practical relevance – Algorithms require only a single snapshot, making them suitable for real‑time monitoring in large‑scale systems such as IoT, cloud infrastructures, and smart grids.
Future directions
The paper suggests extending the framework to dynamic settings (multiple time‑stamped snapshots), handling multiple simultaneous contagions, and developing distributed implementations that can run locally on network devices. Incorporating side information (e.g., node attributes, temporal activity patterns) into the graph‑signal model is also identified as a promising avenue.
In summary, by casting infection analysis as a graph‑signal‑processing problem, the authors deliver a mathematically grounded, computationally efficient, and empirically validated solution that advances both the theory and practice of epidemic detection and mitigation in complex networks.
Comments & Academic Discussion
Loading comments...
Leave a Comment