Vectorizing Quantum Turbulence Vortex-Core Lines for Real-Time Visualization
Vectorizing vortex-core lines is crucial for high-quality visualization and analysis of turbulence. While several techniques exist in the literature, they can only be applied to classical fluids. Recently, quantum fluids with turbulence get more and more attention in physics. It is thus desirable that vortex-core lines can also be well extracted and visualized for quantum fluids. In this paper, we aim for this goal and developed an efficient vortex-core line vectorization method for quantum fluids, which enables real-time visualization of high-resolution quantum turbulence structure. Given the datasets by simulation, our technique is developed from the vortices identified by the circulation-based method. To vectorize the vortex-core lines enclosed by those vortices, we propose a novel graph-based data structure, with iterative graph reduction and density-guided local optimization, to locate more precisely sub-grid-scale vortex-core line samples, which are then vectorized by continuous curves. This not only represents vortex-core line structures continuously, but also naturally preserves complex topology, such as branching during reconnection. By vectorization, the memory consumption can be largely reduced by orders of magnitude, enabling real-time rendering performance. Different types of interactive visualizations are demonstrated to show the effectiveness of our technique, which could assist further research on quantum turbulence.
💡 Research Summary
The paper presents a complete pipeline for extracting, vectorizing, and interactively visualizing vortex‑core lines in quantum‑turbulence simulation data. Quantum fluids such as Bose‑Einstein condensates or superfluid helium are governed by complex‑valued field equations (e.g., the nonlinear Schrödinger equation or the nonlinear Klein‑Gordon equation). In these systems, vortex cores are mathematically defined as phase singularities of the complex field, which are typically sub‑grid phenomena and cannot be captured by conventional vorticity‑based methods used for classical turbulence.
The authors start from a circulation‑based detection technique introduced in prior work: for each grid node they compute the line integral of the phase gradient ∇σ around three orthogonal, ring‑shaped loops and select the maximum absolute circulation value. Nodes whose circulation exceeds a threshold (π) are marked as vortex nodes, forming a “vortex‑node graph” where edges connect neighboring nodes that belong to the same physical vortex line.
To convert this discrete graph into a compact, high‑fidelity representation, the paper introduces two key innovations. First, an iterative graph‑reduction step repeatedly averages neighboring node positions and removes redundant vertices, preserving the overall topology (including branching and reconnection events) while dramatically decreasing the number of samples. Second, a density‑guided local optimization refines the reduced node positions by exploiting the scalar density field ρ = |Φ|². The optimizer moves each sample toward regions of low density (the vortex core) using a small gradient‑descent step, achieving sub‑grid accuracy without expensive global solvers.
After reduction and optimization, each vortex line is represented by an ordered list of points. The authors fit continuous curves (B‑splines or Catmull‑Rom splines) through these points, yielding a mathematically smooth vector representation. This vectorization reduces memory consumption by orders of magnitude: a 2048³ NLKG dataset that would require tens of gigabytes in raw volumetric form can be stored in a few megabytes as a set of spline curves. Consequently, real‑time rendering (over 60 fps) becomes feasible on a standard laptop GPU, even for the highest‑resolution simulations.
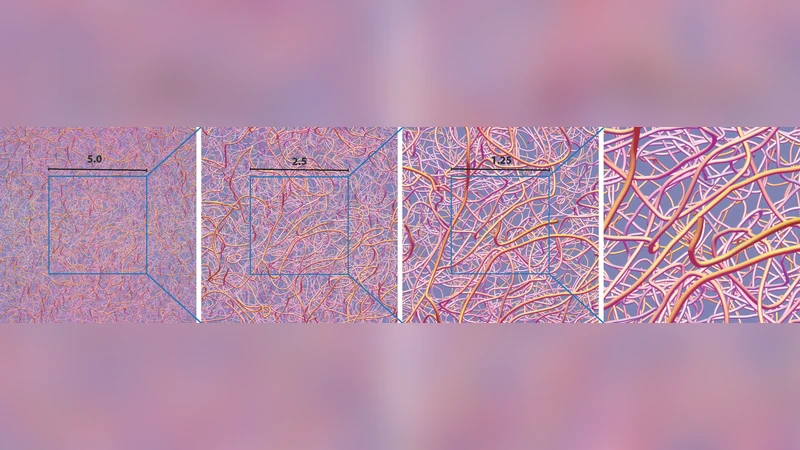
The paper demonstrates several interactive visualizations—zoom‑in/out, clipping, and color‑coding by curvature or circulation direction—showing that the method faithfully preserves complex topological events such as vortex reconnections. Quantitative comparisons with the original circulation‑based isosurface approach reveal higher extraction accuracy (lower length and curvature errors) and substantially lower memory usage.
In summary, the contribution lies in (1) adapting a circulation‑based vortex detection to quantum fluids, (2) introducing a graph‑based data structure that naturally encodes vortex topology, (3) applying iterative reduction and density‑guided optimization to obtain precise sub‑grid samples, and (4) vectorizing the lines with continuous splines to enable real‑time, high‑quality visual analysis. The authors discuss future extensions, including multi‑time‑step tracking, integration with physics‑based analysis tools, and application to other quantum‑fluid models such as the NLSE. This work bridges a gap between quantum‑fluid simulation and interactive scientific visualization, providing a practical tool for physicists studying quantum turbulence.
Comments & Academic Discussion
Loading comments...
Leave a Comment