Improving the resolution of microscope by deconvolution after dense scan
Super-resolution microscopes (such as STED) illuminate samples with a tiny spot, and achieve very high resolution. But structures smaller than the spot cannot be resolved in this way. Therefore, we propose a technique to solve this problem. It is ter…
Authors: Yaohua Xie
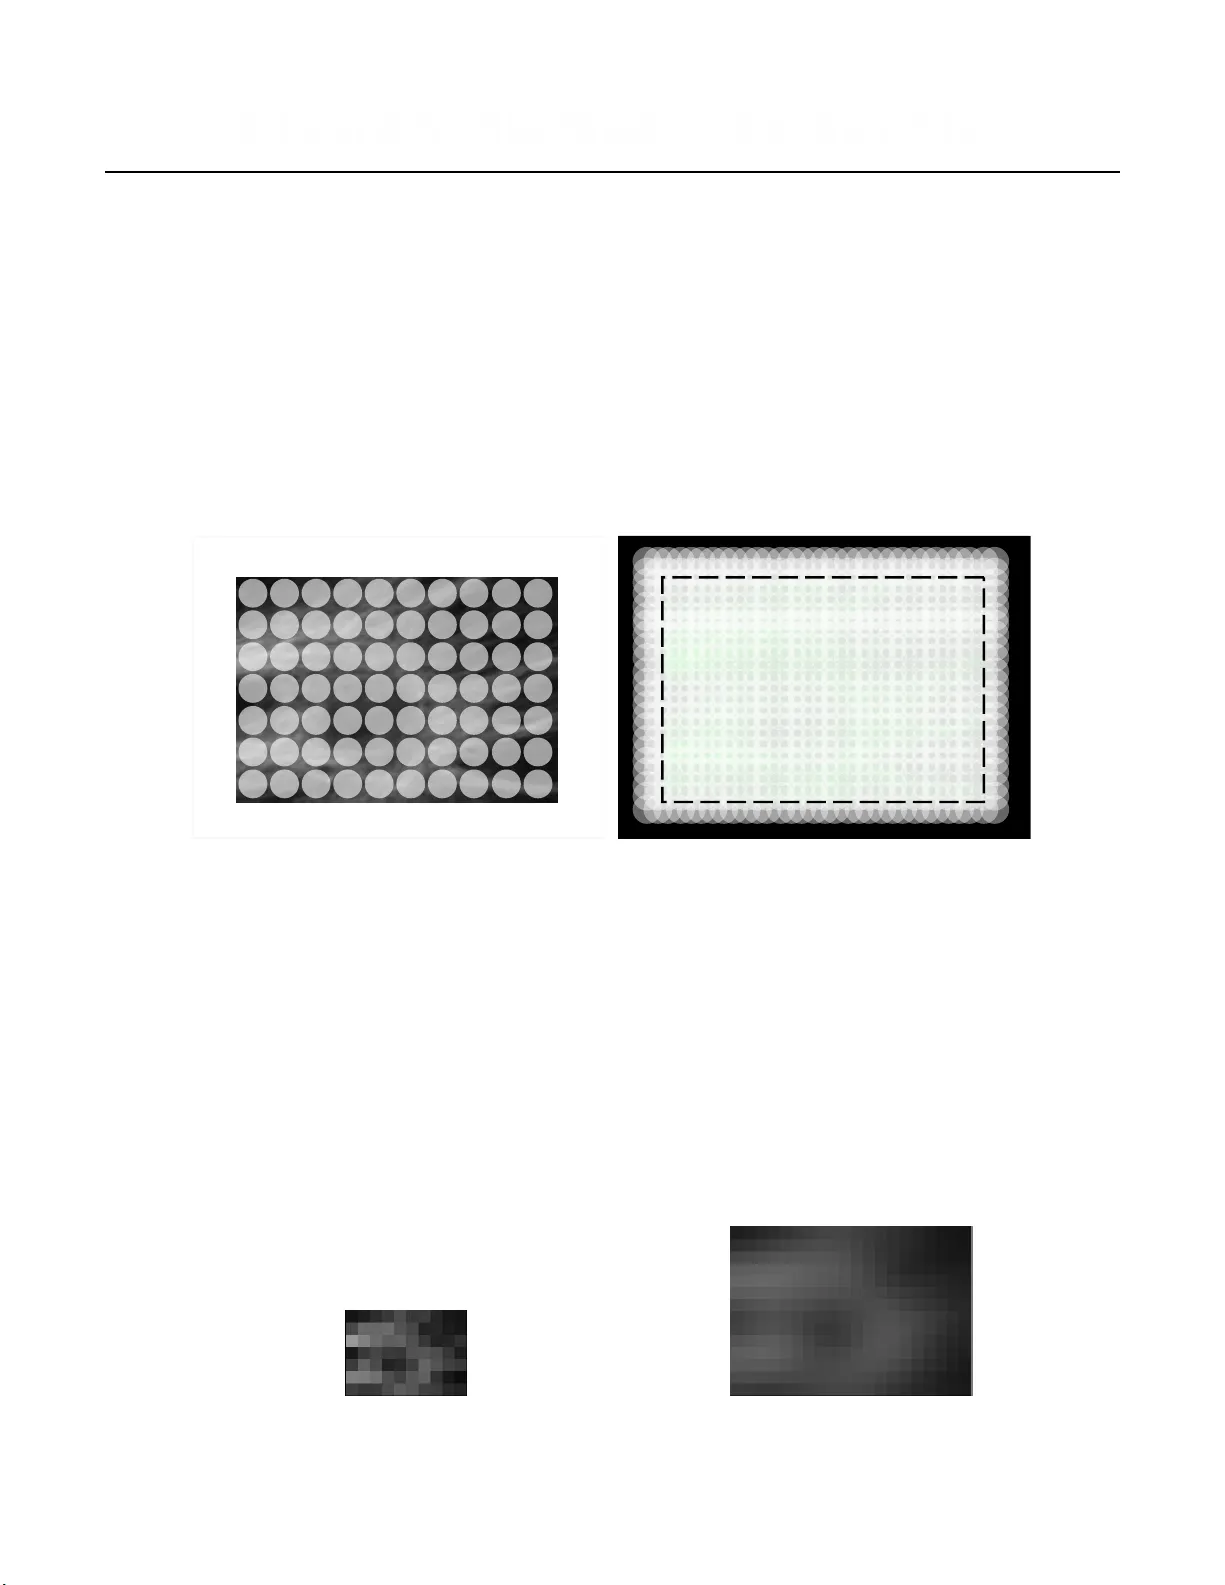
1 / 5 Impro ving the r esolution of micr oscope b y decon v olution afte r d ense sc an Y aohu a X ie, Y aohua.Xi e@hotmai l.co m Abstr act Super-r esolution micr oscopes (suc h as S TED) illumina te samples wit h a tin y spot, and achieve very high resolut ion. But struc tures smaller than the spot cannot be resolved in this wa y . Theref ore, we propose a techniq ue to solve this problem. It is term ed “ Decon volutio n after Dense Scan ( DDS )” . Firs t, a prepro cessin g st age is intr oduced to elimina te the optical uncert ainty of the peripher al areas around the sample’ s ROI (Reg ion of Inter est). Then, the ROI is scanned densely tog ether with its peripheral areas. Finally , the high resolution image is recov ered by dec onv olut ion. The propo sed techniqu e does not need t o modify th e appar atus much, and is mainly perfo rmed b y algorithm . Simula tion experimen ts show that t he technique c an further imp rove the reso lution of sup er -resolu tion mic roscopes. By now , exis ting super- reso lution t echniques hav e not only surpas sed the dif fractio n- limit, but also impr ov ed resolut ions significan tly [1] . For ex ample, stimula ted emissio n depletion (STED) [2] mic ros cope can illuminat e a sample at a spot much smaller than the diffrac tion limit, e.g., about 10 nm. In this case, the emission property at the targ eted loca tion (illuminat ed spot) can be got by measuring the light int ensity . Thereby , the whole image can be got by illuminating and measur ing the sample spot by spot. But struc tures smaller than the spot cannot be resolved in this wa y . In orde r to furth er impr ove the r esolution, we p ropo se a technique te rmed “ Decon volut ion aft er Dense Scan ( DDS )” . Fir st, it requires some prepro cessing on the sample befo re observat ion. Then, the sample is scanned densely with conv entio nal approach. Finally , decon volution [3] is perform e d on the resultin g (blurred) image to get a sharp imag e with higher reso lution. Decon volution is often used to remov e the out- of -focus background in fluoresc ence micros copy [4] , but it is us ed to further imp rove the resolution i n this s tudy . In this s tudy , the region need t o be observed is called R egion of In terest ( ROI). Th e ROIs’ s hapes can be a rbitrary , but a reco mmended way is t o include all t he ROIs in a bigger rectangular ROI. Fig.1. An e xample of th e pre-proces sing setup 2 / 5 The firs t st ep of the pro posed m ethod is the pre-p rocessi ng of sample. It is used to elimina te the optic al uncert ainty of the per ipher al areas around the ROI. For ex ample, the optic al charact eristics of the sample or background should be known in the peripher al areas aro und the ROI. In diff erent applic ations , the optical charact eristics may mean light refl ection or fluor escence ex cita tion char acteristics . Usually , the pe ripheral a reas ar e compris ed of t he loc ations outside the ROI, and the dist ance between e ach locatio n and the ROI should be no great er than the siz e of the illumination spot. One easy wa y to eliminat e the uncert ainty is: the light reflect ion and f luorescence ex citatio n is zer o (or ignor able) fo r everything in the peripher al areas . Fig. 1 shows an example of the pre-proc essing setup. The ROI is rect angular , and it is surrounded by mate rial with zer o refl ection and ex cita tion. The illumina tion spot never bey ond the outer border of the mat erial as long as it overlaps (partly or fully) with the ROI. Since the sample is scanned st ep by st ep, the pre-p rocessing c an be perform ed for d iffe rent parts of the ROI at diff erent time. W ithout t his pre-pr ocessing, the f ollowin g deconvo lution will not g et correct results . Fig.2. (a) Foo tprint in usual c ase (b) F ootprin t in dense-scan c ase Exist ing techniq ues, such as STED , illuminates the sample with spot smaller than the diffraction -limit. The spot illuminat es diff erent tin y areas in differ ent time. Then, a pix el val ue is figur ed o ut which r e presen ts the optical char acteris tic of each tin y area. Finally , all the pixel value s are combi ned to form a whole imag e. These techniqu es can get very high reso lution because the spot’ s size can be much small er than the diffr action -limit. Fig. 2(a) show s a n ex ample of how the spot ’ s “footprin ts” cover the sample. In the ex ample, the scanning step equals the spot ’ s size. If the step is short er , adjacen t fo otprin ts may overlap with one another , as shown by Fig. 2 (b). Thereby , the pix els also repr esent the optical charac teristics of ov erlapped areas. As a r esult, the c ombined image loo ks blurred. But it has more pixels than the usual c ase because the pixel number is rele vant to the scannin g st eps. Fig. 3(a) and (b) show the combi ned images of the usual case and the dense-scan case, respectively . S tructur es smalle r t he s pot’ s siz e can be dist inguished in none of the t wo c ases. Fig.3. (a) Combi ned imag e in usual c ase (b) Combined im age in d ense-scan c ase 3 / 5 In this study , the densely scann ed region includes not only the ROI, but also the peripher al areas. If the spot’ s size is as small as the step length in the dense-scan case, the combined image will be sharp. Such an image is the high resolut ion imag e we want , and is termed “ e xpected imag e” here . But the spot is actually larger than the step. So l et ’ s trea t the spot’ s light intens ity distrib ution as an image, and term it “spot image” . It is essentia lly a matrix whos e elements repr esent the ligh t int ensity values at diff erent loc ations (grids) . When the expected image is con volved with the spot image, the result would be a blurred image. It c an be prov ed that the blurre d image is ex actly the combi ned imag e Fig. 3(b), in the condition creat ed by the pre-pro cessin g. In short, the blurred image Fig. 3(b) is the con volution of the e xpected im age with t he spot image. Fig.4. (a) Spot a t the periphe ral areas (b ) Spot a t the ROI ar ea The conv olution is illus tra ted in Fig. 4. The center of the spot image lies in the peripheral areas in Fig. 4( a), and lies in the ROI in Fig. 4 (b). No ma tt er in which cases, an Airy-dis k-shaped pat tern of the illuminat ed area ( spot) can be get by the micros cope. Then the tot al int ensity of the r eflected ligh t or ex cited fluor escent can be figured out. This val ue i s used as a pi x el in the combined (blu rred) image . A ccording t o principles of opt ics [5] , re flected light or e x cited fluorescen t is app roxi mat ely equal (or pr oportional) to “the produ ct of illuminat ion and sampl e’ s optical char acteris tic ” . Multiply the spot image with the illumina ted imag e pix el -wise, and then sum all the values of the result ing image (matrix) . The sum will be equal (or proportiona l) to the pixel in the blurr ed image. Thereby , the con volution result is actually the blurred image; or , it can be get by multiplying the lat ter by a coe ffici ent. When the peripher al ar eas’ ligh t reflection and f luorescence ex cita tion is z ero, the c orresponding pix el v alues in the e xpect ed imag e ar e also zeros . This guar antees that the abov e co nclusion also c orrect when the s pot lies at t he imag e’ s boundary , as shown by Fig. 4(a). If the peripher al mater ial’ s optical charac teris tic is not zero , it should be known and intr oduced into the fo rm of con volution. In that case, the con volution would be more complic ated, but the proc edure is totally similar . If the reflect ed light or exci ted fluor escen t is more complic ated than “the pro duct of illumina tio n and sample’ s optical cha ract eristic ” , simila r procedu re can also be emplo yed to build the rela tionship betwe en images, and then the e xpected imag e can also be r ecover ed with corr esponding appr oaches. The abov e convo lution do es not happen by natur e or in a c omput er progr am, but perf ormed thr ough a manual procedu re inst ead. Thereby , it can be called “manual con volution” or “ concept ual con volutio n ” . Since the blurred imag e is only used to reco ver the exp ected image, it is termed “int ermediate image” her e. The spot image is acquired in advance and used as another input to the decon volution. Any feasib le approach es can be employed to perfo rm the decon volution, e.g., inve rse filtering, W einer filtering, solving a sy stem of equations , blind deconv olution, optimiz atio n, the com binat ion of mult iple approac hes, et c. 4 / 5 In the con volution, the spo t imag e (function of ligh t intens ity distributio n) pla ys a ro le of Poin t Spread Functio n (PSF) . But it has a signific ant diffe ren ce from the PSF of con ventional ligh t microsco pe . The spot PSF has zero val ues at all the locatio ns except a cent ral area. Aft er an image is convo lved with it, the result still has complet e component s including high frequency . On the contr ary , a micr oscope’ s PSF extends infinit ely , and is equi val ent to a low pass filt er in Fourier domain [6] . It remov es all the hig h frequ ency c omponents by con volution. In orde r to im pro ve e fficien cy , multiple spots could be used f or simult aneous scan as long as they do not aff ect one anot her . After decon volutio n, the reco ve red image is sharp and has more pix els than that in usual case. In other w ords, it has higher resolutio n and includes mo re d etailed struc tures. Simula tion experimen ts are perform ed to t est the pro posed technique. Fig . 5 shows the result of a typic al experim ent. In this experim ent, t he sample is simula ted by an image, i.e., the ex pected image. A ph ysic al sample actually has unlimit ed details , but the expect ed image only need to includ e sharp de tails at the expect ed resolutio n. In this experiment , t he expect ed resolutio n, i. e., the resol ution of the expect ed imag e is 0.1 nm/pix el . Tha t means the sample should be scanned with a st ep of 0.1 nm. The ROI is as larg e as the expect ed image which has 300x300 pixels, i.e., 30nm x 30nm. Fig. 5(a) shows the expect ed image, and Fig. 5 (b) shows the result when it is observed by a con ventional mic roscope. The sim ulat ed microsco pe has an Airy dis k whose r adius is about 2 00 nm. Tha t is about 2000 pix els in the expected r esolution. Fig. 5(b) looks very blurred because it is the con volutio n of the expected imag e with the micr oscope’ s PSF . The simula ted spot ‘ s diam et er is 10.1 nm, thereb y the spot image is 101x101 pix els in the expect ed resolution. In usu al scan case, the s pot’ s footprints are side by s ide. Only one pi xel can be figured out for each foot print (illumina ted loc ation). In other words, the reso lution is 10.1 nm/pi xel, and ther eby the com bined im age has less than 3x3 pixels (300 /101 = 2.9) . Almost no detail s can be disting uished in such a small image. On the con trary , the combined image has 500x500 pixels in the dense-sc an case, as shown by Fig. 5(c). Please not e that it co vers both the ROI and the periph eral areas , and is termed “in termediat e image” . Fig. 5 (d) s hows the result r ecover ed by the propos ed metho d. It is sharper than th e inter mediat e image, and much sharpe r than the con ventiona l result . The ave raged dif fer ence of pix el is 1.3565e- 11 betw een the re cov ered imag e and the e xpected im age. Fig.5. (a) Expect ed image (b) Conv entional resu lt (c) Int ermediat e image (d) Rec over ed imag e As demons trat ed by the e xper imen ts, the propo sed technique c an further imp rov e the resolut ion of exist ing super-reso lution microsco pes. Furthermo re, it does not requir e to change appar atus much, and most the job can be done by the al gorit hm. 5 / 5 But there are stil l some barri ers in pr actice. For ex ample, it co uld be difficult t o get the spot image accura te enough. Noises in any one of the images/da ta could dist ort the reco ver ed result s. Theref ore, it is import ant to inves tiga te and solve t hese pr oblems in the future. Ref erences 1. Sig al, Y .M., R.B. Zhou, and X. W . Zhuang, Visualizing and discovering cellular structures with super - resolution microscopy . Science, 2018. 361 (6405): p. 880 -887. 2. Hell, S. W . and J. Wichmann, Breaking the diffraction resolution limit by stimulated emission: stimulated-emission-depletion fluorescence microscopy . Optics Letters , 1994. 19 ( 11): p. 780-782. 3. Gonzalez, R.C. and R.E. W oods, Digital Image Processing (3rd Edition) . 2014: PEARSON. 4. ZENG, Z.-p., et al., Comp utational methods in super-resolution microscopy . Frontiers of Information T echnology & Electronic Engineering, 2017. 18 (09): p. 1222 -1236. 5. Born, M., et al., Principles of Optics: E lectromagnetic Theory of Propaga tion, Interf erence and Diffraction of Lig ht . 1999: Cambridge University Press. 6. Goodman, J. W ., Introduction to Fourier Optics . 2017: W . H. F reem an.
Original Paper
Loading high-quality paper...
Comments & Academic Discussion
Loading comments...
Leave a Comment