Modeling patterns of smartphone usage and their relationship to cognitive health
The ubiquity of smartphone usage in many people's lives make it a rich source of information about a person's mental and cognitive state. In this work we analyze 12 weeks of phone usage data from 113 older adults, 31 with diagnosed cognitive impairme…
Authors: Jonas Rauber, Emily B. Fox, Leon A. Gatys
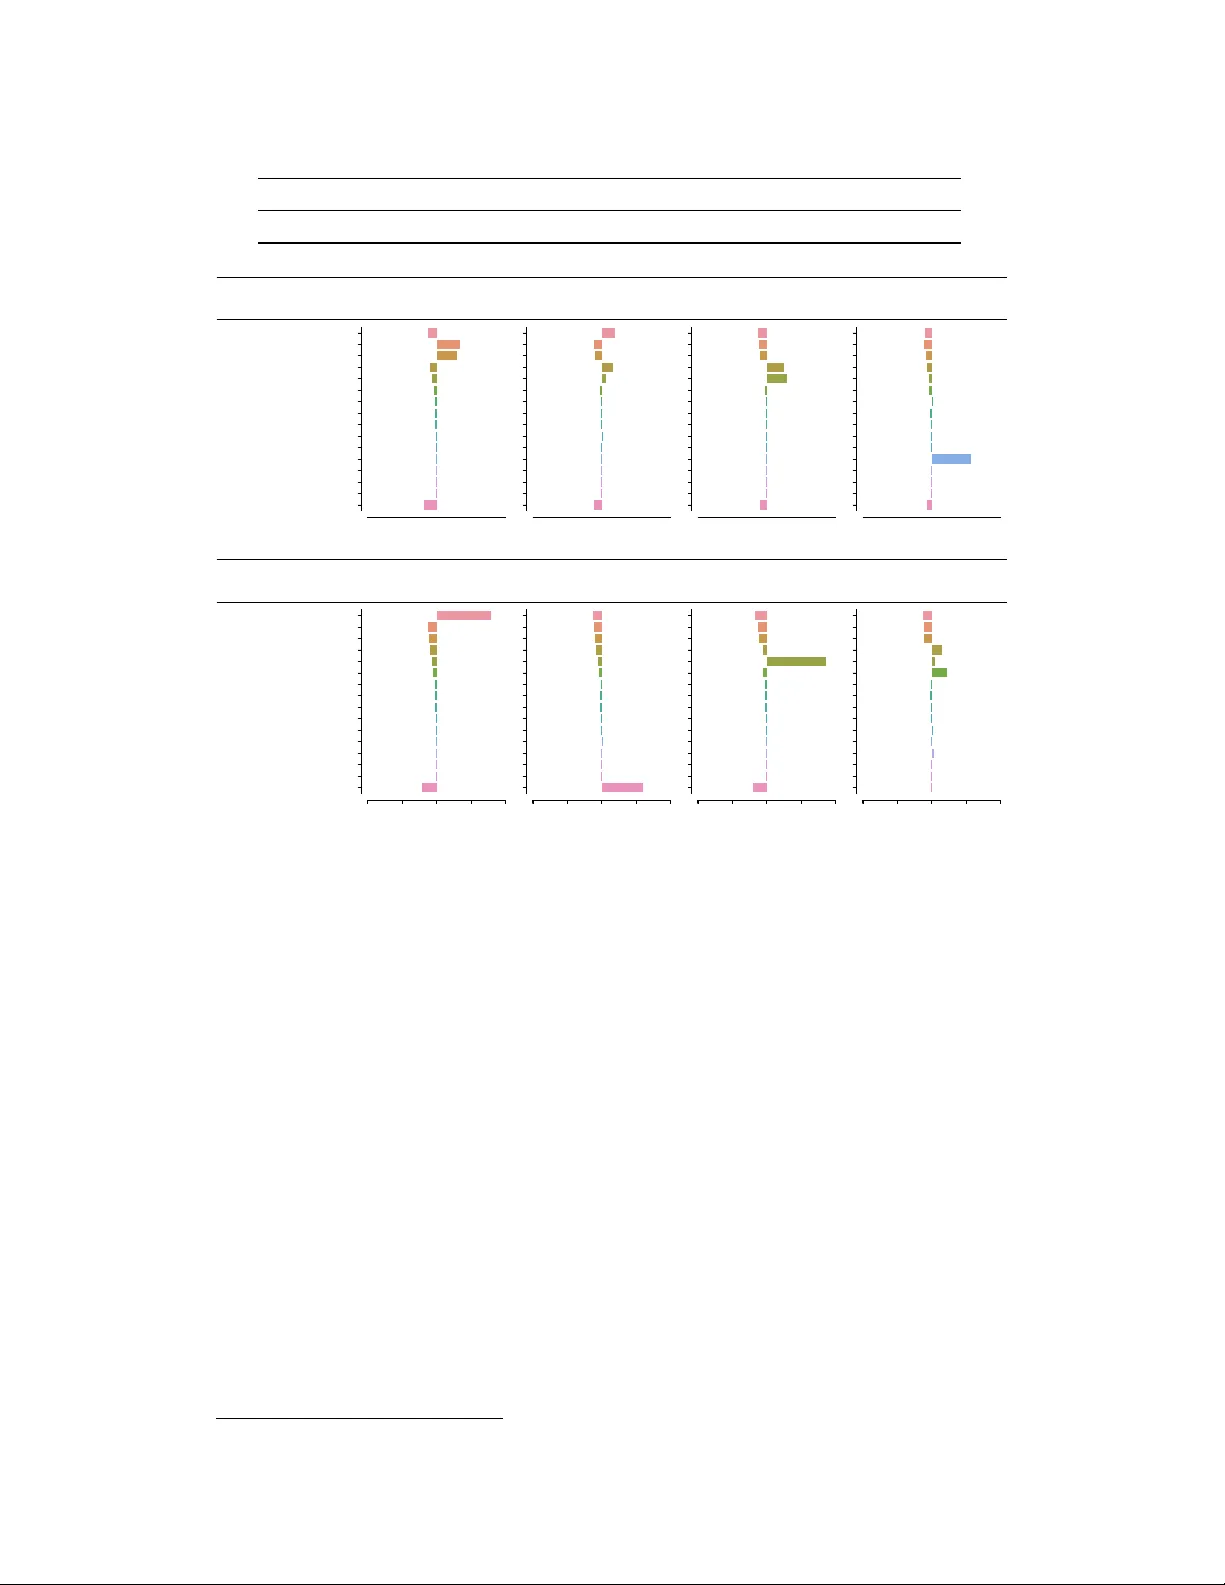
Modeling patter ns of smartphone usage and their r elationship to cognitiv e health Jonas Rauber ∗ Univ ersity of Tübingen jonas.rauber@bethgelab.org Emily B. Fox Apple emily_fox@apple.com Leon A. Gatys Apple lgatys@apple.com Abstract The ubiquity of smartphone usage in many people’ s liv es make it a rich source of information about a person’ s mental and cognitiv e state. In this work we analyze 12 weeks of phone usage data from 113 older adults, 31 with diagnosed cognitiv e impairment and 82 without. W e de velop structured models of users’ smartphone interactions to rev eal differences in phone usage patterns between people with and without cognitiv e impairment. In particular , we focus on inferring specific types of phone usage sessions that are predictiv e of cognitive impairment. Our model achieves an A UR OC of 0.79 when discriminating between healthy and symptomatic subjects, and its interpretability enables nov el insights into which aspects of phone usage strongly relate with cognitiv e health in our dataset. 1 Introduction & Related W ork The ubiquity of smartphone usage in many people’ s liv es make it a rich source of information about a person’ s mental and cognitiv e state. Here, we solely focus on app usage patterns and in v estigate to what extent they are informativ e about a person’ s cognitiv e health. There has been significant past w ork on analyzing smartphone app usage patterns in general (e.g., [ 5 , 13 , 11 , 17 , 12 ]), including many studies that predict user behaviour and characteristics based on app usage (e.g., [ 1 , 9 , 3 , 20 , 21 , 2 , 19 , 22 , 18 ]). Most closely related to our work are prior studies that aim to predict cognitiv e health and abilities from smartphone usage [ 10 , 7 , 14 ]. Gordon et al. [ 14 ] analyzed the relationship between app usage and cognitive function in healthy older adults. Characteristics of app usage such as number of apps installed, the av erage app duration or app usage by hour of the day was shown to be informati ve of Cogstate Brief Battery [ 15 ] test scores. Chen et al. [ 7 ] integrate a lar ger number of data sources, including passi vely sensed data (e.g., acti vity data, heart rate, phone usage, sleep data), survey responses (mood, ener gy), and apps testing specific psycho-motor functions (e.g., typing speed) into one model. Using an ensemble of gradient boosted trees [ 8 ] on 1k hand-engineered features, they achieve an area under the recei ver -operator curve (A UR OC) of 0.77 discriminating between healthy and symptomatic subjects. Inspired by these results, we address the same task as [ 7 ] while using only data sources related to app usage. Our model uses unsupervised learning to find different types of interaction sessions in a user’ s app stream. When combining the learned session types with supervised prediction of cognitiv e health, we obtain an A UR OC of 0.79. Through a number of ablation studies we demonstrate the importance of different model design decisions, including learned app embeddings, se gmenting of the app stream into sessions, and clustering the sessions into session types. Finally , the interpretable structure of our model reveals nov el insights into what aspects of phone usage hav e a strong relationship with cognitiv e health in our dataset. For example, we find that the relation between important apps such as Messages and cognitiv e health completely changes depending on what other apps are used in the same session. As such, the notion of sessions, and the learned structure of such session content, is critical to our performance; solely examining which apps are commonly used by an indi vidual is not suf ficient. ∗ W ork done during an internship at Apple. Machine Learning for Health (ML4H) at NeurIPS 2019 - Extended Abstract Sessions are segments from unlock to lock Cluster session vectors of all subjects into k session types Each user is now represented by a time series of session types time Flatten into count vectors of session types Logistic Regression cognitive health app2vec vector s = 1 N ∑ apps in session App 1 App 2 App 3 (a) ! (b) ! (c) ! (d) ! (e) ! represented by s Figure 1: Overview of model architecture. 2 Dataset W e use a subset of the data collected in a 12-week feasibility study which monitored 31 people with clinically diagnosed cogniti ve impairment and 82 healthy controls in normal li ving conditions [ 7 ]. The age range of the subjects w as between 60 and 75 with a median age of 66 and 66% of the subjects were female. In particular , we analyze the app usage event streams that consist of the timestamps and app identity of all app openings and closings for each user over the course of the study . Furthermore, we use the phone unlock/lock ev ent streams that consist of the time-stamps for all phone unlock and lock e v ents. Overall this data amounts to more than 800k app launches and 230k phone unlock ev ents. More elaborate details on the study design, data collection and the full dataset can be found in [7]. 3 Model Description Our model first se gments the app ev ent stream of each user into a stream of inter action sessions using the phone unlock/lock ev ent stream (Fig. 1a). Thus all apps that are opened in between a pair of phone unlock and lock e vents are grouped into the same session. T o represent the many dif ferent apps in the dataset in a way that encodes similarity between apps, we train a 50-dimensional embedding in the same way as the popular word2v ec [ 16 ] by considering each user to be a “sentence” and predicting each app from the three apps before and after it in time. T o obtain a single vector representation ~ s of each session, we av erage the embeddings of all apps within each session. Next, we use k-means to cluster all session vectors in the dataset to identify dif ferent session types (Fig. 1b). A user’ s app usage is then represented by a time-series of session types (Fig. 1c). Finally , we summarize the time series of each user by counting the session types (Fig. 1d). For each user , we normalize the absolute session counts by the number of days the user participated in the study . In addition, we rescale all features of all users together such that the overall mean is 1 (to mak e the size of the features independent of the number of clusters). These features are then used as input to an L1-regularized logistic re gressor to classify users as healthy or symptomatic (Fig. 1e). 4 Experiments & Results Since the number of users, N, in our dataset is small, we perform our experiments using N leave-one- out (LOO) train/test splits. For each of the N splits we select model hyper -parameters via a second LOO cross-validation loop on the N-1 training subjects. The model parameters consist of the logistic regression weights and the h yper-parameters consist of (i) the number of session types, K, used for the session clustering and (ii) the in verse regularization strength, C, for the logistic regression. W e ev aluate the final performance by computing A UR OC using the predicted probabilities from each of the N left out test subjects [ 6 ] (T able 1). Our full model achieves a test A UROC of 0.79, which is slightly higher than the 0.77 reported in [7] that used a much larger range set of input features. 2 As described in Section 3, our full model entails segmenting the app stream into sessions, embedding apps into a vector space and av eraging them to get session v ectors, and clustering session v ectors into session types. Here, we systematically ev aluate the impact of each of these model design choices on our ability to predict cognitiv e health using ablation studies. Our first baseline (B1) tests the importance of grouping the app ev ent stream into interaction sessions using the unlock/lock stream. Instead of aggregating and clustering phone usage at the session lev el, 2 Note though that [ 7 ] uses random 70/30 train/test splits instead of LOO for ev aluation. This may limit their performance giv en the small size of the dataset. 2 T able 1: Comparison to baseline models. Model Full Model B1 B2 B3 B4 B5 B6 Chance T est A UROC 0.79 0.75 0.69 0.75 0.61 0.72 0.53 0.50 Messages Call Phone Mail Safari Facebook Study App Calendar Camera Photos Google Settings Messenger Contacts Clock Other M C P M S F S C C P G S M C C O M C P M S F S C C P G S M C C O M C P M S F S C C P G S M C C O weight · sum of feature 565,1 562,2 408,0 219,6 app closest to cluster center Phone W allet WBTV 3 Local News Settings most common session in cluster (Phone,) (Messages, Mail) (Mail, Safari) (Settings,) Session T ypes Symptomatic weight · sum of feature -1435,5 -807,6 -380,1 -361,5 app closest to cluster center Messages Cruise Finder Safari The Charlotte Observer News most common session in cluster (Messages,) (Find my Friends,) (Safari,) (Mail, Facebook) Session T ypes Healthy 1.0 0.5 0.0 0.5 1.0 Messages Call Phone Mail Safari Facebook Study App Calendar Camera Photos Google Settings Messenger Contacts Clock Other 1.0 0.5 0.0 0.5 1.0 M C P M S F S C C P G S M C C O 1.0 0.5 0.0 0.5 1.0 M C P M S F S C C P G S M C C O 1.0 0.5 0.0 0.5 1.0 M C P M S F S C C P G S M C C O Figure 2: Analysis of session types with highest impact on classification. we cluster the individual app embeddings directly . W e observe that performance drops from 0.79 to 0.75 when not grouping the app ev ent stream in terms of sessions. Our next three baselines (B2, B3, B4) aim to isolate the effect of the learned app embeddings. In B2, we randomly permute the assignment between apps and their embeddings and find that performance drops from 0.79 to 0.69. In B3 and B4, we replace the learned app embeddings with one-hot vectors encoding the app identity (B3) or coarser-scale App Store cate gory (B4) of the app. Session vectors are obtained by av eraging the one-hot app v ectors and a user is represented as the sum o ver session vectors instead of counts ov er learned session types. While both B3 (0.75) and B4 (0.61) perform worse than our full model, the much larger drop for B4 indicates that App Store categories do not retain sufficient information to support the do wn-stream classification. Our final two baselines (B5, B6) hav e the least structure, using one-hot encodings instead of learned embeddings (like B3 and B4) and no session aggregation (like B1). Each user is represented as a vector of counts of the different apps (B5) or App Store categories (B6). Again, we find that performance decreases (B3 → B5: 0.75 → 0.72, B4 → B6: 0.61 → 0.53) when not grouping the app ev ent stream into sessions. 5 Model Introspection For our first analysis, we fit the model to all N subjects and analyse the four session types with the highest contribution to the model decision in either direction (Fig. 2). The contribution of a session type is measured by the product between the regression weight and the corresponding feature’ s value summed over all subjects ( weight · sum of feature ). T o characterize each session type we report the app closest to the cluster center 3 and the most common session in the session 3 As described in section 3, each session type is a cluster in the app2vec embedding space. 3 5 healthy users with lowest score (“true negative”) 1. (Messages,) 2. (Messages, Facebook) 3. (Camera,) 1. (Messages,) 2. (T elegram Messenger,) 3. (Camera,) 1. (Messages,) 2. (Mail, W eather) 3. (W eather,) 1. (Messages,) 2. (Facebook, Phone, Messenger) 3. (Facebook, Phone) 1. (Messages,) 2. (Mail, Facebook) 3. (Mail, W ord Crossy) 5 symptomatic users with lowest score (“false negative”) 1. ( Call , Call , Phone, Phone) 2. (Phone,) 3. (Clock,) 1. (Calendar ,) 2. (Calendar , Clock) 3. (Calendar , Calendar) 1. (KCRW ,) 2. (Inbox by Gmail,) 3. (L yft Driver ,) 1. (Clock,) 2. (Messages, Mail) 3. (Messages, Clock) 1. (Y ahoo Mail,) 2. (Y ahoo Mail, Y ahoo Mail) 3. (Messages, Y ahoo Mail) 5 healthy users with highest score (“false positive”) 1. (Mail, Facebook) 2. (Mail, Facebook, Outlook) 3. (Mail, Mail, Facebook, Outlook) 1. (Messages,) 2. (Instagram,) 3. (Camera,) 1. (Find my Friends,) 2. (Instagram,) 3. (Beddit Sleep Monitor ,) 1. (Messages,) 2. (Messages, Messages) 3. (Camera,) 1. (Messages,) 2. (Instagram,) 3. (Messages, Instagram) 1. (Calendar ,) 2. (Clock,) 3. (Phone,) 1. (W ords with Friends,) 2. (Cookie Jam,) 3. (Jelly Splash,) 1. (Calendar ,) 2. (Calendar , Calendar) 3. (Messages, Mail) 1. (Messages, Mail) 2. (Messages, Messages, Mail) 3. (Messages, Safari) 1. (Messages, Mail) 2. (Messages, Safari) 3. (Mail, Safari) 5 symptomatic users with highest score (“true positive”) Figure 3: T wenty dif ferent users, fi ve for each combination of healthy (right) or symptomatic (left) and high score (top) or low scor e (bottom). For each of these users, we list the three sessions with the largest contrib ution to the respecti v e high or lo w score. type. Furthermore, for the 15 most common apps in the dataset, we visualize the difference between the app distribution in each session type and the overall distribution of apps in the dataset (Fig. 2, bar plots). The four session types that are most strongly associated with a high symptomatic score are dominated by Call and Phone , Messag es and Mail , Mail and Safari , and Settings (Fig. 2 upper half), followed by Clock and Calendar (not sho wn). Session types most strongly related to a low score for symptomatic are dominated by Messages , Safari , Mail and F acebook and one session type consisting of many less frequent apps and thus difficult to summarize. W e observe a v ery interesting dependency of the influence of a session type on the interplay between multiple apps. The session types dominated by Messag es and Mail or Mail and Safari strongly increase the model’ s predicted score for symptomatic, whereas session types dominated by single Messa ges or single Safari sessions or by Mail and F acebook strongly decrease it. T o better understand our model’ s prediction for individual subjects, we use the N models resulting from the LOO procedure and analyze which sessions cause them to (mis-)classify the respectiv e test subjects. Inference in our model is linear and thus we know the contrib ution of each session of a user to the model’ s prediction. In Fig. 3 we sho w twenty dif ferent users, fiv e for each combination of healthy (right) or symptomatic (left) and high scor e (top) or low score (bottom). For each of these users, we list the three sessions with the largest contrib ution to the respecti v e high or lo w score. For subjects with a high score (top) the most contrib uting single app sessions contain Phone , Calendar and Clock . For subjects with a lo w score (bottom) the most contributing single app sessions contain Messages , Instagr am and Camera . As in our first analysis, we see that the impact of apps such as Messages or Mail strongly depends on the surrounding apps in the session. When Messages shares a session with Mail or Safari it strongly increases the predicted score. When Messag es is alone or in a session with F acebook or Instagram it strongly decreases the predicted score. Overall we find that very similar sessions cause the model to correctly assign a high score to symptomatic subjects as well as to incorrectly assign a high score to healthy subjects (Fig. 3 upper half) and similarly for (in-)correctly assigning low scores (Fig. 3 lo wer half). 6 Discussion & Future W ork The reported results hav e sev eral potential limitations. For example, the generalization of our results to the general population will be limited by size of the dataset and the fact that symptomatic subjects were already diagnosed when entering the study . Nev ertheless, it is exciting that app usage alone captures systematic dif ferences between healthy and symptomatic subjects and we are activ ely pursuing multiple av enues to extend our model. There are multiple parts in our model that can be replaced by more complex building blocks. For example, one could use topic models [ 4 ] to extract session types or replace the logistic regression by a non-linear classifier such as gradient boosted trees or neural networks. Additionally , we are aiming to incorporate the ordering of the apps in each session as well as user context such as time of the day or a user’ s motion state into the session representation. Finally , we are exploring methods to learn the extraction of session types jointly with the classification of cognitiv e health in and end-to-end fashion. 4 References [1] R. Baeza-Y ates, D. Jiang, F . Silvestri, and B. Harrison. Predicting the next app that you are going to use. In Pr oceedings of the Eighth ACM International Confer ence on W eb Searc h and Data Mining , pages 285–294. A CM, 2015. [2] Y . Bai, B. Xu, Y . Ma, G. Sun, and Y . Zhao. Will you ha ve a good sleep tonight?: sleep quality prediction with mobile phone. In Pr oceedings of the 7th International Conference on Body Ar ea Networks , pages 124– 130. ICST (Institute for Computer Sciences, Social-Informatics and T elecommunications Engineering), 2012. [3] G. F . Bati and V . K. Singh. “trust us”: Mobile phone use patterns can predict indi vidual trust propensity . In Pr oceedings of the 2018 CHI Conference on Human F actors in Computing Systems , page 330. ACM, 2018. [4] D. M. Blei, A. Y . Ng, and M. I. Jordan. Latent dirichlet allocation. Journal of machine Learning resear ch , 3(Jan):993–1022, 2003. [5] M. Böhmer , B. Hecht, J. Schöning, A. Krüger, and G. Bauer . Falling asleep with angry birds, facebook and kindle: a large scale study on mobile application usage. In Pr oceedings of the 13th international confer ence on Human computer interaction with mobile devices and services , pages 47–56. A CM, 2011. [6] A. P . Bradley . The use of the area under the roc curv e in the e v aluation of machine learning algorithms. P attern Recogn. , 30(7):1145–1159, July 1997. ISSN 0031-3203. doi: 10.1016/S0031- 3203(96)00142- 2. URL http://dx.doi.org/10.1016/S0031- 3203(96)00142- 2 . [7] R. Chen, F . Jankovic, N. Marinsek, L. Foschini, L. K ourtis, A. Signorini, M. Pugh, J. Shen, R. Y aari, V . Maljkovic, et al. Dev eloping measures of cogniti ve impairment in the real w orld from consumer-grade multimodal sensor streams. In Proceedings of the 25th ACM SIGKDD International Confer ence on Knowledge Discovery & Data Mining , pages 2145–2155. ACM, 2019. [8] T . Chen and C. Guestrin. Xgboost: A scalable tree boosting system. In Proceedings of the 22nd acm sigkdd international confer ence on knowledge discovery and data mining , pages 785–794. ACM, 2016. [9] G. Chittaranjan, J. Blom, and D. Gatica-Perez. Mining large-scale smartphone data for personality studies. P ersonal and Ubiquitous Computing , 17(3):433–450, 2013. [10] P . Dagum. Digital biomarkers of cognitive function. npj Digital Medicine , 1(1):10, 2018. [11] T . M. T . Do, J. Blom, and D. Gatica-Perez. Smartphone usage in the wild: a large-scale analysis of applications and context. In Pr oceedings of the 13th international conference on multimodal interfaces , pages 353–360. A CM, 2011. [12] K. Farrahi and D. Gatica-Perez. Daily routine classification from mobile phone data. In International W orkshop on Machine Learning for Multimodal Interaction , pages 173–184. Springer , 2008. [13] A. Girardello and F . Michahelles. Appaware: Which mobile applications are hot? In Pr oceedings of the 12th international conference on Human computer interaction with mobile devices and services , pages 431–434. A CM, 2010. [14] M. L. Gordon, L. Gatys, C. Guestrin, J. P . Bigham, A. T rister , and K. P atel. App usage predicts cognitiv e ability in older adults. In Pr oceedings of the 2019 CHI Conference on Human F actors in Computing Systems , page 168. A CM, 2019. [15] P . Maruff, E. Thomas, L. Cysique, B. Brew , A. Collie, P . Snyder , and R. H. Pietrzak. V alidity of the cogstate brief battery: relationship to standardized tests and sensitivity to cogniti ve impairment in mild traumatic brain injury , schizophrenia, and aids dementia complex. Arc hives of Clinical Neuropsyc hology , 24(2):165–178, 2009. [16] T . Mikolov , K. Chen, G. Corrado, and J. Dean. Efficient estimation of word representations in vector space. arXiv preprint arXiv:1301.3781 , 2013. [17] A. Morrison, X. Xiong, M. Higgs, M. Bell, and M. Chalmers. A large-scale study of iphone app launch behaviour . In Pr oceedings of the 2018 CHI Confer ence on Human F actors in Computing Systems , page 344. A CM, 2018. [18] E. L. Murnane, S. Abdullah, M. Matthe ws, M. Kay , J. A. Kientz, T . Choudhury , G. Gay , and D. Cosley . Mobile manifestations of alertness: Connecting biological rhythms with patterns of smartphone app use. In Pr oceedings of the 18th International Confer ence on Human-Computer Interaction with Mobile Devices and Services , pages 465–477. ACM, 2016. [19] V . K. Singh and I. Ghosh. Inferring individual social capital automatically via phone logs. Proc. ACM Hum.-Comput. Interact. , 1(CSCW):95:1–95:12, Dec. 2017. ISSN 2573-0142. doi: 10.1145/3134730. URL http://doi.acm.org/10.1145/3134730 . [20] R. W ang, G. Harari, P . Hao, X. Zhou, and A. T . Campbell. Smartgpa: how smartphones can assess and predict academic performance of college students. In Proceedings of the 2015 ACM international joint confer ence on pervasive and ubiquitous computing , pages 295–306. ACM, 2015. 5 [21] R. W ang, W . W ang, A. daSilva, J. F . Huckins, W . M. K elley , T . F . Heatherton, and A. T . Campbell. Tracking depression dynamics in college students using mobile phone and wearable sensing. Pr oceedings of the A CM on Interactive, Mobile, W earable and Ubiquitous T echnologies , 2(1):43, 2018. [22] S. Zhao, J. Ramos, J. T ao, Z. Jiang, S. Li, Z. W u, G. Pan, and A. K. Dey . Discovering dif ferent kinds of smartphone users through their application usage behaviors. In Pr oceedings of the 2016 ACM International Joint Conference on P ervasive and Ubiquitous Computing , pages 498–509. ACM, 2016. 6
Original Paper
Loading high-quality paper...
Comments & Academic Discussion
Loading comments...
Leave a Comment