Multi Label Restricted Boltzmann Machine for Non-Intrusive Load Monitoring
Increasing population indicates that energy demands need to be managed in the residential sector. Prior studies have reflected that the customers tend to reduce a significant amount of energy consumption if they are provided with appliance-level feed…
Authors: Sagar Verma, Shikha Singh, Angshul Majumdar
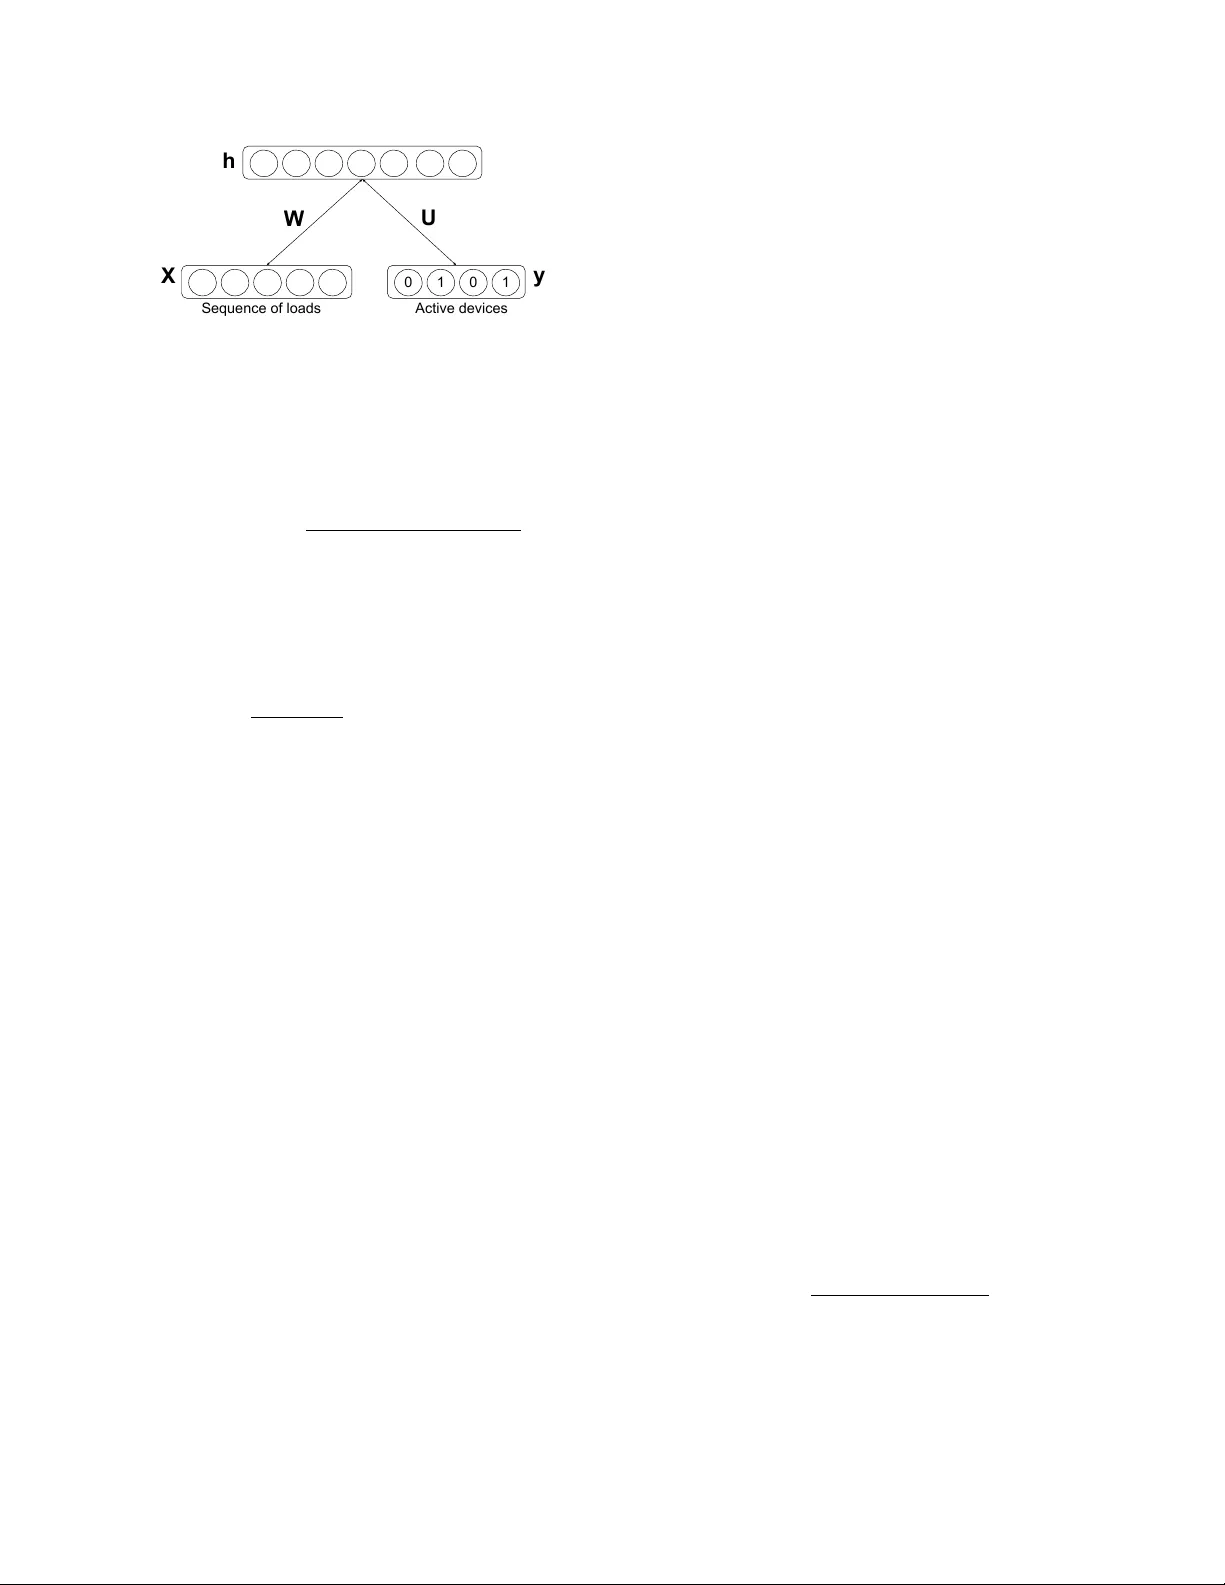
MUL TI LABEL RESTRICTED BOL TZMANN MA CHINE FOR NON-INTR USIVE LO AD MONITORING Sagar V erma, Shikha Singh and Angshul Majumdar Indrapratha Institute of Information T echnology , Delhi ABSTRA CT Increasing population indicates that energy demands need to be managed in the residential sector . Prior studies hav e re- flected that the customers tend to reduce a significant amount of ener gy consumption if the y are provided with appliance- lev el feedback. This observ ation has increased the relev ance of load monitoring in today’ s tech-savvy world. Most of the previously proposed solutions claim to perform load moni- toring without intrusion, but they are not completely non- intrusiv e. These methods require historical appliance-level data for training the model for each of the devices. This data is gathered by putting a sensor on each of the appliances present in the home which causes intrusion in the b uilding. Some recent studies ha ve proposed that if we frame Non- Intrusiv e Load Monitoring (NILM) as a multi-label classi- fication problem, the need for appliance-level data can be av oided. In this paper , we propose Multi-label Restricted Boltzmann Machine(ML-RBM) for NILM and report an ex- perimental ev aluation of proposed and state-of-the-art tech- niques. Index T erms — Machine learning, Multi-Label Classi- fication, Non-Intrusive Load Monitoring, Smart Grid, Re- stricted Boltzmann Machine. 1. INTR ODUCTION Increasing population is a direct indication of growth in en- ergy demands in the residential as well as commercial sector [1]. T o meet the demands non-renewable resources are used which is the leading cause of global warming [2]. Energy saving and demand-side management is need-of-the-hour . Load monitoring is one of the ways to collect the ener gy data required to devise automated energy management sys- tems. It also helps in pro viding feedback to consumers to understand their consumptions. The feedback enables cus- tomers to participate in energy-saving and cost-cutting activ- ities [3]. There are two ways to perform load monitoring. One way is to put sensors on each of the appliances deployed in a b uilding that can sample the energy consumption and store the data. The second way is to use such algorithms that can segre gate the appliance-lev el load from the aggregated units of consumption. The first one is a non-practical approach. It is not only costly but intrusive too. The second way , known as Non-Intrusiv e Load Monitoring /Non-Intrusive Appliance Load Monitoring (NIALM), is more practical and scalable than the first one. Most of the state-of-the-art NILM algorithms, until re- cently , use historical appliance-level sampled data to learn models of individual appliances used in the building. Once the model for each of the targeted devices is trained, the se g- regation could be performed just by estimating the device- specific loads from the sampled aggregated load. The re- quirement of appliances’ consumption data makes the train- ing phase intrusiv e. In recent studies [4 – 6], NILM has been framed as a multi- label classification problem. These techniques make use of annotated aggreg ated load for training the model. The anno- tation contains information about the ON/OFF state of each of the target devices. The annotation can be performed with the help of the cameras installed on premises. This frame- work circumvents the need for de vice-lev el loads, and thus the training phase does not require multiple sensors in the buildings. This modification enables a large-scale roll-out of NILM from the utilities. Our work is motiv ated by advantages of the transforma- tion of NILM as a Multi-label classification task and the suc- cess of deep learning as a solution to similar problems. W e propose a new approach to multi-label classification based on the Restricted Boltzmann Machine (RBM) [7]. RBMs have nev er been used for multi-label classification so far . It is a classic example of algorithm adaptation for multi-label clas- sification. RBMs [8] have been ef fectiv e in learning high-level fea- tures and capturing high-order correlations of the observed variables. A typical RBM has a hidden unit in which nodes are conditionally independent giv en the visible state. RBMs hav e good reconstruction accurac y which can be le veraged to generate individual load information in latent space. W e pro- pose that generativ e property of RBMs combined with multi- label supervision can be used to perform NILM via state de- tection of appliances. 2. LITERA TURE REVIEW 2.1. Combinatorial Optimization Studies in combinatorial optimization (CO) such as [9] are based on the principle that total consumption in a building can be approximated as a sum of device-le vel loads. So ag- gregated consumption in a b uilding can be expressed as P ag g = N X i =1 s i P i (1) where P i is individual device load, P ag g is aggregated load, N is the total number of appliances, and s i is a vector that indicates the state of devices i.e., 0 for ’OFF’ state and 1 for ’ON’ state. For load segre gation, the motiv e is to find out the combi- nations of individual loads whose sum can be approximated as the aggregated load. W e can formulate the task of simulta- neous detection of ON/OFF state of the devices, ˆ s , as _ s = arg min s P ag g − N X i =1 s i P i (2) Equation (2) is an NP-hard problem and quickly becomes intractable as the number of appliances scales up. 2.2. F inite State Machines Apart from the computational complexity , another problem with CO is that it cannot account for the fact that one appli- ance can run at different power le vels, e.g. A.C., fan, w asher , etc. Howe ver these days most of the appliances (like light, fan, A.C., washer) have marked dif ferent states, so it is fair to model the state of the de vices as Hidden Marko v Mod- els (HMMs). The study [10] models aggregated load as an outcome of the interaction of a finite number of independent HMMs. Most of the modern appliances such as printers, comput- ers, inv erters do not hav e marked states. They are continu- ously varying. In such situations, the abov e assumption fails; this, in turn, leads to poor disaggregation performance. 2.3. Multi-Label Classification The classification task where one sample may belong to one or more classes is kno wn as multi-label classification (MLC). Hence, in this case, each sample is mapped to a binary vector of 0’ s and 1’ s, assigning 0 or 1 to each of the classes. Since the aggregated load of a building at any instance may be an outcome of several acti ve appliances’ consump- tion, T abatabaei et al. [4], and Li et al. [5], framed NILM as an MLC problem. [4] compared the performance of two multi- label classifiers viz Multi-Label K-Nearest Neighbours (ML- kNN) and Random k-Label Sets (RakEl) using time-domain and wa velet-domain features of appliances. Another recent work [6] uses Multi-label Consistent Deep Dictionary Learning for simultaneous detection of activ e ap- pliances from smart meter data. These methods do not di- rectly segreg ate appliance-level load but first identify states of appliances and then disaggreg ated load is obtained by mul- tiplying the average power consumption of device with the number of instances, it was detected to be in an activ e state. By far these are the most recent and best-known techniques for multi-label classification based disaggregation. 3. PR OPOSED APPRO A CH Restricted Boltzmann Machines [8] are one type of undirected graphical models that use hidden v ariables to model high- order and non-linear regularities of the data. A typical RBM is a tw o-layer bipartite graph with two types of units, the visible units x and hidden units h . An RBM represents probability distributions ov er the random variables under an energy-based model. The energy model of an RBM is given by E ( x, h ) = − x T W h − b T x − c T h , where W is the weight to be learned. The joint probability distribution over ( x, h ) is expressed as P ( x, h ) = 1 z exp ( − E ( x, h )) , where Z is the normalization factor . Learning RBMs is a difficult task due to the tractability in volv ed in computing normalization factor Z . Se veral learn- ing algorithms hav e been proposed [11 – 13] to solve the prob- lem abo ve. Contrasti ve Diver gence (CD) method proposed by Hinton et al. [11] is an efficient method and is widely used to learn RBMs. The generati ve property of RBM makes it use- ful for learning latent space representation of data where we don’t have information about how data is generated. RBMs hav e been used for dimensionality reduction [14], collabora- tiv e filtering [15], anomaly detection [16] and unsupervised feature learning [17]. The classification RBM has been used for various classification tasks in [7, 18] and label consistent collaborativ e filtering [19]. 3.1. Multi-Label Classification RBM The joint probability distribution of the proposed multi-label classification RBM model shown in figure 1 is gi ven by , p ( y , x, h ) ∝ e − E ( y ,x,h ) (3) where y is the label unit. W e define the ne w energy func- tion as follows: E ( y , x, h ) = − h T W x − a T x − b T h − c T y − h T U y (4) with parameters Θ = ( W, a, b, c, U ) . The model is illus- trated in figure 1. W e find the values of visible and hidden units using (5), (6) and (7) respectiv ely . p ( h j = 1 | x, y ) = σ ( b j + U j l + X k W j i x i ) (5) 0 1 0 1 h X y W U Sequence of loads Active devices Fig. 1 . Proposed architecture for NILM using multi-label classification RBM. p ( x i | h ) = σ ( a i + X j W j i h j ) (6) p ( y l = 1 | h ) = exp ( c l + P j U j l h j ) P y l =1 exp ( c l + P j U j l h j ) (7) where σ is the logistic sigmoid and l is the class label out of C classes. These formulations capture the predictiv e information about the input vector as well as the tar get class. Network parameter Θ is learned using CD [11] algorithm, ∆ W ij = η δ log p ( x, y ) δ W ij = η ( < x i y i h > data − < x i y i h > model ) (8) where η is the learning rate. For multi-label classification RBM, the above formulation changes as now we have multi-label information present for each sample. The conditional distribution of y giv en h be- comes: p ( y l = 1 | h ) = σ ( c l + X i U j l h j ) (9) This formulation is not tractable since y now has 2 C possible values. Therefor for inference we use mean field (MF) message-passing method for an approximate infer- ence. The MF approach tries to approximate the joint posterior p ( y , h | x ) by a factorial distribution q ( y , h ) = Q C l =1 µ y l l (1 − µ l ) 1 − y l Q n j =1 τ h j j (1 − τ j ) 1 − h j that minimizes the Kullback-Leibler (KL) diver gence with the true poste- rior . Running the follo wing message passing procedure to con ver gence µ l ← σ ( c l + X j U j l τ j ) ∀ l ∈ { 1 , ..., C } , (10) τ j ← σ ( b j + X b U j l µ l + X i W j i x i ) ∀ j ∈ { 1 , ..., n } (11) we can reach a saddle point of the KL diver gence, where µ l serves as the estimate for p ( y l = 1 | x ) and τ j can be used to estimate p ( h j = 1 | x ) . 4. EXPERIMENT AL EV ALU A TION W e performed the experiments on two standard datasets viz. The Reference Energy Disaggregation Dataset (REDD) [20] and a subset of Dataport dataset [21] (also known as Pecan Street Dataset) av ailable in non-intrusiv e load monitoring toolkit (NILMTK) format [22] . The REDD dataset is a moderate size publicly av ailable dataset for electricity disaggreg ation. The dataset consists of power consumption signals from six different houses, where for each house, the whole electricity consumption, as well as electricity consumptions of about twenty dif ferent de vices are recorded at ev ery second. The Dataport dataset contains 1-minute circuit level and building le vel electricity data from 240 houses. It contains per minute readings from 18 different de vices: air condi- tioner , kitchen appliances, electric vehicle, and electric hot tub heater, electric water heating appliance, dishwasher , spin dryer , freezer , furnace, microwa ve, ov en, electric pool heater , refrigerator , sockets, electric stov e, waste disposal unit, secu- rity alarm and washer dryer . W e compare our results with multi-label classification al- gorithm proposed so far for NILM viz. ML-kNN, RakEl, and LC-DDL. Both the datasets were split into training, testing and cross-validation set in a ratio of 50:30:20 respectively . Cross-validation set was used to decide the values of hyper- parameters. W e hav e munged the data such that each sample contains per hour aggregated consumption and corresponding device labels. W e use PyT orch [23] for the network implementation. In the proposed multi-label classification RBM we use 60 sec- onds of aggregated load sampled at 1Hz as input to the model. For hidden unit follo wing sizes are tried 32 , 64 , 128 , and 256 , we find 128 to be best. The learning rate is set to 0 . 001 for all our experiments. W e use k = 2 steps of sampling in CD [11] algorithm to train our model. For inference, we apply sigmoid activ ation to the output of our model and threshold at 0 . 5 . Macro F1 and Micro F1 scores are the two metrics which are commonly used to ev aluate the performance of Multi- label classifiers. Appliance-le vel ener gy error is computed for each device to ev aluate disaggregation performance. Macro F1 score is average of individual F1 score of all the classes so it could be biased to wards a class with fe wer samples. The Micro F1 score indicates the ov erall performance of the clas- sifier . It is computed by stacking up samples from all the classes. The F1 score of an individual class is gi ven by (12), F 1 = 2 × T P 2 × T P + F N + F P (12) Where TP is the number of true positiv es, FN is the number of false neg ativ es and FP is the number of false positi ves. The appliance-lev el error also known as Normalized en- ergy error (NEE) is a standard metric which is used in almost ev ery prior study in this area and it is gi ven as (13), T able 1 . Appliance-Le vel Evaluation on REDD Device MLkNN RAkEL LC-DDL MLC-RBM F1-Score Error F1-Score Error F1-Score Error F1-Score Error Lighting 0.6476 0.3718 0.6760 0.8213 0.6216 0.2608 0.6947 0.1762 Kitchen 0.5081 0.4304 0.6108 0.6995 0.6411 0.3326 0.7213 0.1273 Refrigerator 0.5292 0.3628 0.6724 0.5132 0.6118 0.2528 0.7186 0.1644 W asher Dryer 0.3903 0.3122 0.5267 0.6990 0.4977 0.3149 0.6983 0.1963 T able 2 . Appliance-Le vel Evaluation on P ecan Street Device MLkNN RAkEL LC-DDL MLC-RBM F1-Score Error F1-Score Error F1-Score Error F1-Score Error Air Conditioner 0.6391 0.1720 0.6521 0.8565 0.5882 0.1051 0.7023 0.2334 Dishwasher 0.6546 0.1690 0.6728 0.8490 0.4871 0.1501 0.7269 0.1341 Furnace 0.6123 0.1341 0.6231 0.8415 0.5572 0.0794 0.7113 0.2224 Microw av e 0.5916 0.0727 0.6819 0.7301 0.5533 0.0795 0.6981 0.1985 T able 3 . Perf ormance Evaluation on REDD Method Macro F1-Scor e Micro F1-Scor e MLkNN 0.6086 0.6143 RAkEL 0.6290 0.6294 LC-DDL 0.5222 0.5262 MLC-RBM 0.7082 0.7157 N E E = P t | P n t − ˆ P n t | P t P n t (13) where P n t is the po wer consumption of the appliance n at an y time instant t . T able 1 and T able 2 present the F1-Score and correspond- ingly obtained disaggregation error for each target device in both the datasets. T able 3 and T able 4 contain micro and macro F1-Scores yielded by the state-of-the-art and proposed algorithm on the REDD and Pecan Street dataset respecti vely . Our proposed model yields the best results regarding classi- fication measures and gives comparable disaggreg ation accu- racy . Although best classification accuracy should reflect the least disaggregation error , here it is not so. This mismatch engenders an ambiguity in results. W e would like to clarify it with an example. Suppose true labels for two hours of aggregate consumption of four de vices are 1 0 0 1 and 0 1 1 0 whereas the predicted labels are 0 1 1 0 and 1 0 0 1 respecti vely . For the gi ven case F1-Score would be zero as all the identified states are wrong. For the same case, disaggregation accuracy would be 100 % as the number of identified activ e appliances exactly matches the number of true activ e appliances. This example explains why tech- niques, such as LC-DDL, gi ves the best disaggreg ation ac- T able 4 . Perf ormance Evaluation on P ecan Street Method Macro F1-Scor e Micro F1-Scor e MLkNN 0.6183 0.6194 RAkEL 0.5872 0.6019 LC-DDL 0.5214 0.5332 MLC-RBM 0.7080 0.7123 curacy but worst F1-Scores. Therefore in such a framew ork, the performance of an algorithm should be judged only after looking at both metrics collectiv ely . 5. CONCLUSION This work proposes a ne w technique for NILM framed as a multi-label classification problem. The proposed multi-label classification RBM has good reconstruction ability and when combined with multi-label supervision also provides good classification accuracy . This technique does not require any appliance-lev el data which makes the task completely non- intrusiv e. W e compare the proposed technique with all the prior works where NILM was transformed as a multi-label classification task. W e hav e performed an experimental e val- uation of the proposed work on two widely used datasets. Our proposed model yields the best results in term of clas- sification accuracy and comparable results regarding energy disaggregation. Although we ha ve used multi-label RBM for NILM, it is a generic approach and can be used for solving any multi-label classification problem. In the future, we plan to benchmark it against existing algorithms on established multi-label classification datasets. 6. REFERENCES [1] United States Ener gy Information Administration, “United states energy use, ” 2017. [2] D. Archer , Global warming: understanding the for e- cast , John W iley & Sons, 2012. [3] S. Darby et al., “The effecti veness of feedback on en- ergy consumption, ” 2006, vol. 486. [4] S.M. T abatabaei, S. Dick, and W . Xu, “T o ward non- intrusiv e load monitoring via multi-label classification, ” 2017, vol. 8, pp. 26–40. [5] D. Li and S. Dick, “Whole-house non-intrusive ap- pliance load monitoring via multi-label classification, ” in International Joint Conference on Neural Networks , 2016, pp. 2749–2755. [6] V . Singhal, J. Maggu, and A. Majumdar , “Simultane- ous detection of multiple appliances from smart-meter measurements via multi-label consistent deep dictionary learning and deep transform learning, ” 2018. [7] H. Larochelle and Y . Bengio, “Classification using dis- criminativ e restricted boltzmann machines, ” in Pr oceed- ings of the 25th International Conference on Machine Learning , 2008, pp. 536–543. [8] P . Smolensky , P arallel Distributed Pr ocessing: Explo- rations in the Micr ostructur e of Cognition , 1986. [9] G.W . Hart, “Nonintrusiv e appliance load monitoring, ” 1992, vol. 80, pp. 1870–1891. [10] H. Kim, M. Marwah, M. Arlitt, G. L yon, and J. Han, “Unsupervised disaggreg ation of lo w frequency power measurements, ” in Pr oceedings of the 2011 SIAM Inter - national Confer ence on Data Mining , pp. 747–758. [11] G.E. Hinton, “T raining products of experts by minimiz- ing contrastiv e div ergence, ” August 2002, v ol. 14, pp. 1771–1800. [12] H. Larochelle, M. Mandel, R. Pascanu, and Y . Ben- gio, “Learning algorithms for the classification re- stricted boltzmann machine, ” March 2012, vol. 13, pp. 643–669. [13] B. Marlin, K. Swersky , B. Chen, and N. Freitas, “In- ductiv e principles for restricted boltzmann machine learning, ” in Pr oceedings of the Thirteenth Interna- tional Confer ence on Artificial Intelligence and Statis- tics , 2010, vol. 9, pp. 509–516. [14] G.E. Hinton and R. Salakhutdinov , “Reducing the di- mensionality of data with neural networks, ” 2006, vol. 313, pp. 504–507, American Association for the Ad- vancement of Science. [15] R. Salakhutdinov , A. Mnih, and G. Hinton, “Restricted boltzmann machines for collaborati ve filtering, ” in Pro- ceedings of the 24th International Confer ence on Ma- chine Learning , 2007, pp. 791–798. [16] U. Fiore, F . Palmieri, A. Castiglione, and A.D. Santis, “Network anomaly detection with the restricted boltz- mann machine, ” 2013, vol. 122, pp. 13–23. [17] A. Coates, A.Y . Ng, and H. Lee, “ An analysis of single- layer networks in unsupervised feature learning, ” in Pr oceedings of the F ourteenth International Confer ence on Artificial Intelligence and Statistics , 2011, vol. 15, pp. 215–223. [18] X. Li, F . Zhao, and Y . Guo, “Conditional restricted boltzmann machines for multi-label learning with in- complete labels, ” in AIST ATS , 2015. [19] S. V erma, P . Patel, and A. Majumdar , “Collaborati ve filtering with label consistent restricted boltzmann ma- chine, ” in Ninth International Confer ence on Advances in P attern Recognition , Dec. 2017. [20] J.Z. K olter and M.J. Johnson, “Redd: A public data set for ener gy disaggregation research, ” in W orkshop on Data Mining Applications in Sustainability (SIGKDD) , 2011, vol. 25, pp. 59–62. [21] Dataport, “Pecan street dataset, ” 2014. [22] N. Batra, J. K elly , O. Parson, H. Dutta, W . Knottenbelt, A. Rogers, A. Singh, and M. Sriv astav a, “Nilmtk: an open source toolkit for non-intrusiv e load monitoring, ” in Pr oceedings of the 5th international confer ence on Futur e ener gy systems , 2014, pp. 265–276. [23] A. Paszk e, S. Gross, S. Chintala, G. Chanan, E. Y ang, Z. DeV ito, Z. Lin, A. Desmaison, L. Antiga, and A. Lerer , “ Automatic dif ferentiation in pytorch, ” 2017.
Original Paper
Loading high-quality paper...
Comments & Academic Discussion
Loading comments...
Leave a Comment