Geovisual Analytics and Interactive Machine Learning for Situational Awareness
The first responder community has traditionally relied on calls from the public, officially-provided geographic information and maps for coordinating actions on the ground. The ubiquity of social media platforms created an opportunity for near real-time sensing of the situation (e.g. unfolding weather events or crises) through volunteered geographic information. In this article, we provide an overview of the design process and features of the Social Media Analytics Reporting Toolkit (SMART), a visual analytics platform developed at Purdue University for providing first responders with real-time situational awareness. We attribute its successful adoption by many first responders to its user-centered design, interactive (geo)visualizations and interactive machine learning, giving users control over analysis.
💡 Research Summary
The paper presents SMART (Social Media Analytics Reporting Toolkit), a web‑based visual analytics platform designed to give first‑responders real‑time situational awareness by harvesting volunteered geographic information (VGI) from social media, primarily Twitter. Traditional emergency response relies on phone calls, official maps, and static geographic data, which often lag behind unfolding events. Social media, by contrast, provides a continuous stream of user‑generated text and metadata that can be mined for early indicators of weather events, traffic congestion, injuries, or other emergent conditions.
SMART’s architecture consists of a data ingestion pipeline, preprocessing and filtering modules, topic modeling and spatial analysis components, and an interactive visualization dashboard coupled with a human‑in‑the‑loop machine‑learning engine. Tweets are collected via the Twitter Streaming API, filtered by user‑specified inclusion/exclusion keywords, and then subjected to natural‑language processing (NLP) techniques such as keyword extraction, topic modeling (e.g., LDA), and word‑cloud generation. Spatial metadata (geotags, inferred locations) are stored in a “geomessage table” that links each tweet to a geographic point, enabling map‑based visualizations.
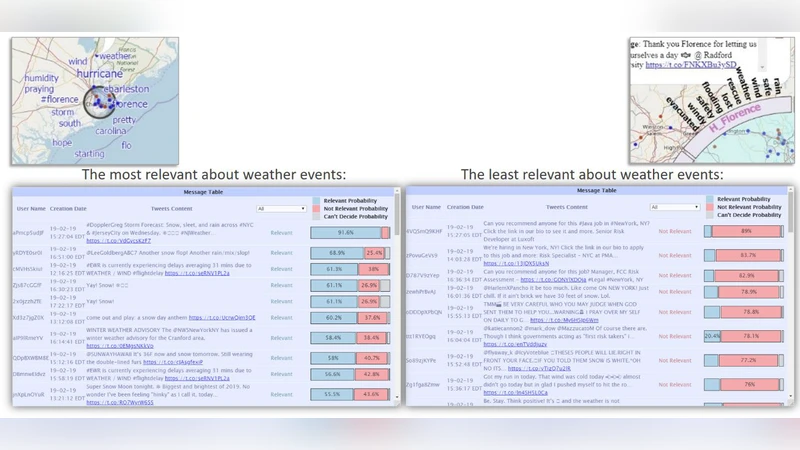
The dashboard presents multiple coordinated views: a map with dynamic point clusters, a ThemeRiver showing temporal topic evolution, spatial topic heatmaps, and traditional word‑clouds. Users can drill down by time, region, or topic, and can directly interact with map points to view the original tweet content. The key innovation is the interactive machine‑learning module: users label a small set of tweets as “relevant” or “irrelevant” to a particular incident (e.g., a wildfire). These labels immediately retrain a shallow neural network, which re‑ranks the tweet stream and improves relevance filtering. Empirical results show that with fewer than 20 clicks (≈50 labeled tweets) the system reaches >50 % classification accuracy, and after about 200 user‑provided labels accuracy climbs to ~80 %. This rapid learning demonstrates that minimal human effort can substantially suppress noise inherent in social‑media streams.
SMART was developed using a user‑centered design (UCD) process: continuous stakeholder engagement, requirement analysis, demos, interviews, agile sprints, and iterative refinements based on field feedback. The target audience—first‑responders without computational expertise—benefits from intuitive controls, customizable filters, and visualizations that require no programming knowledge.
Real‑world deployments illustrate the platform’s impact. The U.S. Coast Guard employed SMART during the 2017 Hurricane season to locate distressed individuals and coordinate rescue operations. University campuses, local emergency management agencies, non‑governmental organizations, and state‑level event organizers (e.g., the 2018–2019 State of the Union Addresses in Washington, D.C.) have used SMART for crowd monitoring, incident detection, and post‑event analysis. In each case, Purdue researchers conducted a one‑hour web‑seminar for prospective users, collected post‑deployment feedback, and implemented rapid modifications, leading to sustained adoption across roughly 20 organizations.
Privacy considerations are addressed by allowing users to provide only approximate geolocations rather than precise coordinates, thereby balancing situational awareness with individual privacy. The authors acknowledge that many responders are hesitant to share exact locations, and they propose future work on anonymization techniques and ethical guidelines for data use.
Future research directions include: (1) integrating additional social platforms (Instagram, Facebook, etc.) to broaden data coverage; (2) incorporating advanced anomaly‑detection algorithms (spatio‑temporal outlier detection, graph‑based methods) to flag unusual patterns automatically; (3) enhancing the explainability of the machine‑learning component to build trust among users; and (4) formalizing privacy‑preserving mechanisms and ethical frameworks to ensure responsible deployment.
In summary, SMART demonstrates that coupling interactive visual analytics with human‑in‑the‑loop machine learning can transform noisy, high‑velocity social‑media streams into actionable intelligence for emergency responders. Its success underscores the importance of user‑centered design, rapid iterative development, and seamless integration of geographic, temporal, and semantic dimensions, offering a scalable blueprint for future GIS‑social‑media fusion systems.
Comments & Academic Discussion
Loading comments...
Leave a Comment