Suburban Fixed Wireless Access Channel Measurements and Models at 28 GHz for 90% Outdoor Coverage
Achieving adequate coverage with high gain antennas is key to realizing the full promise of the wide bandwidth available at cm/mm bands. We report extensive outdoor measurements at 28 GHz in suburban residential areas in New Jersey and Chile, with ov…
Authors: Jinfeng Du, Dmitry Chizhik, Rodolfo Feick
of an azimuth ally omnidir ectional antenna:
, 1 2 π Z 2 π 0 P ( φ ) dφ =
. (1) 10 20 30 40 50 60 70 80 90 100 Distance [m] -120 -115 -110 -105 -100 -95 -90 -85 -80 Path gain [dB] 2-ray model Open field measuements Free space Figure 3. LOS path gain measurement (black circle ) is in reasonabl e correspond ence to the 2-ray model (solid line), where observe d peak power amounts up to 6 dB abov e free space (dott ed line ). The 10 ◦ Rx horn was on v an mast 3 m abov e ground and the 55 ◦ Tx horn 1 m abo ve ground. This remains so desp ite th e beam overlap betwe e n succ essi ve azimuthal aimin g of the rotating horn an te n na [ 3]. Path gain P G is ca lculated by av eragin g the received power over all azimutha l angles. By removing the transmitted power P T , the transmit antenna gain G T , and the elev ation gain G elev , we o btain P G =
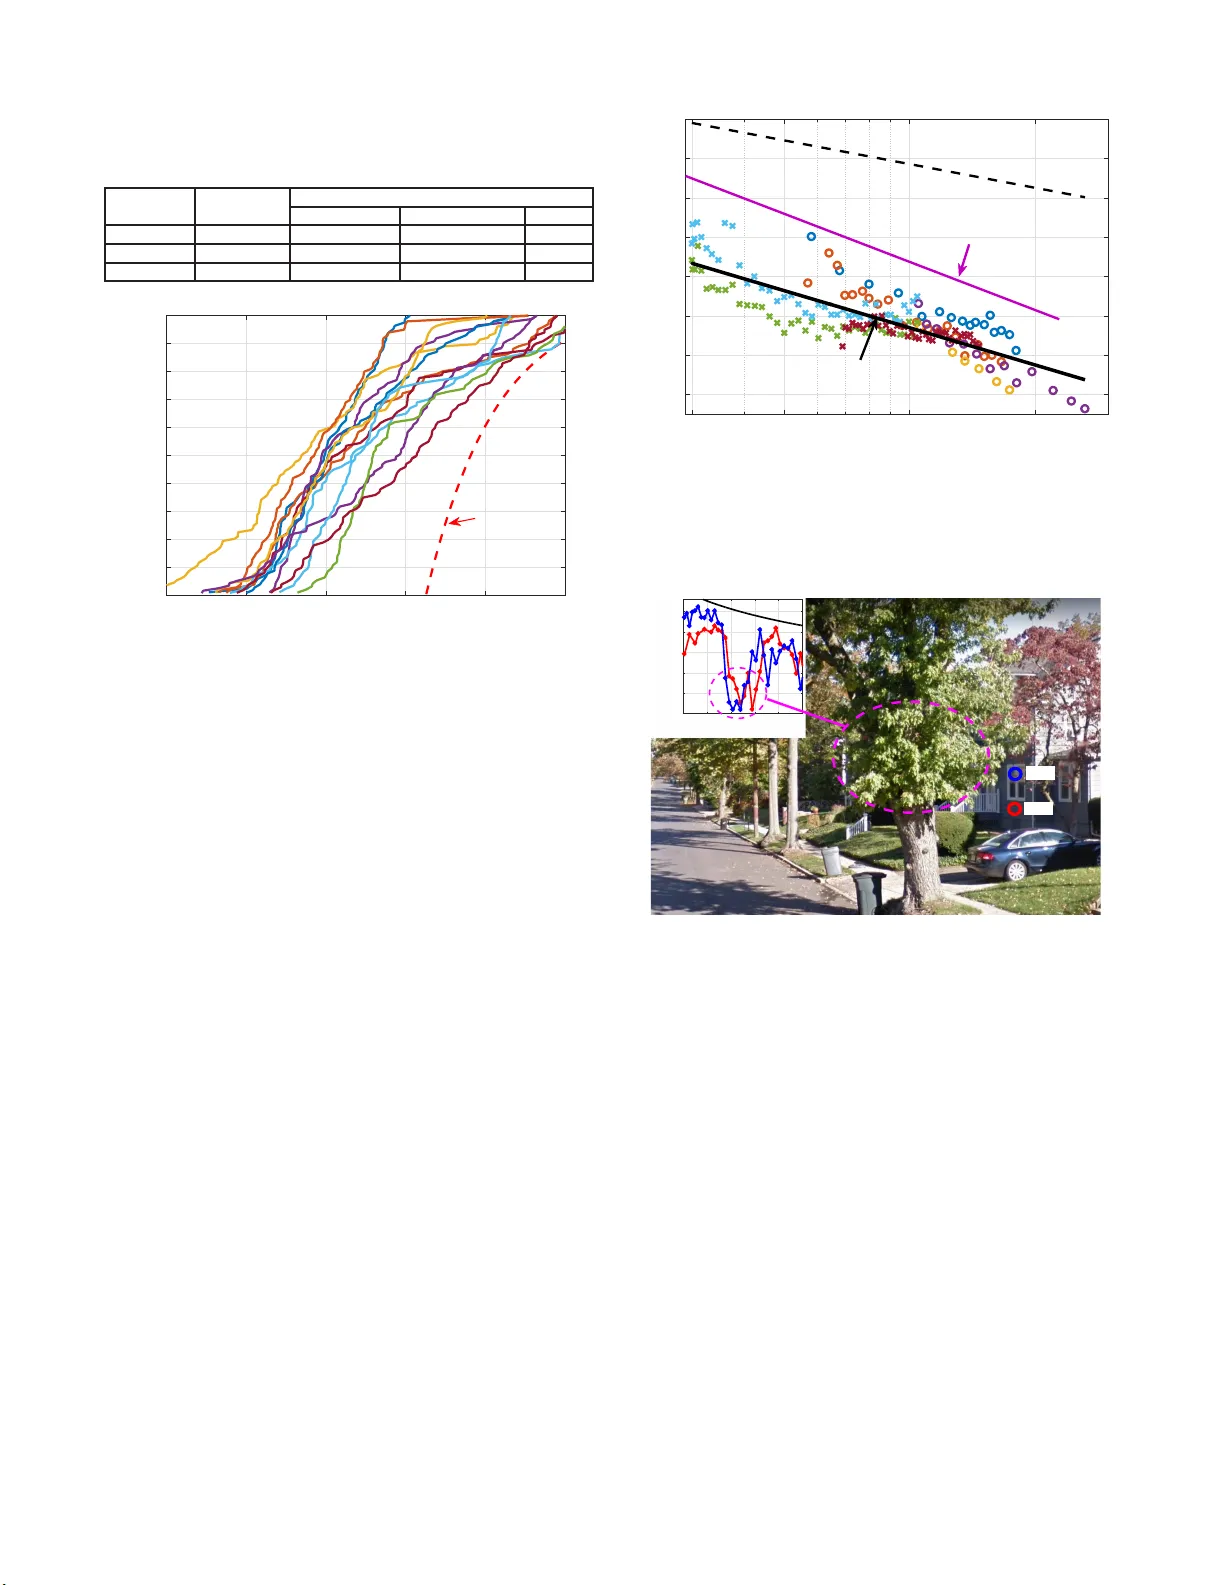
− P T − G T − G elev , [ dB ] . (2) The e lev atio n gain is obtained fro m th e total antenna g ain G tot (as m easured in the anecho ic chamber) : G elev = G tot − G azim , [ dB ] , (3) where th e nominal azimu thal antenna gain is given by the peak-to- av erage ratio of the antenn a pattern G ( φ ) , i.e., G azim = max ( G ( φ )) − , [ dB ] . (5) Note that the transmit antenn a g ain 1 G T and the r e ceiv e antenna elev atio n gain 2 G elev have been removed fr o m the azimuthally averaged received p ower . Therefor e , the path gain obtained using (2) is compatib le with 3 G PP models [16] establishe d for omni- directional Tx and Rx an te n nas. I I I . P A T H G A I N M E A S U R E M E N T S A N D M O D E L S F O R S U B U R B A N S T R E E T C A N Y O N A. Outdo or-outdoor LOS with gr ou nd r eflection An outdoo r LOS calibration was c a r ried out in an ope n field where th e 1 0 ◦ Rx h orn was on the van mast 3 m ab ove 1 Nominal Tx antenna gain was used in path gain calcul ation since it was observe d that the ef fecti ve gain of the Tx antenn a is ve ry close to its nominal due to its wide beamwidt h (55 ◦ ) and the relati vel y small angula r spread. 2 The lo w vertic al angle spread [8 ], [16] means that the nominal ele vation gain of the Rx anten na would be very close to its nominal val ue. 4 groun d an d the 55 ◦ Tx horn was 1 m above g roun d . For this measuremen t the antennas were aimed at each other, i.e. no azimuth rotatio n was used. The me asured path g ain is shown in Fig. 3 tog ether with a m odel from 2-r ay theory which inclu des the actual vertical misalignment of 2 m and ground reflectivity , which is co mputed as a reflection co efficient fr om a half- space with d ielectric constant o f 5 an d loss tangent of 0.1. The data exhibits constructive and destructive sup erposition in agreemen t with theor y , with peaks abo ut 6 dB ab ove fr ee space, and nu lls that are more than 15 dB deep. Both obser ved and m odeled path g ains for d istances sh orter than 30 m are lower than free space caused by vertical misalignme n t, where links th at are 20 m or sh o rter will be o u t o f the 1 0 ◦ receive beam in elevation p lane. B. Same- str eet outdoo r-outdoor with ve getation Same-street ou tdoor-outdoo r m easuremen ts wer e done with the rotary Rx m oving alon g th e street and the Tx placed near the exterio r o f a street-facing window . The Tx was aimed at a fixed an gle along th e street to illuminate the entire Rx route as previously d e scr ibed in Sec. I I -B. P ath g ain fo r each measured link is compu ted by averaging power over all angu lar d irections to estimate the loca l av erage power as would be obtain ed fro m a spatial average of omn i- antenna measuremen ts. Measured same-street path gain as a function of distance d [m], sh own in Fig. 4 (upp er), was f o und to be well rep resented by the power law . The slop e-intercep t fit with 90% co nfidence inte r vals [2 2] is given b y P same-street = A + 1 0 n log 10 ( d ) + N (0 , σ ) , [ dB ] , (6) A = − 4 5 . 1 ± 1 . 4 , n = − 4 . 0 6 ± 0 . 08 , σ =6 . 4 , where d is the Euclid ean distance in meters b etween base and user termin a l, A is the 1-m intercept, n is the slope of distance (in dB scale), and σ is the RMS deviation repr esenting shad ow fading. As com p ared to free space, it has a 25 dB excess loss at 100 m. Note th at a significant data set facilitates reliab le characterizatio n of path gain models. With over 1 700 links, the 90% co nfidence intervals are very tight as shown in ( 6). A model derived from d iffuse theory [1 5], super imposed on Fig. 4 (upp e r ), h a d a slope of 4.0 and RMS err or of 6 . 8 dB, compara b le to the line-fit pred ictions, which is n otable for a theory unadju sted to data and giv en the fact that the impact of vegetation blocka g e loss was here accounted for by mo deling the layer of non-con tiguous vegetation as a contig u ous diffuse media. W e note that the slop e o f 4.06 obtain ed fr om slop e- intercept fit is very close to th e slope pr edicted by th e m odel derived from diffuse theo ry . Th e 3GPP 38 . 901 [ 1 6] urban micro street- c anyon NLOS model (in dicated by the solid blu e line in Fig. 4), which is inten ded to use for NLOS pr opagatio n in u rban streets, had an error of 6.6 d B, com parable to the 6.4 dB RMS de viation fr o m the linear fit to data. It sho uld be no ted, howe ver , th e 38. 9 01 model prescrib es the use o f LOS and NLOS formu las, based on specified Probability of Line of Sigh t, th a t is set to 1 for ranges under 18 m and decreases to 0. 5 at 50 m and 0.2 5 at 100 m . In LOS, the p ath gain is specified as being close to free space. Over 90% of measuremen ts in Fig. 4 (up per) h ad excess losses r elativ e to 10 20 50 100 200 Distance [m] -150 -140 -130 -120 -110 -100 -90 -80 Path Gain [dB] Free space 3GPP 38.901 uMi street canyon NLOS slope -3.5, rms=6.6 dB Slope-intercept fit, slope -4.1 intercept -45.1 dB, rms=6.4 dB Diffuse theory (for d>20m) rms=6.8 dB 10 20 50 100 200 Distance [m] -140 -130 -120 -110 -100 -90 -80 Path Gain [dB] Free space NJ line fit, slope -3.9 intercept -48.6 dB, rms=7.4 dB Chile line fit, slope -4.4 intercept -37.8 dB, rms=7.2 dB Figure 4. (Upper) Measured path gain for over 1700 links ranging up to 200 meters along each street (dif fers in color) in NJ (1322 links, marker o) and Chile (442 links, marke r x) resulted in a slope of -4.06, intercept of -45.1 dB, and RMS devia tion of 6.4 dB; (Lower) Comparing the Chile dataset against the NJ slope-inte rcept fit resulte d in less than 0.3 dB increa se of RMS error (7.2 dB RMS of Chile dataset against its o wn fit). free space of over 10 dB, even at ran ges of 50 m, despite being on the same street. Measured path g ain d a ta sets fro m NJ and from Chile have similar line fits and spread. Comparing the Chile dataset against the NJ slop e-intercep t fit, as sh own in Fig. 4 (lower), resulted in less than 0.3 d B in crease of the RMS erro r ( as compare d to the 7.2 dB RMS deriv ation f rom its own line fit). Linear regression r esults of the measured path gain for the two d a tasets and their c ombinatio n are summarized in T able I. Applying the Common- Slope Cr o ss-Comparison metho d [1 7] to the two datasets r esulted in a common slop e of 4. 0 5 and a 1 dB gap between the two in tercepts with combined RMS fitting erro r of 6.4 dB. Th erefor e , we can conclude th at the empirical mo del pr esented in (6) is r o bust. The measured p ath gain distributions for rang es of 20 m to 200 m are plotted sep arately f or ea c h street in Fig. 5 . I t m ay be observed that distributions v ary substantially , with medians spanning a rang e o f 13 dB. This illustrates the im portance of collecting sufficient data over mu ltiple streets an d hou ses to get rep resentative path lo ss. Mo deling one street based on a 5 T able I S U M M A RY O F S A M E - S T R E E T PAT H G A I N M E A S U R E M E N T S A N D M O D E L S W I T H 9 0 % C O N F I D E N C E I N T E RVAL [ 2 2 ] . Number of Path Gain links slope interc ept RMS NJ 13 22 -3.87 ± 0.09 -48.6 ± 1.6 dB 6.0 dB Chile 442 -4.44 ± 0.16 -37.8 ± 2.8 dB 7.2 dB Combined 1764 -4.06 ± 0.08 -45.1 ± 1.4 dB 6.4 dB -140 -130 -120 -110 -100 -90 Path gain [dB] 0 0.1 0.2 0.3 0.4 0.5 0.6 0.7 0.8 0.9 1 CDF Free space Figure 5. Distrib utions of measured path gain for each street separat e l y : streets are quite differe nt from each othe r , with medians spanning a range o f 13 dB. Path gain for free space is plotted as reference (red dashed line). data fit to data collected on anothe r street may lead to so m e 13 d B (m edian) err or in coverage. C. Other-str eet outd oor-outdoor mea su r eme nt T o quan tify coverage f rom lamp post-mo u nted base statio n s to termina ls lo cated in a different street and to assess interf e r - ence between ne ighbor ing streets, we collected data f or o v e r 180 “o ther-street” links wh ere the user termin al was plac e d at a ho use of one street, and th e base moved along a p arallel street separ ated by on e block of 30 to 80 m wid th . The r otary Rx was moving along th e parallel street, gatherin g p ower measuremen ts fro m azimuthal scan s, and the Tx antenna was aimed a t a fixed an gle towards the Rx to illuminate its entire route. Measured other-street path gain , shown in Fig. 6, was found to be well repr e sented by P other-street = A + 10 n log 10 ( d ) + N (0 , σ ) , [ dB ] , (7) A = − 80 . 3 ± 4 . 1 , n = − 3 . 1 3 ± 0 . 21 , σ =4 . 8 . As co mpared to free space, it ha s a 42 dB excess lo ss at 100 m, in co ntrast to the 25 dB excess loss in the same-street model. Coverage fro m under-clutter base station s located in other streets is thus very limited, and the potential in terference from o ther-street b ase stations is likewis e mild, since th e latter is ty pically 10 to 17 dB lower than the same -street signal e ven if the two links h ave the same distance. W e note that using the same-street model (6), to rep resent other-street da ta , resulted in RMS error o f 18.3 d B, justifyin g the u se of a separate model (7) for o ther-street lin k s (for example, to assess interfe rence or the viability of coverage fro m b ase stations o n p arallel streets). 30 50 100 200 300 Distance [m] -160 -150 -140 -130 -120 -110 -100 -90 Path Gain [dB] Free space Other-street line fit, slope -3.1 intercept -80.3 dB, rms=4.8 dB Same-street line fit, slope -4.1 intercept -45.1 dB, rms=18.3 dB Figure 6. Mea sured path gain for over 180 other-stre et links along each s treet (dif fers in colo r) resulted in a slope of -3.13, interce pt of -80.3 dB, and RMS error of 4.8 dB. As compared to free space, it has a 42 dB excess loss at 100 m. Us ing the same-street model of (6) to represent other-stre et data resulted i n R M S e r r o r o f 1 8 . 3 d B . 15 20 25 30 35 40 Distance [m] -115 -110 -105 -100 -95 -90 Path Gain [dB] Free space TX 1 TX 2 TX 1 TX 2 Figure 7. Empirical observ ation of (partial) tree blockage from two differe nt Tx antenna heights (TX1 at 3 m and TX2 at 1.5 m). The shortest distance from the rotating Rx to the branches/lea ves is about 2 m during the measurement. D. Outdoo r-outdoor visual LOS lin ks Scatterers/obstruc tio ns such a s tree branches/leaves may partially block the direct path between the Tx and Rx e ven for same-street outdo or-outdoor measure ments d escribed in Sec. III-B. For links ranging from 30 m to 100 m, the maximum radius o f the first Fresnel zone [18] is several tens of centimeters at 28 GHz. This may leav e ample opp ortunity for th e d irect pa th to survive, but par tial b lo ckage within the first radio Fresnel zo ne can p otentially ca u se significant power dr op ev en in the presence o f a visual LOS pa th. W e labeled these links that hav e a visual LOS path, determined by using a flashlig ht at the one end o f the links and ob served at the othe r end , as visual LOS. W e plotted in Fig. 7 some empirical observations o f the effect of (par tial) blockage by tree br anches. As th e Rx m oves away from the Tx, the link changes from LOS to NLOS and then back to LOS. Partial blockag e was o b served to result in 5 to 10 d B losses over free space p ropaga tio n. In contrast u nder total blockag e, more than 20 d B excess lo ss was observed. 6 20 30 40 50 60 70 80 Distance [m] -120 -115 -110 -105 -100 -95 -90 -85 -80 Path Gain [dB] Line fit, slope -2.4 intercept Friis@1m, rms=4.2 dB Free space Figure 8. Measured path gain of visual LOS links (streets labeled by color). Obstructi on within the first Fresnel zone significantly degrade s the link quality . Characterizing the path gain of visual LOS link s would al- low th e perfo r mance e valuation of the FW A d e p loyment under what would be expected to b e mo re fav o rable co ndition. Data of visual LOS links are obtained from same-street outdoor- outdoo r measurem ents described in Sec. I II-B wh ere the Tx is placed eithe r at 1 m or 3 m h eight on the street-facing exterior wall, an d the base (Rx) is moving along the stre e t to co llect measuremen ts. W e plo tted their path gain versus d istance for these loc ations in Fig. 8. Using linea r regression with fixed intercept of Friis p a th gain at 1 m (i.e., -61.4 dB at 2 8 GHz), the v isual LOS path gain dep endenc e on distance d was f ound to be well repr e sented by P visual-LOS = − 61 . 4 + 10 n lo g 10 ( d ) + N (0 , σ ) , [ dB ] , (8) n = − 2 . 44 ± 0 . 21 , σ = 4 . 2 . Here free space 1 - m intercept is adop ted b ecause our dataset is n ow limited to the p oints clo sest to that co n dition. Opti- mization o f b oth the intercep t an d slope resulted in no more than a 0. 2 dB redu ction in the RMS erro r . As compare d to free space, th e measured excess loss can be up to 15 d B for links at various distances as shown in Fig. 8. The visual LOS condition thu s does not im ply free space pr opagatio n loss. I V . A Z I M U T H G A I N M E A S U R E M E N T S Nominal anten na gain can be degraded as a result of sig- nificant angu lar sp read compared to beamwid th in scattering en viron ments [2], and a large gain reduction can sign ificantly degrade the perfo r mance o f m mW ave system s [19]. T o reliably quantify th is effect, we measured the power as a function of azimuth as the Rx antenna was spinnin g. For e very Tx- Rx pair the effective azimu th g ain was computed as the r atio o f the maximu m power to the av erage over all direction s using (5), as justified in [3] under the assump tion of un c orrelated scattering. This allows us to directly q u antify the effecti ve beamfor ming (BF) gain, in contrast to the indir ect app r oach adopted by [2] wh ere an estimated chan nel power angular distribution was used to deduce the BF gain reduc tio n. Th e 6 7 8 9 10 11 12 13 14 15 Effective azimuth BF gain [dBi] 0 0.1 0.2 0.3 0.4 0.5 0.6 0.7 0.8 0.9 1 CDF 6.5 dB loss 4.3 dB loss In street At house Figure 9. CDFs of effe cti ve azimuth gain of the rotary horn ante nna, where the degradat ion is 4.3 dB at 10 th percent ile when place d in streets (as base station ) and 6.5 dB at houses (as CPE). Log-normal fits (thin lines) hav e mean of 12.4 dB and 9.5 dB, respec ti vely , with a standard devi ation of 1.5 dB. resulting distribution o f azimuth gains is shown in Fig. 9. The azimuth gain exceed ed in 90% of cases at the 3 m base station in the street is found to be 10.2 dBi, as opposed to the nomin al gain of 14 . 5 dBi in azimuth, i.e., a 4.3 dB g ain red uction. T o in vestigate the possible benefits of using a more directi ve antenna at the custome r’ s premises, we p laced the r otary hor n near the house wall (in prox imity o f vegetation), and obtain ed an azimuth g ain of 8 dBi at the 10 th percentile, a 6.5 d B g ain reduction (leftmost curve in Fig. 9). Th e o bserved effectiv e azimuth g a ins replace the nom in al antenn a gain in link budget calculations. W e found that the ef fective gain d istribution for the base station varies mildly f r om street to street, with medians r anging from 1 1.2 to 14 dBi, an d n o clear distinction has b een observed between same-street and other-street measurem ents. Log-n o rmal fits (thin lines) to th e empirical CDFs of effectiv e azimuth gain “in street” and “at the house” have means of 12.4 dB and 9.5 dB, respectively , with standard deviation of 1.5 dB. Using a mo re advanced b ase anten na of the same apertu re ( e.g. co mbining multiple beam s), which requires channel in f ormation and additional RF chains, may brin g additional gain, upp er-bounded by 4.3 dB in 90% of locations in this environment. V . P O T E N T I A L G A I N O F B E A M R E - A I M I N A Z I M U T H T emp oral variation of rec e i ved power along azim uth direc- tions, mainly c a used by wind -blown branches/leaves, co uld potentially degrade th e quality of serv ice for FW A users even if neither en d moves. T o q uantify the poten tial gain of chang in g beam dir ections to compensate fo r such temporal fades, we have extracted at each link the power samples along a direction that provide s the best-on -average power over tim e, referr ed a s the b est (a posterio ri) angle. For each lin k, this results in n o less th an 37 p ower measuremen ts in a fixed d irection over a time wind ow o f 10 second s. Such temporal fades along a fixed d irection h av e been foun d to be we ll repre sented by Rician distributions for FW A lin k s in suburban [ 24] an d in open spaces with tree blockag e [25] 7 -4 -3 -2 -1 0 1 2 3 4 Normalized power of samples [dB] 0 0.1 0.2 0.3 0.4 0.5 0.6 0.7 0.8 0.9 1 CDF -1 0 1 Frequency [Hz] -20 -10 0 Power [dB] Doppler 90% confidence interval Measurement 151 samples K=11.9 dB Simulation 151 samples K=11.9 dB Simulation 10000 samples K=11.9 dB Figure 10. CDF of temporal power va riation along the best angle for a FW A link measured in NJ. Insert is the estimate d Doppler spectrum obtai ned follo wing the m ethod de vel oped in [31]. CDFs of simulated Rician samples with the same K -fact or are also plotte d for reference. All three CDFs match well with one another and the varia tions are small as compared to the 90% confidenc e interv al [27] of the measured data. at lower frequ ency ban ds (1.8 to 1.9 GHz). T emp oral fades measured in a street canyon at 60 GHz [ 28] also reported good agreemen t in CDF with the Rician mod el, but the ag reement in level crossing rate is less satisfactory for data collected using a moving term inal. On the other han d, sparse mu ltipath mobile chan nels, a s may occ u r a t mmW ave freq uencies, h av e exhibited non -Rician b ehavior [29], [32], a n d small-scale spatial fading may be better r epresented by the two-wa ve with diffuse power (TWDP) fadin g model 3 [33], [ 3 4]. W e tested the d istribution of tempo ral fades measur e d at 2 8 GHz fo r a FW A link a n d com p ared its CDF to those o btained using simulated samples from a Rician d istribution with the same K -factor as estimated using the metho d of mom ents (MoM) [ 23]–[25]. As shown in Fig. 10, the temp o ral fades along the best (a po steriori) angle were well rep resented b y a Rician distribution. W e also computed the Dopp ler spectrum of the link , shown as an in sert o f Fig. 10, following the meth od developed in [3 1]. The Doppler spec tr um was fou nd to be peaked at 0 Hz with expo nential de cay , and the spe ctral density falls by 13 dB between 0 an d 0.3 Hz. Th is is consistent with the theoretical model [30] developed fo r movin g scatterers and the em pirical o bservation of Rician tempora l fades induced by wind-blown le aves [3 1] for fixed wireless links at 5.3 GHz. Giv en the observed Rician behavior , we computed the temporal K -factors o f the o bserved signal env elopes fo r each street, as shown in Fig. 11, wh ere the median value o f each street ran ges from -2 to 24 d B. Th e ensemble of tem poral K - factors f or all th e same-street link s is well re presented b y a log-no rmal distribution, c o nsistent with the findin gs reported in [24], [25], with mean 16.7 dB a nd standard deviation 8 .9 dB. The same-street link s in general have high er K -factors (median 1 6 dB) than other-street link s (m edian 2.5 dB). This can be explained by the fact that there are more vegetation and 3 TWDF and its extensi ons, such as [33], [34], degenera te to Rician when the number of specular rays is reduce d from two to one. -10 0 10 20 30 40 Temporal K-factor of power along the best angle [dB] 0 0.2 0.4 0.6 0.8 1 CDF Other street Same street Figure 11. CDFs of temporal K -fac tor along the best (a posteriori ) angle for each link m easured in NJ, with median v alues range from -2 to 24 dB. Solid lines are same-stree t links (median 16 dB) and dashed lines are for other -street (median 2.5 dB). The ensemble of tempora l K -fac tor for all the same-street links is well represented by a log-norma l distribu tion with mean 16.7 dB and standard de viation 8.9 dB. 0 1 2 3 4 5 6 7 8 9 10 Power change among consecutive turns [dB] 0 0.1 0.3 0.5 0.7 0.9 1 CDF Instantaneous best direction Best-on-average direction Same street Other street Figure 12. CDFs of po wer change among consecuti ve turns for the instanta - neous best direction of each turn (blue dashed lines) and for po wer along the best-on-a verage direction (red lines) for eac h link. For more than 90% of all same-street links, po wer fluctua tion is less than 3 dB. houses b etween th e Tx and Rx for oth er-street links. Movin g vehicles may also contribute to th e lower K -factors observed for other-street link s: there may h av e been moving vehicles in the streets wher e the CPE was located when the b ase station was co llecting p ower measuremen ts in an other street with out traffic. In contrast, same-street measure ments were collected during intervals w h ere no moving vehicles were ob served. For the angu lar spectrum measur e d at each link, we ch oose the high est p ower dir e ction for each turn , referred as instanta- neous b e st direction. This creates a sequence of instantan eous best directions over time, relev an t when the azimuthal scan measuremen t is fast eno u gh to assure best-aim is maintain e d over time. In Fig. 12 we plot the CDFs of p ower cha n ge between consecu ti ve turns for the instantan eous best d irection of each turn and for power along the best-on-average (a posterior) dir ection fo r each link. As seen, for same-street links th e fluctuation of the best p er-rotation power sample and the sample fo r the best-on-average angle is very small. 8 This suggest that beamswitch in g will offer very mode st g ains. More th an 90% of all same-street lin k s experienc e d less than 3 dB power fluctuation between consecutive turns (ab out 200 ms) and th e corr espondin g beamswitch ing gain is less tha n 1 dB. Howev er, power fluctu ation is more severe for other-street links, clo se to 8 dB at the 9 0th per centile along the be st angle, with a p otential beamswitch ing gain of 3 dB. V I . E S T I M AT E S O F AC H I E V A B L E O U T D O O R - T O - O U T D O O R D O W N L I N K R AT E S F O R 9 0 % C OV E R A G E T o ev aluate the edge rate for 90% coverage based on the findings re ported a bove, we compu ted the Sh annon rate for outdoo r CPEs that will be available to 90% of users at a g i ven range. Equ iv alen tly , we determined th e SNR exceeded f o r 90% of CPEs at this r a n ge, denote d as γ 90% ( d ) , and from it the correspo n ding Sh annon r ate R 90% ( d ) = W log 2 (1 + γ 90% ( d )) , (9) where W is the ban d width. The lamp post mo unted base station is assumed to h av e 51 dBm EI RP and ban d width of 80 0 MHz 4 , and the ou tdoor CPE has 9 dB noise figure and 1 1 d Bi anten na gain. A cellular small cell op erating at 2 GHz b and (u sing 30 dBm transmit power and 5 dBi antenna gain fo r b oth the base station and th e UE) is presented as a baseline fo r comparison . Ke y parame ters used for r ate calculation for the 28 GHz system as well as the 2 GHz system ar e listed in T able II. Both transmitter and r eceiver are here assum e d to be equippe d with a single RF chain an d use simple direction al antennas, pointed ad a ptiv ely so as to ge t max imum power . Giv en th e modest degrada tio n o f a z imuth gain and m o dest temporal variations fou n d in this cam paign, such a simp le system is seen here as a reasonable referen ce. For each link, the path g a in was generated fro m a random pro cess as described by either (6) or (7) fo r same- street a n d other-street scenarios, respectively , an d th e effecti ve azimuth gain was generated using the log-n o rmal fits from Sec. IV. The pa th loss and angu lar spr ead for the 2 GHz system ar e generated using 3 GPP 36.8 14 UMi NL O S models spec ified in [20]. Channel dynamics caused by wind-blown leaves/branches was no t included in the calcula tio n as they were fo und to be a minor effect in ou r m easuremen t. For e a ch base-CPE separation distance, 100 0 0 links ar e g enerated random ly and indepen d ently , from wh ich we ob ta in the Shannon r a te with 90% coverage guar antee for that distance using (9). The resulting r ate-distance p lots are shown in Fig. 13. It was found that 1 Gbps d ownlink rate can be delivered to outd o or CPE in the same street fo r distance up to 1 00 m, an d the rate d ecreases to 80 Mbp s w h en the d istan ce inc r eases to 200 m. If the base station and the CPE ar e in different streets, 100 Mb ps downlink rate c an b e de livered up to 80 m with 90% coverage guara n tee. Since outdo or-to-indoor p e netration loss is large, 9 to 17 dB med ian loss as rep orted in [1 7] for 4 Maximum of 850 MHz bandwi dth at 28 GHz band was allocated by FCC. When channel dynamics is significant (e.g., by moving vehic les), which is not studied here, using all the av ailable bandwidth m ight be counter -producti ve, see [21 ], since the channel estimatio n cost and penalty might be ove rwhelming to maintain coherent transmission. T able II P A R A M E T E R S F O R 9 0 % - C OV E R A G E D O W N L I N K R AT E C A L C U L AT I O N . Carrier frequenc y 28 GHz 2 GHz Signal bandwidth 800 MHz 20 MHz Lamppost BS 28 dBm, 23 dBi 30 dBm, 5 dBi Outdoor CPE 11 dBi 5 dBi Noise figure 9 dB 9 dB Path loss (6) or (7) 3GPP 36.814 [20] Gain reduction results of Sec. IV UMi NL OS 20 30 50 100 200 Distance [m] 10 1 10 2 10 3 10 4 Shannon Rate [Mbps] 28GHz, other-street 28GHz, same-street 2GHz, 20MHz BW Figure 13. 90%-co verag e downlin k edge rate to outdoor CPE where the base station has 28 dBm transmit powe r and 23 dBi antenna gain and the CPE has 11 dBi antenna gain with 9 dB noise figure. Path loss and effec ti ve azimuth gain are generat ed using measured path loss models and azimuth gain distrib utions, and the rate is Shannon rate with 800 MHz bandwidt h. The edge rate will be significantly reduce d when moving CPE to indoor . As a reference, w e also plot the rate for a cellular sm all cell system operating at 2 GHz (30 dBm transmit powe r , 5 dBi gain ante nnas for base statio n and UE) using bandwidt h of 20 MHz (solid green line). NJ su burban residential h omes, the co rrespon d ing range s will decrease by a factor of 2 or mor e. Compared to a cellular small cell operating at 2 GHz band , 28 GHz cell can deliver a highe r rate ( w ith 9 0% coverage guaran te e ) than the 2 GHz system over the 200 m range fo r same-street CPEs. Should 100MHz ban dwidth be av ailable for the 2 G H z system (for example, via carr ie r aggregation ), the ra te at 10 0 m with 90% coverage gu arantee would be increased to 400 Mbps, abo ut half of what can be su pported by th e 28 GHz system using 800 MHz. On the oth er h and, a conv ention al 2 GHz system using 20 MHz would d e liver high er r ates than an 800 MHz-wide 28 GHz system beyond 60 m in g e n eral N L OS conditions, wh ere the base station is no t on the same street as the terminal being served. V I I . C O N C L U S I O N S Extensive measurem ents ( over 20 00 links, ea c h contain ing at least 37 full azimuth al scans with power measur ements over 360 degree ) of path loss, achie vable azimuth gain and temporal fading wer e collected and characterized statistically at 28 GHz in suburban en viron ments in NJ and V i ˜ na del Mar, Chile. Th e same-street path lo ss fit has a slop e of 4.1 with 25 dB excess loss over free space at 100 m, and the other-street path loss fit has a slope of 3.1 with 42 dB excess loss at 100 m. Links that have v isual LOS path ( assured using a flashlig ht) 9 suffer up to 1 5 dB excess loss o ver f r ee space over a wide range of d istan ces. An ord inary 24 dBi d irectional antenna with adaptive pointing was f ound to lose up to 4. 3 d B of gain in 90% of suburban links. Usin g multiple chains within the same antenna apertur e can help recover some of th is loss, upper bound ed b y 4 .3 dB. In the ab sence of m oving vehicles, the benefit o f rapidly re-aiming the b eam at each azimuth scan is less than 2 dB. It was foun d th at, with typical power and antenna gain co nfiguratio n for FW A base station and CPE, 1 Gbps downlink rate can be delivered to an outdoo r mou nted CPE for up to 100 m from a base station deployed in the same street with 90% c overag e guara ntee. I f the base station and th e CPE are in different streets, 1 0 0 Mbps downlink ra te can be d eliv ered up to 80 m with 9 0% coverage g uarantee. The co r respond ing downlink edge r ate will be significan tly reduced wh en movin g o utdoo r CPE to indo or , highlightin g the challenge fo r FW A deployme nts. A C K N O W L E D G M E N T The au th ors wish to a c knowledge support by CONICYT under Gran t Proyecto Basal FB0821, Fondecyt Iniciaci ´ on 11171 159, and Proyecto VRIEA-PUCV 039. 4 62/20 1 7 for supportin g Maur icio Rod r´ ıguez and Guillermo Castro. Many thanks to Hector Carra sco , Leo nardo Guerrero a nd Ren e Pozo for designing and building the platfor m , Cuong Tran for essential d iagnostics and repair, and Alicia Mu sa for data collection software impr ovement. R E F E R E N C E S [1] T . S. Rappaport et al., “Millimeter wa ve m obile communicati ons for 5G cellu lar: it will work!, ” IEEE A ccess , vol. 1, pp. 335–349, 2013. [2] L. J. Greenstein and V . Erceg, “Gain reduction s due to scatte r on wireless paths with directiona l antenn as, ” IEEE Communication s Letter s , vol. 3, pp. 169–171, June 1999. [3] D. Chizhik, J. Du, R. Feick, G. Castro, M. Rodr ´ ıguez and R. A. V alen- zuela , “Pat h loss, beamforming gain and time dynamics measurements at 28 GHz for 90% indoor cov erage, ” arxiv: 1712.06580 , Dec. 2017. [4] J. K o, Y .-J. Cho, S. Hur , T . Kim, J. Park, A. F . Molisch, K. Haneda, M. Peter , D. Pa rk and D.-H. Cho, “Mill imeter- wav e channel measurements and analysis for statistical spatial channel model in in-buildin g and urban en vironments at 28 GHz, ” IEE E T rans. W irele ss Communicat ions , vol. 16, pp. 5853–5868, Sep. 2017. [5] V . Raghav an, A. Party ka, L. Akhoondzadeh-Asl, M. A. T assoudji, O. H. Ko ymen and J. Sanelli , “Millimeter wave channel measurement and implica tions for P H Y layer design, ” IEEE T ransact ions on Antennas and Pr opagati on , vol. 65, pp. 6521–6533, Dec. 2017. [6] K. Haneda et al., “5G 3GPP-lik e channel models for outdoor urban mi- crocel lular and macrocellul ar en vironments, ” IEE E V ehicular T echnolo gy Confer ence (VTC Spring) , May 2016. [7] K. Haneda, N. Omaki, T . Imai, L. Raschk owski, M. Pete r and A. Roi v ainen, “Freque ncy-agi le pathloss models for urban street can yons, ” IEEE Tr ansactions on Antennas and Pr opagati on , vol. 64, pp. 1941– 1951, May 2016. [8] “5G Channel Model for bands up to 100 GHz, Annex A: Summary of channe l sounding, simulati ons and measurement data, ” 5GCM Whit e P aper , Mar . 2016. http:// www . 5gworkshop s.com/5GCM.html [9] C. U Bas, R. W ang, S. Sangodoyin, S. Hur , K. Whang, J. Park, J. Z hang and Andreas F . Molisc h, “28 GHz microc ell measurement campaign for resident ial env ironment, ” , Nov . 2017. [10] A. Kartt unen, A. F . Molisch, S. Hur , J. Park and C. J. Zhang, “Spatiall y consisten t street -by-street path loss model for 28-GHz channel s in micro cell urban en vironments, ” IEEE T ransacti ons on W ir eless Communica- tions , vol. 16, pp. 7538–7550, Nov . 2017. [11] T . S. Rappaport, G. R. MacCartney , S. Sun, H. Y an and S. Deng, “Small- scale, local area, and transiti onal m illimet er wav e propagatio n for 5G communicat ions, ” IEE E T ransactions on Antennas and Pro pagatio n , vol. 65, pp. 6474–6490, Dec. 2017. [12] R. W ang, C. U. Bas, S . Sangodo yin, S. H ur, J. Park, J. Zhang and A. F . Molisch, “Stati onarity region of Mm-W ave channel based on outdoor microcel lular measurements at 28 GHz, ” IE EE Military Communications Confer ence (MILCOM) , Balti more, MD, 2017, pp. 782-787. [13] T . S. Rappaport, Y . Xing, G. R. MacCar tney , A. F . Molisch, E. Melli os and J. Zhang, “Overvie w of millimete r wa ve communicati ons for fifth- generat ion (5G) wireless networks-wi th a focus on propagation models, ” IEEE Tr ansactions on Antennas and Pr opagati on , vol. 65, pp. 6213– 6230, Dec. 2017. [14] I. A. Hemadeh, K. Satyanara yana, M. El-Hajj ar and L. Hanzo, “Milli meter-w av e communications: physical channel models, design considera tions, antenna construct ions, and link-bud get, ” IEEE Commu- nicati ons Surveys & T utorials , vo l. 20, pp. 870–913, May 2018. [15] D Chizhik, M Rodr ´ ıguez, R Feick, RA V alenzu ela, “ An accura te field model requiring minimal map data for guiding and diffusi on in streets and build ings, ” IEEE T ransacti ons on W irele ss Communi cations , vo. 16, Jul. 2017. [16] “Study on channel model for frequenci es from 0.5 to 100 GHz, ” 3GP P T echnica l Report TR 38.901 V14.3.0 , Dec. 2017. [17] J. Du, D. Chi zhik, R. Feick, G. Castro, M. Rodr ´ ıguez and R. A. V alenzue la, “Suburban residential buil ding penetra tion loss at 28 gHz for fixed wireless acce ss, ” IEE E W irele ss Communications Lette rs , vol. 7, pp. 890–893, Dec. 2018. [18] W . T omasi, Electr onic Communication s Systems: Fundamentals Thr ough Advanced , 5th Edition, Pearson/Prenti ce Hall, 2004. [19] J. Du, E. Onaran, D. Chizhik, S. V enkatesan , and R. A. V alenzu ela, “Gbps user rates using mmW av e relayed backhaul with high gain antenna s, ” IEEE Journa l on Select ed Areas in Communications , vol. 35, pp.1363–1372, Jun. 2017. [20] “Further adva ncements for E-UTRA physical layer aspects (Relea se 9), ” 3GPP T echnic al Report TR 36.814, V9.2.0 , Mar . 2017. [21] J. Du and R. A. V alenzuel a, “Ho w m uch s pectrum is too much in millimet er wave wireless access, ” IEE E J ournal on Selected Areas in Communicat ions , vol. 35, pp. 1444–1458, Jul. 2017. [22] D. C. Montgomery and G. C. Runge r , Applied Statistic s and Proba bility for Engineers , 3rd edition, Wile y , 2003. [23] L. J. Greenstein , D. G. Michelson, and V . Erceg, “Moment-method estimati on of the ricean K -factor , ” IE E E Communications Letters , vol. 3, no. 6, pp. 175–176, Jun. 1999. [24] L. J. Greenstei n, S. S. Ghassemzadeh, V . Erceg and D. G. Michelso n, “Rice an K -factors in narro w-band fixed wireless channels: theory , expe riments, and statistica l models, ” IEEE T ransacti ons on V ehicular T echnolo gy , vol. 58, pp. 4000–4012, Oct. 2009. [25] M. H. Hashim and S. Stavrou , “Measureme nts and modelling of wind influence on radio wav e propagation through ve getati on, ” IEEE T ransac- tions on W irel ess Communicati ons , vol . 5, pp. 1055–1064, May 2006. [26] D. Chizhi k, J. Du, G. Cast ro, M. Rodr ´ ıguez, R. Feick and R. A. V alenzue la, “Path loss measurements and Models at 28 GHz for 90% Outdoor Suburban Co verage, ” 2018 IEE E Symposium on Antennas and Pr opagati on , Jul. 2018. [27] A. Dvoretzk y , J. Kiefer and J . W olfo witz, “ Asymptotic minimax charac- ter of the sample distribut ion functi on and of the classical multinomial estimato r , ” Annals of Mathemati cal Statist ics , vol. 27, no. 3, pp. 642– 669, 1956. [28] P . V asconcel os and L. M. Correia, “Fadin g charac terizat ion of the m obile radio channel at the millimetre wa veband, ” IEEE V ehicular T echnolo gy Confer ence (VTC) , May 1997. [29] M. Paetz old and G. Rafiq, “Sparse multipath channel s: Modelling, analysi s, and simulation, ” IEEE Annual Internat ional Symposium on P ersonal, Indoor , and Mobile Radio Communicat ions (PIMRC) , Sep. 2013. [30] S. Thoen, L. V an der Perre and M. Engels, “Modelin g the channel time- v ariance for fi xed wire less communica tions, ” IEEE Communications Letter s , vol. 6, pp. 331–333, Aug. 2002. [31] A. Domazeto vic, L . J. Greenstei n, N. B. Mandayam and I. Seskar , “Es- timatin g the Doppl er spectrum of a short-rang e fixed wireless channel, ” IEEE Communications Letter s , vol. 7, pp. 227–229, May 2003. [32] N. Iqbal et al., “M ultipath cluster fading statisti cs and modeling in millimet er-wa ve radio channel s, ” IEEE T ransact ions on Antennas and Pr opagati on , vol. 67, pp. 2622–2632, Apr . 2019. [33] Z ¨ ochmann et al.,“Better than Rician: modelli ng millimetre wav e chan- nels as two-wa ve with diffuse power , ” EURASIP Jo urnal onW ir eless Communicat ions and Network ing , 2019:21, Jan. 2019. [34] J. M. Romero-Jerez, F . J. L opez-Ma rtinez, J . F . Paris and A. J . Gold- smith, “The fluctuating two-ray fadi ng m odel: statistic al charac terizat ion and performance analysis, ” IEE E Tr ansactions on W ir eless Communi ca- tions, vol. 16, pp. 4420-4432, July 2017.
Original Paper
Loading high-quality paper...
Comments & Academic Discussion
Loading comments...
Leave a Comment