Explaining Vulnerabilities to Adversarial Machine Learning through Visual Analytics
Machine learning models are currently being deployed in a variety of real-world applications where model predictions are used to make decisions about healthcare, bank loans, and numerous other critical tasks. As the deployment of artificial intelligence technologies becomes ubiquitous, it is unsurprising that adversaries have begun developing methods to manipulate machine learning models to their advantage. While the visual analytics community has developed methods for opening the black box of machine learning models, little work has focused on helping the user understand their model vulnerabilities in the context of adversarial attacks. In this paper, we present a visual analytics framework for explaining and exploring model vulnerabilities to adversarial attacks. Our framework employs a multi-faceted visualization scheme designed to support the analysis of data poisoning attacks from the perspective of models, data instances, features, and local structures. We demonstrate our framework through two case studies on binary classifiers and illustrate model vulnerabilities with respect to varying attack strategies.
💡 Research Summary
The paper addresses a critical gap in the visual analytics community: while many tools exist to explain machine‑learning models, few help users understand how those models can be exploited by adversarial attacks. Focusing on data‑poisoning attacks, the authors propose a comprehensive visual analytics framework that reveals model vulnerabilities from four complementary perspectives—overall model performance, individual data instances, feature distributions, and local neighborhood structures.
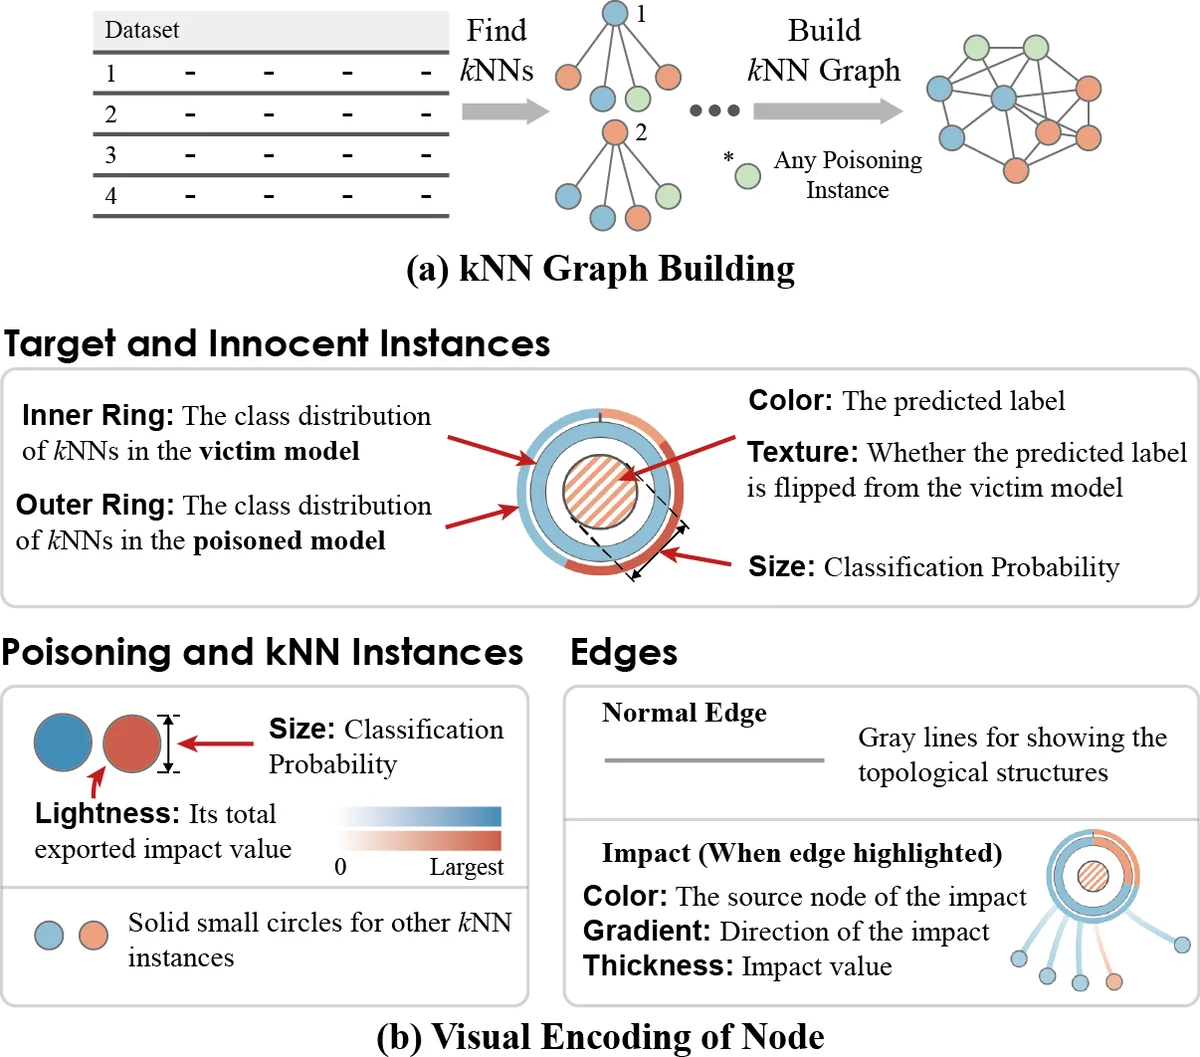
The framework is built around four coordinated views. The Model Overview visualizes global performance metrics (accuracy, recall, F1) before and after an attack, and includes a cost‑effectiveness matrix that lets analysts compare different attack scenarios in terms of impact versus the number of inserted malicious instances. The Instance View displays each data point’s label, its distance to the decision boundary, and whether it has been flipped or newly inserted by the attacker; overlapping regions of benign and malicious instances are highlighted to show where the model is most confused. The Feature View presents side‑by‑side histograms and box‑plots of selected features (e.g., specific words in a spam filter) to expose large changes in variance or mean caused by poisoning. Finally, the Local Structure View renders a dynamic k‑nearest‑neighbor graph around a target instance, making it easy to see how the attack reshapes the local data manifold.
A key design contribution is the mapping of the classic adversary taxonomy—Goal, Knowledge, Capability, Strategy—onto the visual components. This mapping guides the analyst in selecting target instances (Goal), understanding the attacker’s information (Knowledge), constraining the attack budget (Capability), and evaluating the algorithmic approach (Strategy). The system is modular: various poisoning algorithms such as gradient‑ascent optimization, StingRay, and binary‑search based attacks can be plugged in without redesigning the visual pipeline.
Two case studies demonstrate the framework’s utility. In a spam‑filtering binary classifier, the authors compare two poisoning candidates: instance #40, which yields the highest recall drop but at a higher insertion cost, and instance #80, which is cheaper but less effective. Visualizations reveal that #40’s poisoned points lie close to the decision boundary, cause many innocent emails to be mis‑labelled, and dramatically increase the variance of the “will” and “email” word features. In a medical‑diagnosis classifier, a reliability attack reduces recall from 0.81 to 0.55; the Feature View shows spikes in variance for clinical measurements, while the Local Structure View shows a re‑organization of patient clusters around the poisoned points.
These visual insights go beyond raw performance numbers. They expose subtle mechanisms—such as feature‑level variance inflation leading to decision‑boundary shifts—that would be difficult to detect with traditional metrics alone. Consequently, the framework can inform defensive strategies: feature‑level anomaly detectors, stricter data‑validation pipelines, or budget‑aware monitoring of new training samples.
In conclusion, the proposed visual analytics framework offers a systematic, interactive way to explore, explain, and compare adversarial attacks on machine‑learning models. By integrating attack strategies directly into the visualization pipeline, it empowers model developers and security analysts to anticipate worst‑case scenarios, diagnose vulnerabilities, and design more robust defenses. Future work includes extending the approach to non‑tabular data (images, time series), supporting evasion attacks, and automating the generation of vulnerability reports tailored to specific domains.
Comments & Academic Discussion
Loading comments...
Leave a Comment