Breast Tumor Cellularity Assessment using Deep Neural Networks
Breast cancer is one of the main causes of death worldwide. Histopathological cellularity assessment of residual tumors in post-surgical tissues is used to analyze a tumor's response to a therapy. Correct cellularity assessment increases the chances …
Authors: Alex, er Rakhlin, Aleksei Tiulpin
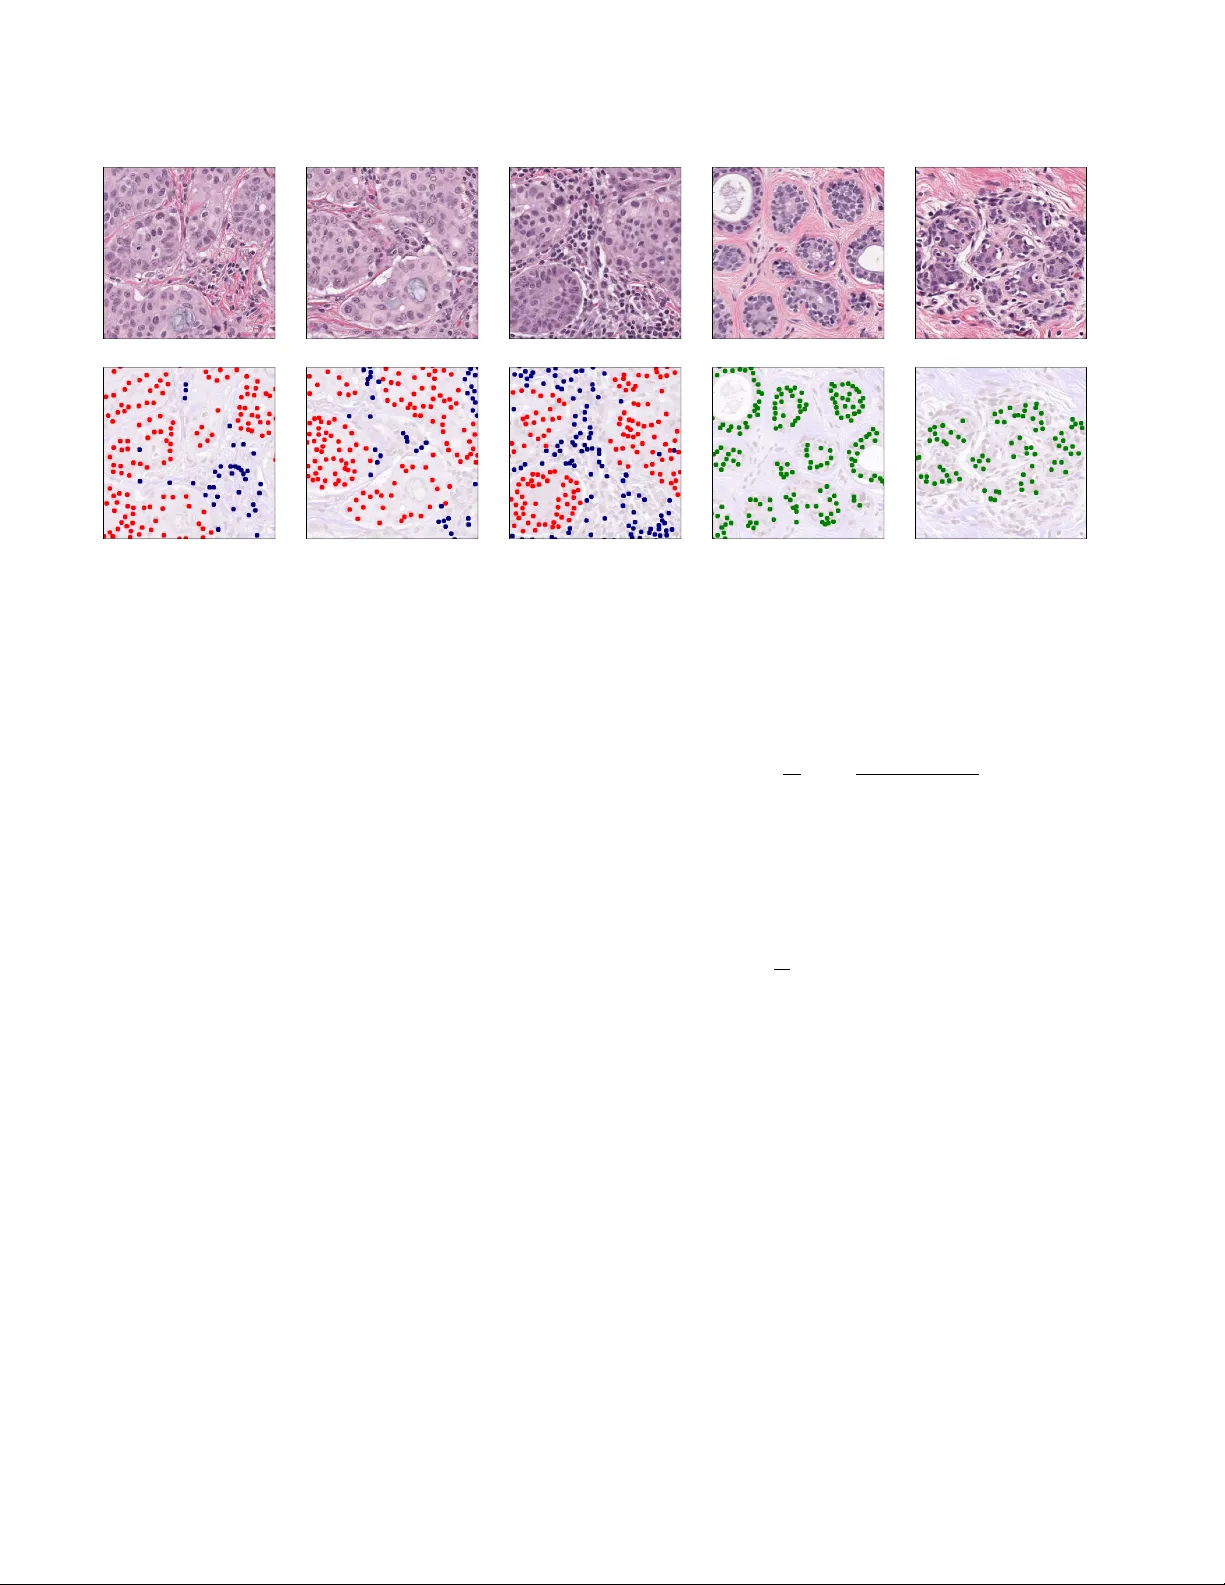
Br east T umor Cellularity Assessment using Deep Neural Networks Alexander Rakhlin Neuromation OU T allinn, 10111 Estonia rakhlin@neuromation.io Aleksei T iulpin Uni versity of Oulu Oulu 90220, Finland aleksei.tiulpin@oulu.fi Alex e y A. Shvets MIT Boston, MA 02142, USA shvets@mit.edu Alexandr A. Kalinin Uni versity of Michig an Ann Arbor , MI 48109, USA akalinin@umich.edu Vladimir I. Iglovik ov ODS.ai San Francisco, CA 94107, USA iglovikov@gmail.com Serge y Nik olenko Neuromation OU, Estonia, Steklov Mathematical Institute at St. Petersbur g, Russia sergey@logic.pdmi.ras.ru Abstract Br east cancer is one of the main causes of death world- wide. Histopathological cellularity assessment of r esid- ual tumors in post-surgical tissues is used to analyze a tu- mor’ s r esponse to a therapy . Corr ect cellularity assess- ment increases the chances of getting an appr opriate treat- ment and facilitates the patient’ s survival. In curr ent clin- ical practice, tumor cellularity is manually estimated by pathologists; this pr ocess is tedious and pr one to error s or low agr eement rates between assessor s. In this work, we evaluated three str ong novel Deep Learning-based ap- pr oac hes for automatic assessment of tumor cellularity fr om post-tr eated br east surgical specimens stained with hema- toxylin and eosin. W e validated the proposed methods on the Br eastP athQ SPIE challenge dataset that consisted of 2395 imag e patches selected fr om whole slide images ac- quir ed fr om 64 patients. Compar ed to expert pathologist scoring, our best performing method yielded the Cohen’ s kappa coefficient of 0 . 69 (vs. 0 . 42 pr eviously known in lit- eratur e) and the intra-class correlation coefficient of 0 . 89 (vs. 0 . 83 ). Our r esults suggest that Deep Learning-based methods have a significant potential to alleviate the bur - den on pathologists, enhance the diagnostic workflow , and, ther eby , facilitate better clinical outcomes in br east cancer tr eatment. 1. Introduction Breast cancer is one of the most common cancer types di- agnosed in w omen in the United States and w orldwide [ 36 ]. Biopsies and histological assessment allo w pathologists to analyze microscopic structures of breast tissues and, in par- ticular , assess the cancer’ s aggressiv eness. Multiple options are av ailable to manage and monitor the breast cancer treatment based on the information provided from the tumor’ s response to it. In addition to the treatment effect on the tumor size, the therapy may also alter the tu- mor’ s cellularity [ 8 ]. During anticancer therapy , the size of the tumor may remain the same, but the overall cellularity may be drastically reduced [ 30 ]. As a result, it makes the residual tumor cellularity an important factor in assessing the response treatment. Currently , tumor cellularity is manually assessed by pathologists from hematoxylin and eosin (H & E)-stained slides [ 30 ]. The costs of such estimation are high, the pro- cess is tedious and subjecti ve, and the quality and reliability might be also be af fected by high inter-observ er v ariabil- ity e ven among senior pathologists. This potentially may affect prognostic power assessment in clinical trials [ 39 ]. The subjectivity in visual tissue assessment motiv ates the use of computer -aided methods to improv e the diagnosis accuracy , reduce human error and increase inter -observer agreement and reproducibility [ 27 , 11 ]. Automated analy- sis of the H&E slide using computer vision could provide immediate benefits to patient care. Recent success in Deep Learning (DL) [ 22 , 34 ], and in particular the advances in con volutional neural networks (CNN), hav e recently shown high potential in this realm [ 9 ]. In this work, we ev aluate three DL-methods to score the cellularity of the breast tissue from histopathologi- cal images. In particular, our first approach employs a weakly-supervised segmentation model with Resnet-34 [ 13 ] encoder and Feature Pyramid Network (FPN)[ 24 ] and a second-stage regression network that predicts the cellu- larity score using the predicted segmentation maps. Our second approach is also based on segmentation, ho wev er , Evaluated methods Feature extraction-based GBT model UNet-FPN GBT Segmentation map Cellularity estimate features Input patch Whole Slide H&E Image Cellularity Prediction from Segmented Cells UNet-FPN Neural Regressor Segmentation map Cellularity estimate Cellularity Prediction from the H&E patch Cellularity estimate Figure 1: Generic description of the methods developed and ev aluated in this study . Our first approach leverages segmentation model, feature e xtraction and gradient boosted trees. The second approach directly predicts the cellularity from the raw data. Finally , in our third setting, we combine the first and the second approach and used a deep conv olutional neural network to predict the cellularity score from segmentation mask. instead of using the segmentation maps directly , we extract various features from them and use the gradient boosting trees (GBT) [ 28 ] to predict the cellularity score. Finally , we also ev aluate using H&E image patches directly to predict the cellularity score. 2. Related work CNNs have recently been successfully applied to many tasks in biomedical image analysis, often outperforming con ventional machine learning methods [ 9 , 41 , 35 ]. As such, they have successfully been utilized for digital pathol- ogy image analysis and have demonstrated great potential for improving breast cancer diagnostics [ 38 , 4 , 5 , 32 ]. Although there are not man y studies focusing directly on automated quantitativ e cellularity assessment, it has been sho wn that this task can be solved by first segment- ing malignant cells and then computing the tumor’ s area [ 29 ]. Many ef forts have been devoted to developing su- pervised and unsupervised methods for automated cell and nuclear se gmentation and detection [ 44 , 21 ]. Supervised segmentation models have superior performance b ut require hand-labeled nuclear mask annotations [ 44 ]. In these ap- proaches, segmented nuclear bodies are used to e xtract fea- tures that are typically inspired by visual markers recog- nized by pathologists. Commonly used features describe morphology , te xture, and spatial relationships among cell nuclei in tissue [ 29 , 19 ]. The con ventional approach most rele vant to our work is by Peikari et al. [ 29 ] who proposed an automated cellular- ity assessment protocol. First, they used smaller patches, or regions of interest (RoI), extracted from whole slide im- ages to segment all present cell nuclei. Then they extracted a number of predefined features from segmented nuclei and used support vector machines to distinguish lymphoc ytes and normal epithelial nuclei from malignant ones. Cellular - ity estimation was done using distinguished malignant ep- ithelial figures for ev ery RoI. Alternativ ely , segmentation-free methods that directly estimate cellularity from histopathology imaging data and nuclei locations annotated by human observers were also shown promising. In particular , V eta et al. [ 43 ] proposed a deep learning-based method that lev erages an informa- tion from a tumor’ s cells nuclei locations (centroids) and predicts the areas of indi vidual nuclei and mean nuclear area without the intermediate step of nuclei segmentation. In particular , this approach was based on a 10-layer deep neural network predicting nuclear areas quantized into 20 histogram bins. The results sho wed that predicted mea- surements had substantial agreement with manual measure- ments, which suggests that it is possible to compute the areas directly from imaging data, without the intermediate step of nuclei segmentation. This is in spirit similar to one of our approaches, but we do not directly compare our meth- ods to V eta et al. since we use dif ferent datasets and perfor- mance metrics. Recent works by Akbar et al. [ 3 , 2 ] hav e compared the con ventional approach based on segmentation and feature extraction and direct applications of deep CNNs to im- age patches in both regression and classification settings. Overall, they sho wed that the DL-based approach outper- formed hand-crafted features in both accuracy and intra- 2 x 3 x 4 x 6 x 3 64 128 128 256 256 512 512 decoder block decoder block decoder block decoder block ResNet-34 encoder & FPN decoder 64 decoder block conv 3x3 conv 1x1 sigmoid 3 4 4 32 32 64 64 128 256 Input Image skip connection (summation) skip connection (summation) FPN block x1 FPN block x2 FPN block x4 FPN block x8 SpatialDropout concatenation Upsample x2 conv 3x3 Decoder Block conv 3x3 conv 3x3 64 Feature PyramidBlock Upsample xN 64 conv 7x7, /2 conv 3x3 conv 3x3 conv 3x3 conv 3x3 conv 3x3 conv 3x3 conv 3x3 conv 3x3 resnet34 Figure 2: Encoder-decoder se gmentation network architecture with Resnet-34 encoder and feature pyramid netw ork decoder . Spatial Dropout 2D is added after multi-layer concatenation. class correlation (ICC) with expert pathologist annotations. Specifically , their best result was achiev ed by using a pre- trained Inception [ 40 ] model that reached ICC of 0 . 83 and 0 . 81 with two expert pathologists. In this study we ev al- uate ev en wider range of DL-based approaches, including segmentation-based and segmentation-free, in both regres- sion and classification settings. W e provide appropriate performance comparisons with pre viously reported results 1 . All the methods developed in this study are fully automatic and do not require any inv olvement of the human annotators at the test time. 3. Methods In this study , we propose and e valuate three different methods. The first two methods are based on the nuclei segmentation and the third method le verages the raw image without preceding se gmentation step. Graphical illustration of our approach is presented in Figure 1 3.1. Segmentation Network Architectur e. Most modern segmentation ar- chitectures inherit the encoder-decoder architecture similar to U-Net [ 33 ], where conv olutional layers in the contract- ing branch (encoder) are followed by an upsampling branch 1 It is worth noting that the of ficial BrestPathQ challenge results ha ve been reported only as a score distribution. Each team know their own results only , and ours belong to the right end of the distribution, b ut, unfor- tunately , we are not able to provide a comparison of our approach with other participants. http://spiechallenges.cloudapp.net/ competitions/14#learn_the_details that brings segmentation back to the original image size (de- coder). In addition, skip connections are used between con- tracting and upsampling modules to help the localization in- formation propagate through the complex multilayer struc- ture and ev entually improve segmentation accuracy [ 33 ]. U- Net and architectures inspired by this idea hav e produced state of the art results in various segmentation problems, and many improvements for the architecture and its training pro- tocols ha ve recently been proposed. In particular , Iglovik ov et al. [ 15 ] used batch normalization [ 17 ] and e xponential linear unit (ELU) as the primary activ ation function and an ImageNet pre-trained V GG-11 netw ork [ 37 ] as an en- coder . Liu et al. [ 25 ] proposed an hourglass-shaped net- work (HSN) with residual connections, which is also very similar to the U-Net architecture. Rakhlin et al. [ 31 ] used the Resnet-34 network [ 14 ] as the encoder and the Lov ´ asz- Softmax loss function [ 6 ] along with Stochastic W eight A v- eraging (SW A) [ 18 ] for training. In our proposed architecture, the segmentation module also inherits the U-Net architecture. The contracting branch (encoder) of our model is based on the Resnet-34 [ 14 ] net- work architecture where we have introduced sev eral useful modifications. In particular , we hav e replaced ReLU acti- vations with ELU that does not saturate gradients and keeps the output close to zero mean and have changed order of batch normalization [ 17 ] and acti vation layers. In Section 4 we compare encoders initialized with random He’ s initial- ization [ 12 ] and pretrained on ImageNet. T o address the limited size of the BreastPathQ Cancer Cellularity Challenge dataset, we utilized two re gulariza- 3 (a) (b) (c) (d) (e) Figure 3: Light micrograph of a histologic specimen of breast tissue stained with hematoxylin and eosin (top). The bottom row shows nuclei segmentation masks synthesized from weak labels: Malignant — red, Normal — green, Lymphocyte — blue. tion techniques: (1) data augmentation and (2) spatial 2D dropout incorporated into the upsampling branch [ 42 ]. The upsampling branch is implemented as a Feature Pyramid Network (FPN) [ 23 ], reconstructing high-lev el se- mantic feature maps at four scales simultaneously . W e im- plement a feature pyramid block as a con volutional layer with 64 activ ation maps followed by upsampling to the orig- inal resolution with upsampling rate of 8, 4, 2, or 1 depend- ing on the feature map depth (see Fig. 2 ). In Section 4 , we compare the performance of standard and FPN decoders. W e concatenate upsampled maps into a single layer of 64 × 4 = 256 maps and add after it a spatial 2D dropout layer , which acts as a regularizer and prev ents coadaptation of the network weights, but unlike conv entional dropout it drops out not indi vidual neurons but rather entire acti vation maps. Throughout the work, we use dropout rate 0 . 5 , ran- domly dropping 128 out of 256 activ ation maps. Finally , the output of the model is a 4-channel sigmoid layer that assigns ev ery pixel with four values from 0 to 1 that represent the probabilities of belonging to the Normal , L ymphocyte , Malignant , and Backgr ound classes. Loss functions. Binary cross entropy (BCE), while con- venient for training, does not directly translate into Jaccard index, the metric commonly used to e valuate segmentation accuracy . Hence, as the loss function we use L c ( w ) = (1 − α )BCE c ( w ) − αJ c ( w ) , (1) a weighted sum of BCE and the soft Jaccard loss for class c [ 15 , 31 , 16 ]. In this work, we set α = 0 . 15 , a v alue found via cross-validation. The soft Jaccard loss is defined as J c ( w ) = 1 N N X i =1 y c i ˆ y c i y c i + ˆ y c i − y c i ˆ y c i , (2) where w are network parameters, y c i is the binary label for pixel i and class c , ˆ y c i is the predicted probability of c for pixel i , and N is the total number of pixels. The total loss function is a weighted sum of class losses: L ( w ) = 1 V 4 X c =1 L c ( w ) v c , V = 4 X c =1 v c , (3) where v c is a loss weight for class c . In this work we weigh Normal , Lymphocyte , and Backgr ound as 1 and Malignant , the class of primary importance in our problem, as 4 . 3.2. Cellularity estimation from segmented cells In this subsection, we describe the method for cellularity assessment that lev erages the output of the trained segmen- tation network Fig. 2 . W e feed the segmented output into a Resnet-34 CNN model. The model automatically learns deep features from the 4-channel segmentation input and regresses it onto continuous cellularity score using continu- ous regression loss ( L 2 ) . In this approach, the segmentation model acts as a filter the aim of which is to extract only the information about the cell morphology . W e hypothesized that this structured approach makes our method similar to methods employed by expert pathologists, mak es it trans- parent and less sensitiv e to data acquisition settings. 4 (a) 0 . 04 (b) 0 . 16 (c) 0 . 32 (d) 0 . 50 Figure 4: Segmentation results at thresholds (a) - (d) of Malignant channel superimposed with the original image. Masks generated after thresholding were used for feature extraction. (a) 0 . 02 (b) 0 . 08 (c) 0 . 16 (d) 0 . 24 Figure 5: Nuclei blobs detected from the Malignant seg- mentation maps using the Laplacian of Gaussian method at thresholds (a)-(d). The blobs were used for feature extrac- tion. 3.3. F eature extraction-based cellularity estimation The second type of model is Gradient Boosted T rees (GBT) [ 20 ] in regression mode ( L 2 loss). The general idea and handcrafted features are borro wed from the second place solution for 2017 Kaggle contest for Sea Lion Popula- tion Count in aerial imaginary [ 26 ]. The authors would like to thank Konstantin Lopuhin for valuable discussion they had while incorporating his method. In this study , GBT op- erates on a vector of hand-crafted features extracted from nuclei segmentation maps, including: • acti v ations and their areas aggregated over segmenta- tion maps with dif ferent thresholds; for every se gmen- tation map in Normal , Lymphocyte , Malignant and for 7 thresholds 0 . 02 , 0 . 04 , 0 . 08 , 0 . 16 , 0 . 24 , 0 . 32 , 0 . 5 , we obtain 2 v alues: total area above threshold and total ac- tiv ation abo ve threshold (see Fig. 4 for an illustration); • using the Laplacian of Gaussian (LoG) method as im- plemented in the OpenCV library [ 7 ], we find blobs in segmentation maps at 6 thresholds: 0 . 02 , 0 . 04 , 0 . 08 , 0 . 16 , 0 . 24 , 0 . 5 ; for each threshold we find the number of blobs and total activ ation in blob centers (Fig. 5 ); • total activ ation for e very channel, computed as a sum of the activ ations at ev ery pixel after sigmoid. In total, we obtain 3 × (7 × 2 + 6 × 2 + 1) = 81 features to train the GBT model. 3.4. Cellularity estimation from the raw images The third type of model is a deep con volutional net- work implemented in regression or classification settings ( L 2 or cate gorical cross-entropy loss functions respec- tiv ely). These models do not use intermediate se gmenta- tion and predict the cellularity score immediately from the microscopic image. For classification, we categorize cel- lularity into 101 class using regular bins with thresholds 0 . 00 , 0 . 01 , . . . , 1 . 00 . The idea of direct regression of an im- age into continuous value using CNN is not new . In particu- lar , it was implemented in [ 16 ] where the authors use CNN to predict bone age from radiograph. 3.5. Evaluation metrics W e assessed the results using se veral metrics. The main ev aluation metric is the mean squared error (MSE) between the cellularity score obtained in our experiments and ground truth provided by an e xpert pathologist. In order to make our results comparable with previous work, we also report Cohen’ s kappa coefficient agreement and the intra-class correlation coefficient (ICC) between ex- pert and automated methods, similar to [ 29 ]. In all ex- periments, we find our results superior to our predeces- sors; ho wev er, the cellularity score itself in [ 29 ] is ev aluated based on binning it into four categories of 0 – 25 %, 26 – 50 %, 51 – 75 %, and 76 – 100 %. Such 4 -class categorization is rel- ativ ely coarse and, in our opinion, does not represent a suit- able ev aluation metric for continuous cellularity estimation that is our goal in this work. 4. Experiments and results 4.1. Data The data used in this study had been acquired from the Sunnybrook Health Sciences Centre with funding from the Canadian Cancer Society and was made a vailable for the BreastPathQ challenge sponsored by the SPIE, NCI/NIH, AAPM, and the Sunnybrook Research Institute [ 29 ]. In our experiments we used 2 , 395 patches of 512 × 512 pixels in size, extracted from 96 haematoxylin and eosin (H&E) stained whole slide images (WSI) acquired from 64 patients. Each patch in the training set has been assigned a tumor cellularity score by an expert pathologist. In Fig- ure 6 , we present a distribution of the cellularity scores in the dataset. Besides the image data, we used the annotations ( X and Y coordinates) to identify lymphocytes, malignant ep- ithelial, and normal epithelial cell nuclei in the additional 153 patches. Using these weak annotations, we generated the segmentation masks that were used in our experiments. Here, at each X Y location, we simply fit a blob of 15 pixels in diameter . In Figure 3 we present the generated masks for various classes. 5 0 0.2 0.4 0.6 0.8 1 0 200 400 600 800 Figure 6: Cellularity score distribution. 4.2. W eakly-supervised cell segmentation In this study , characteristic features of the data present a serious challenge for de veloping segmentation models: 1) the data features no segmented cells, only their coordinates (that is why we use semi-supervised segmentation); 2) an- notated nuclei are present only in 154 microscopic images, each containing 0-50 malignant cells. Howe ver , cell seg- mentation is not a distinct goal of this study . As mentioned in Section 1 and in [ 8 , 30 , 10 ], cellularity within the tumor area is assessed by estimating the percentage area of the ov erall tumor bed comprised of inv asiv e tumor cells. Ag- gregated area of indi vidual in vasi ve cell areas serves as a proxy and does not represent the ultimate cellularity value. Cellularity is affected by cell density , localization, and tis- sue structure. W e use segmented cells essentially as an in- terpretable visualization of an inv asiv e tumor within the tu- mor bed. In our ablation studies, we ev aluated our model in four different settings to find how different design choices influence the segmentation accuracy and generalization. Namely , we compared the model as described in Section 3 with a standard U-Net decoder against an FPN decoder , and with the encoder initialized randomly against the encoder initialized with weights pretrained on ImageNet. In all set- tings, the model was trained for 150 epochs with the Adam optimizer and gradually decreasing learning rate from 10 − 4 to 10 − 5 . T o obtain training patches, we downscaled the mi- croscopy images × 2 times, randomly cropped a 256 × 256 area, and rescaled pixel values from [0 , 255] to [ − 1 , 1] . As mentioned previously , segmentation targets were generated as 4-channel masks with round blobs, 15 pixels in diameter (the characteristic nucleus size), drawn in the nuclei cen- ters. During training, we dynamically augmented images with vertical and horizontal flips, rotation, gamma, hue, and saturation utilizing the Albumentations library [ 1 ]. In the first series of experiments, we ev aluated segmen- tation quality as an important intermediate metric for the ev aluation of our methods. The segmentation performance as a function of the decoder and initialization is shown in T able 1 . As we can see, the model with the feature pyra- T able 1: Segmentation results: the Jaccard index for differ - ent decoders and initializations. Initialization Standard decoder FPN decoder Random 0.35 0.47 ImageNet 0.50 0.53 T able 2: Cellularity MSE with 95% confidence intervals for the segmentation-based (first ro w) and for the end-to-end methods. Our results demonstrate the importance of Ima- geNet pre-training. C in the parentheses indicates classifi- cation, R – regression and S – se gmentation. Model Initialization Random ImageNet GBT 0.023 [0.019-0.026] 0.022 [0.019-0.026] Resnet34 (SR) 0.013 [0.011-0.015] 0.013 [0.011-0.015] ResNet34 (R) 0.015 [0.013-0.018] 0.011 [0.010-0.012] ResNet50 (R) 0.025 [0.022-0.028] 0.011 [0.009-0.012] Xception (R) 0.017 [0.015-0.020] 0.010 [0.009-0.012] Xception (C) 0.012 [0.010-0.014] 0.010 [0.009-0.012] T able 3: Cellularity Kappa (4 class binning) and Intra-Class Correlation Coef ficient (ICC) with 95% confidence inter - vals for the segmentation-based ( 1 st and 2 nd rows) and for the methods predicting cellularity directly , without se gmen- tation. All the models here utilize ImageNet pre-training. C in the parentheses indicates classification, R – regression and S – segmentation. Model Metric Kappa ICC GBT 0.571 [0.520-0.622] 0.787 [0.744-0.823] Resnet34 (SR) 0.658 [0.604-0.704] 0.865 [0.835-0.891] ResNet34 (R) 0.649 [0.599-0.700] 0.868 [0.840-0.892] ResNet50 (R) 0.652 [0.603-0.701] 0.867 [0.844-0.894] Xception (R) 0.669 [0.616-0.713] 0.881 [0.853-0.904] Xception (C) 0.689 [0.642-0.734] 0.883 [0.858-0.905] Peikari et al. [ 29 ] 0.38-0.42 0.75 [0.71-0.79] Akbar et al. [ 3 ] — 0.83 [0.79-0.86] mid decoder and encoder pretrained on ImageNet achiev ed significantly higher and more stable Jaccard index on the validation set than the alternativ es. Figure 7 shows an ex- ample of generated segmentation masks in the Malignant channel and nuclei blobs reconstructed with the Laplacian of Gaussian method. 6 (a) Image (b) Mask 0.0 0.2 0.4 0.6 0.8 1.0 (c) Prediction (d) LoG Figure 7: Examples of the generated segmentation masks in the Malignant channel. Left to right: (a) original patch; (b) ground truth segmentation superimposed on the original image; (c) acti vation map; (d) nuclei blobs reconstructed from the activ ation map with the LoG method. 0 20 40 60 80 100 0 0.02 0.04 0.06 T raining epochs Cellularity score MSE T raining set, random init T est set, random init T raining set, ImageNet init T est set, ImageNet init Figure 8: Cellularity MSE ev olution during training. 4.3. Segmentation-based cellularity assessment Prediction from the segmented cells. As mentioned pre- viously , we used the output of the segmentation model as in- put for the cellularity re gressor and then trained this cascade end-to-end. W e froze the segmentation model and stack its 4-channel output with a randomly initialized Resnet-34 in the regression setting. W e trained the regression part with cellularity targets and MSE loss until con vergence. Then we unfroze segmentation weights and fine-tuned both modules in an end-to-end fashion, as a single model. W e repeated this experiment with Resnet-34 pretrained on ImageNet. In the latter case, we excluded the background channel from segmentation output to comply with the vanilla Resnet-34 architecture that has a 3-channel input. In these experiments, we found that after fine-tuning the accuracy of segmentation itself slightly decreases, while the accuracy of the overall cellularity scoring increases. This is in line with [ 10 ], which found that perfect segmenta- tion of nuclei figures does not ensure better classification of malignant objects from breast cancer tissues. This find- ing suggests that the two branches of future w ork, tumor bed segmentation and cellularity assessment, are relatively independent. Featur e extraction-based method. In this series of ex- periments, we extracted the 81 features from segmen- tation masks as discussed in Section 3 and trained the LightGBM [ 20 ] regression model with mean squared error (MSE) objectiv e. The model was trained for 600 epochs with learning rate 0 . 01 . The maximum tree depth was set to 5; the number of leav es, to 8. These parameters hav e been selected through cross-validation. W e report LightGBM accuracy in T able 2 and show the resulting feature importance on Fig. 9 . Feature importance was calculated based on the total gain of the loss function from the splits formed according to this feature. As ex- pected, all highly important features come from the Malig- nant channel. The most important feature is the total acti- vation abov e 0 . 5 threshold, and the second and third most important features are the activ ations above 0 . 32 and 0 . 24 thresholds, as expected since activ ations at different thesh- olds are highly correlated, and the segmentation quality at threshold 0 . 5 was the best, so the feature based on this mask is a natural candidate for the most important feature. Ac- tiv ations at lower thresholds provide additional v alue, but a big part of the information that they contain has already been conv eyed via the 0 . 5 threshold feature. Interestingly , malignant cell count (detected at threshold 0 . 24 ) is only the 9 th feature in order of importance. 4.4. Direct cellularity assessment from the raw im- ages In our final experiments, we ev aluated several deep neu- ral architectures that take the original microscopy images 7 1000 10000 100000 area@0.02 blb cnt@0.50 value@0.08 blb cnt@0.04 blb cnt@0.02 value@0.16 blb sum@0.04 blb cnt@0.24 blb sum@0.02 value@total blb sum@0.16 area@0.04 blb sum@0.24 value@0.24 value@0.32 value@0.50 Feature impor tance (logar ithmic scale) Figure 9: GBT top feature importance. as input and output the cellularity score without interme- diate segmentation. Similarly to previous experiments, we trained the models with random He initialization [ 12 ] or ini- tialized them with weights pretrained on ImageNet. In all cases, ImageNet initialization was superior to random, and the ov erall accuracy was slightly better than for the mod- els with intermediate se gmentation. The Xception model implemented in a classification setup with random initial- ization performed slightly better than its counterparts (MSE 0.012 vs. 0.017-0.025). Although small, this difference could possibly be attributed to the known regression-to- mean problem of the continuous regression with L 2 loss (e.g., see a well-explained example for a colourization ap- plication in [ 45 ]). The mean squared error of cellularity prediction as a function of the training epoch for different initializations is sho wn in Figure 8 . All the performance ev aluation metrics are presented in T able 2 and T able 3 . 4.5. Discussion As we can see in T able 2 and T able 3 , direct cellularity assessment method slightly outperforms the segmentation- based approach, where the regression module works on top of the segmentation feature extractor . W e believ e that per- formance impro ves due to two main reasons. First, seg- mentation models were not trained on accurate segmenta- tion masks but rather on approximate masks generated from weakly supervised labels. Second, the cellularity score de- pends not only on the tumor masks b ut also on a broader set of features, some of which could be lost during the segmen- tation step. While we note the record results of our end-to-end mod- els, we believ e that the modular form of the prediction pipeline pro vides benefits that more than compensate for this small difference in the final score. The segmentation-based approach has two significant advantages: generalizability and interpretability . In prac- tice, the data used for medical imaging tasks comes from different hospitals and is collected by dif ferent hardware. Images may differ in quality , lev el of noise, color and brightness distributions. In [ 16 ], the authors proposed to use segmentation to clean and standardize the data, which helps with o verall robustness and performance of various task-specific models. Better interpretability is achie ved by the fact that we can visually v erify the quality of the intermediate step, i.e., seg- mented tumors. Furthermore, the decision trees model al- lows to estimate the feature importance for e very feature based on the information gain. If se gmented tumors are cor - rect, and the most informati ve features mak e intuiti ve sense, we obtain additional confidence in our model, which is v ery important in the medical setting. 5. Conclusion In this paper , we ev aluate three automatic methods to assess the cellulalarity of residual breast tumors in H&E stained samples. Our first method le verages the weakly- supervised segmentation masks as inputs for deep CNN. W e believ e that this method will be more generalizable and ro- bust to wards the data acquisition and easier to interpret. Our second method that lev erages feature extraction from the weakly-supervised segmentation mask yields the highest score among the all pre viously published feature extraction-based methods [ 3 , 29 ]. Finally , the third method in this study is an end-to- end approach that predicts the cellularity score without any intermediate segmentation step. Although it is attractive and produces the best results it lacks interpretability of the segmentation-based methods and could perform best due to the dataset bias. The main limitation of this study is the dataset size and the weak labels for the segmentation model. W e think that gi ven a bigger dataset and good quality annotations, segmentation-based approach could produce better results that less deviate from the end-to-end trained models. Acknowledgements The work of Sergey Nikolenk o was supported by the Russian Foundation for Basic Research grant no. 18-54- 74005. The authors thank the anonymous revie wer #2 for the constructi ve suggestions that helped to improv e the arti- cle. References [1] E. K. V . I. I. A. Buslae v , A. Parinov and A. A. Kalinin. Al- bumentations: fast and flexible image augmentations. ArXiv e-prints , 2018. 6 [2] S. Akbar , M. Peikari, S. Salama, S. Nofech-Mozes, and A. L. Martel. Determining tumor cellularity in digital slides using 8 resnet. In Medical Imaging 2018: Digital P athology , volume 10581, page 105810U, 2018. 2 [3] S. Akbar , M. Peikari, S. Salama, A. Y . Panah, S. Nofech- Momes, and A. L. Martel. Automated and manual quan- tification of tumour cellularity in digital slides for tumour burden assessment. bioRxiv , page 571190, 2019. 2 , 6 , 8 [4] T . Ara ´ ujo, G. Aresta, E. Castro, J. Rouco, P . Aguiar , C. Eloy , A. Pol ´ onia, and A. Campilho. Classification of breast cancer histology images using conv olutional neural networks. PloS one , 12(6):e0177544, 2017. 2 [5] B. E. Bejnordi, M. V eta, P . J. van Diest, B. van Ginneken, N. Karssemeijer , G. Litjens, J. A. v an der Laak, M. Hermsen, Q. F . Manson, M. Balkenhol, et al. Diagnostic assessment of deep learning algorithms for detection of lymph node metas- tases in women with breast cancer . J ama , 318(22):2199– 2210, 2017. 2 [6] M. Berman, A. Rannen T riki, and M. B. Blaschko. The lov ´ asz-softmax loss: A tractable surrogate for the optimiza- tion of the intersection-o ver-union measure in neural net- works. In The IEEE Conference on Computer V ision and P attern Recognition (CVPR) , June 2018. 3 [7] G. Bradski. The OpenCV Library. Dr . Dobb’ s Journal of Softwar e T ools , 2000. 5 [8] Detailed pathology methods for using residual cancer burden. https://www .mdanderson.or g/education-and- research/resources-for-professionals/clinical-tools-and- resources/clinical-calculators/calculators-rcb-pathology- protocol2.pdf. 1 , 6 [9] T . Ching, D. S. Himmelstein, B. K. Beaulieu-Jones, A. A. Kalinin, B. T . Do, G. P . W ay , E. Ferrero, P .-M. Agapo w , M. Zietz, M. M. Hof fman, et al. Opportunities and obsta- cles for deep learning in biology and medicine. Journal of The Royal Society Interface , 15(141), 2018. 1 , 2 [10] L. E. Boucheron, B. Manjunath, and N. Harve y . Use of imperfectly segmented nuclei in the classification of histopathology images of breast cancer . pages 666–669, 03 2010. 6 , 7 [11] J. G. Elmore, G. M. Longton, P . A. Carney , B. M. Geller , T . Onega, A. N. T osteson, H. D. Nelson, M. S. Pepe, K. H. Allison, S. J. Schnitt, et al. Diagnostic concordance among pathologists interpreting breast biopsy specimens. J ama , 313(11):1122–1132, 2015. 1 [12] K. He, X. Zhang, S. Ren, and J. Sun. Delving deep into rectifiers: Surpassing human-lev el performance on imagenet classification. In Pr oceedings of the IEEE international con- fer ence on computer vision , pages 1026–1034, 2015. 3 , 8 [13] K. He, X. Zhang, S. Ren, and J. Sun. Deep residual learn- ing for image recognition. In Pr oceedings of the IEEE con- fer ence on computer vision and pattern r ecognition , pages 770–778, 2016. 1 [14] K. He, X. Zhang, S. Ren, and J. Sun. Deep residual learn- ing for image recognition. In Pr oceedings of the IEEE con- fer ence on computer vision and pattern r ecognition , pages 770–778, 2016. 3 [15] V . Igloviko v and A. Shvets. T ernausnet: U-net with vgg11 encoder pre-trained on imagenet for image segmentation. arXiv pr eprint arXiv:1801.05746 , 2018. 3 , 4 [16] V . I. Iglovikov , A. Rakhlin, A. A. Kalinin, and A. A. Shvets. Paediatric bone age assessment using deep con volutional neural netw orks. In Deep Learning in Medical Imag e Analy- sis and Multimodal Learning for Clinical Decision Support , pages 300–308. Springer , 2018. 4 , 5 , 8 [17] S. Ioffe and C. Szegedy . Batch normalization: Accelerating deep network training by reducing internal cov ariate shift. In International Conference on Machine Learning , pages 448– 456, 2015. 3 [18] P . Izmailov , D. Podoprikhin, T . Garipov , D. V etrov , and A. G. W ilson. A v eraging weights leads to wider optima and better generalization. arXiv pr eprint arXiv:1803.05407 , 2018. 3 [19] A. A. Kalinin, A. Allyn-Feuer , A. Ade, G.-V . Fon, W . Meixner , D. Dilworth, S. S. Husain, J. R. de W ett, G. A. Higgins, G. Zheng, et al. 3D shape modeling for cell nuclear morphological analysis and classification. Scientific Reports , 8, 2018. 2 [20] G. Ke, Q. Meng, T . Finle y , T . W ang, W . Chen, W . Ma, Q. Y e, and T .-Y . Liu. Lightgbm: A highly efficient gradient boost- ing decision tree. In I. Guyon, U. V . Luxburg, S. Bengio, H. W allach, R. Fergus, S. V ishwanathan, and R. Garnett, ed- itors, Advances in Neural Information Pr ocessing Systems 30 , pages 3146–3154. Curran Associates, Inc., 2017. 5 , 7 [21] D. K omura and S. Ishikawa. Machine learning methods for histopathological image analysis. Computational and struc- tural biotec hnology journal , 16:34–42, 2018. 2 [22] Y . LeCun, Y . Bengio, and G. Hinton. Deep learning. nature , 521(7553):436, 2015. 1 [23] T . Lin, P . Doll ´ ar , R. B. Girshick, K. He, B. Hariharan, and S. J. Belongie. Feature pyramid networks for object detec- tion. CoRR , abs/1612.03144, 2016. 4 [24] T .-Y . Lin, P . Doll ´ ar , R. Girshick, K. He, B. Hariharan, and S. Belongie. Feature pyramid networks for object detection. In Pr oceedings of the IEEE Confer ence on Computer V ision and P attern Recognition , pages 2117–2125, 2017. 1 [25] Y . Liu, D. Minh Nguyen, N. Deligiannis, W . Ding, and A. Munteanu. Hourglass-shapenetwork based semantic seg- mentation for high resolution aerial imagery . Remote Sens- ing , 9(6):522, 2017. 3 [26] K. Lopuhin. Noaa fisheries steller sea lion population count. https://www .kaggle.com/c/noaa-fisheries-steller-sea- lion-population-count/discussion/35422, 2017, online; ac- cessed April 18, 2019. 5 [27] J. S. Meyer , C. Alvarez, C. Miliko wski, N. Olson, I. Russo, J. Russo, A. Glass, B. A. Zehnbauer , K. Lister , and R. Par- waresch. Breast carcinoma malignancy grading by bloom– richardson system vs proliferation index: reproducibility of grade and advantages of proliferation index. Modern pathol- ogy , 18(8):1067, 2005. 1 [28] A. Natekin and A. Knoll. Gradient boosting machines, a tutorial. F r ontiers in neur or obotics , 7:21, 2013. 2 [29] M. Peikari, S. Salama, S. Nofech-Mozes, and A. L. Martel. Automatic cellularity assessment from post-treated breast surgical specimens. Cytometry P art A , 91(11):1078–1087, 2017. 2 , 5 , 6 , 8 [30] R. Rajan, A. Poniecka, T . L. Smith, Y . Y ang, D. Frye, L. Pusztai, D. J. Fiterman, E. Gal-Gombos, G. Whitman, 9 R. Rouzier , et al. Change in tumor cellularity of breast carcinoma after neoadjuvant chemotherapy as a v ariable in the pathologic assessment of response. Cancer: Inter disci- plinary International J ournal of the American Cancer Soci- ety , 100(7):1365–1373, 2004. 1 , 6 [31] A. Rakhlin, A. Davydo w , and S. Nikolenko. Land co ver classification from satellite imagery with u-net and lov ´ asz- softmax loss. In The IEEE Conference on Computer V ision and P attern Recognition (CVPR) W orkshops , June 2018. 3 , 4 [32] S. Robertson, H. Azizpour , K. Smith, and J. Hartman. Digital image analysis in breast pathology—from image processing techniques to artificial intelligence. T ranslational Resear ch , 2017. 2 [33] O. Ronneberger , P . Fischer , and T . Brox. U-net: Conv o- lutional networks for biomedical image segmentation. In International Conference on Medical image computing and computer-assisted intervention , pages 234–241. Springer , 2015. 3 [34] J. Schmidhuber . Deep learning in neural networks: An ov erview . Neural networks , 61:85–117, 2015. 1 [35] A. A. Shvets, A. Rakhlin, A. A. Kalinin, and V . I. Igloviko v . Automatic instrument segmentation in robot-assisted surgery using deep learning. In 2018 17th IEEE International Con- fer ence on Mac hine Learning and Applications (ICMLA) , pages 624–628. IEEE, 2018. 2 [36] R. L. Siegel, K. D. Miller, and A. Jemal. Cancer statistics, 2018. CA: A Cancer Journal for Clinicians , 68(1):7–30, 2018. 1 [37] K. Simonyan and A. Zisserman. V ery deep con volutional networks for large-scale image recognition. arXiv preprint arXiv:1409.1556 , 2014. 3 [38] F . A. Spanhol, L. S. Oliveira, C. Petitjean, and L. Heutte. Breast cancer histopathological image classification using con volutional neural networks. In Neural Networks (IJCNN), 2016 International Joint Confer ence on , pages 2560–2567. IEEE, 2016. 2 [39] W . F . Symmans, F . Peintinger, C. Hatzis, R. Rajan, H. Kuerer , V . V alero, L. Assad, A. Poniecka, B. Hennessy , M. Green, et al. Measurement of residual breast cancer burden to predict surviv al after neoadjuvant chemotherapy . Journal of Clinical Oncolo gy , 25(28):4414–4422, 2007. 1 [40] C. Szegedy , V . V anhoucke, S. Ioffe, J. Shlens, and Z. W ojna. Rethinking the inception architecture for computer vision. In Pr oceedings of the IEEE confer ence on computer vision and pattern r ecognition , pages 2818–2826, 2016. 3 [41] A. T iulpin, J. The venot, E. Rahtu, P . Lehenkari, and S. Saarakkala. Automatic knee osteoarthritis diagnosis from plain radiographs: A deep learning-based approach. Scien- tific Reports , 8:1727, 2018. 2 [42] J. T ompson, R. Goroshin, A. Jain, Y . LeCun, and C. Bre- gler . Ef ficient object localization using conv olutional net- works. In Pr oceedings of the IEEE Confer ence on Computer V ision and P attern Recognition , pages 648–656, 2015. 3 [43] M. V eta, P . J. V an Diest, and J. P . Pluim. Cutting out the middleman: measuring nuclear area in histopathology slides without segmentation. In International Conference on Med- ical Image Computing and Computer-Assisted Intervention , pages 632–639. Springer , 2016. 2 [44] F . Xing and L. Y ang. Robust nucleus/cell detection and seg- mentation in digital pathology and microscopy images: A comprehensiv e review . IEEE Reviews in Biomedical Engi- neering , 9:234–263, 2016. 2 [45] R. Zhang, P . Isola, and A. A. Efros. Colorful image col- orization. Lecture Notes in Computer Science , page 649666, 2016. 8 10
Original Paper
Loading high-quality paper...
Comments & Academic Discussion
Loading comments...
Leave a Comment