From Facility to Application Sensor Data: Modular, Continuous and Holistic Monitoring with DCDB
Today’s HPC installations are highly-complex systems, and their complexity will only increase as we move to exascale and beyond. At each layer, from facilities to systems, from runtimes to applications, a wide range of tuning decisions must be made in order to achieve efficient operation. This, however, requires systematic and continuous monitoring of system and user data. While many insular solutions exist, a system for holistic and facility-wide monitoring is still lacking in the current HPC ecosystem. In this paper we introduce DCDB, a comprehensive monitoring system capable of integrating data from all system levels. It is designed as a modular and highly-scalable framework based on a plugin infrastructure. All monitored data is aggregated at a distributed noSQL data store for analysis and cross-system correlation. We demonstrate the performance and scalability of DCDB, and describe two use cases in the area of energy management and characterization.
💡 Research Summary
The paper addresses the growing complexity of modern high‑performance computing (HPC) installations, which now span from the physical data‑center infrastructure through system hardware, runtime environments, and finally user applications. Existing monitoring solutions are typically siloed, each covering only a subset of this stack, which prevents administrators and users from obtaining a holistic view necessary for efficient operation, energy management, and fault tolerance. To fill this gap, the authors introduce DCDB (Data Center Data Base), a comprehensive, modular, and continuously operating monitoring framework that can ingest sensor data from every layer of an HPC environment and store it in a distributed NoSQL time‑series database.
The architecture consists of three main component classes: Pushers, Collect Agents, and Storage Backends. Pushers are lightweight agents that run either on compute nodes (in‑band monitoring) or on management/facility servers (out‑of‑band monitoring). They acquire data through a plugin system; each plugin is a dynamically loaded library that implements a specific protocol or API (e.g., IPMI, SNMP, ProcFS, SysFS, GPFS, Omnipath, BACnet, REST). The collected measurements are published via MQTT, a lightweight publish/subscribe protocol designed for telemetry. MQTT topics are hierarchical strings that encode the physical location and type of each sensor (e.g., facility/room/rack/node/cpu/temperature), enabling intuitive navigation of the sensor space.
Collect Agents act as MQTT brokers. They subscribe to the topics emitted by their associated Pushers, receive the time‑stamped readings, and forward them to the Storage Backend. The current implementation uses Apache Cassandra as the backend because of its built‑in data distribution, replication, and linear scalability. However, the design abstracts the storage layer, allowing substitution with other time‑series stores such as InfluxDB, KairosDB, or OpenTSDB without changing the rest of the system.
All sensor data follows a uniform tuple format <sensor, timestamp, value>. On top of this raw data, DCDB provides “virtual sensors,” which are user‑defined arithmetic expressions that can combine multiple physical sensors or other virtual sensors. Virtual sensors support unit conversion, linear interpolation across differing sampling rates, and lazy evaluation (computed only when queried). Results of expensive virtual‑sensor queries are cached back into the storage layer for reuse.
The authors evaluate DCDB on production HPC clusters at the Leibniz Supercomputing Centre (LRZ). Micro‑benchmarks show that individual Pushers, Collect Agents, and the Cassandra backend each add only a few microseconds of overhead per measurement. In a large‑scale test with 10 000 compute nodes and millions of sensor streams, DCDB sustains ingestion rates exceeding 2 million records per second while keeping per‑node memory usage under 5 MiB. Scaling experiments demonstrate near‑linear throughput when increasing the number of Collect Agents and storage nodes, confirming the system’s ability to grow with exascale facilities.
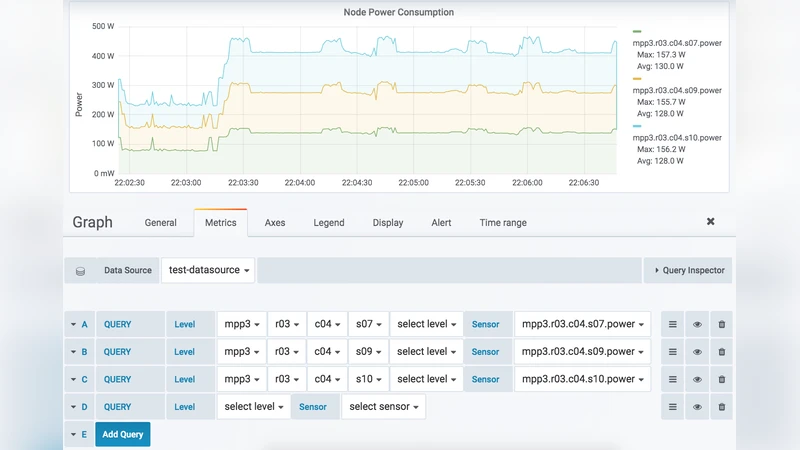
Two real‑world use cases illustrate the practical value of DCDB. The first case focuses on power‑budget enforcement: node‑level power meters and application performance counters are combined to detect when a job exceeds its allocated power envelope. The system automatically triggers throttling actions and, over a month‑long deployment, reduces the overall data‑center Power Usage Effectiveness (PUE) by approximately 3 %. The second case examines energy characterization; by correlating temporal power consumption patterns with workload types, operators can fine‑tune cooling strategies and schedule energy‑intensive jobs during periods of lower ambient temperature, achieving further operational savings.
In conclusion, DCDB delivers a unified, extensible, and low‑overhead monitoring platform that bridges the gap between facility‑level infrastructure sensors and fine‑grained application performance metrics. Its open‑source implementation encourages community contributions and adaptation to diverse HPC environments. Future work outlined by the authors includes integration of machine‑learning‑based anomaly detection, tighter coupling with automated runtime tuning frameworks, enhanced security for sensor data streams, and extending the architecture to hybrid cloud and edge‑computing scenarios.
Comments & Academic Discussion
Loading comments...
Leave a Comment