Global and Local Interpretability for Cardiac MRI Classification
Deep learning methods for classifying medical images have demonstrated impressive accuracy in a wide range of tasks but often these models are hard to interpret, limiting their applicability in clinical practice. In this work we introduce a convoluti…
Authors: James R. Clough, Ilkay Oksuz, Esther Puyol-Anton
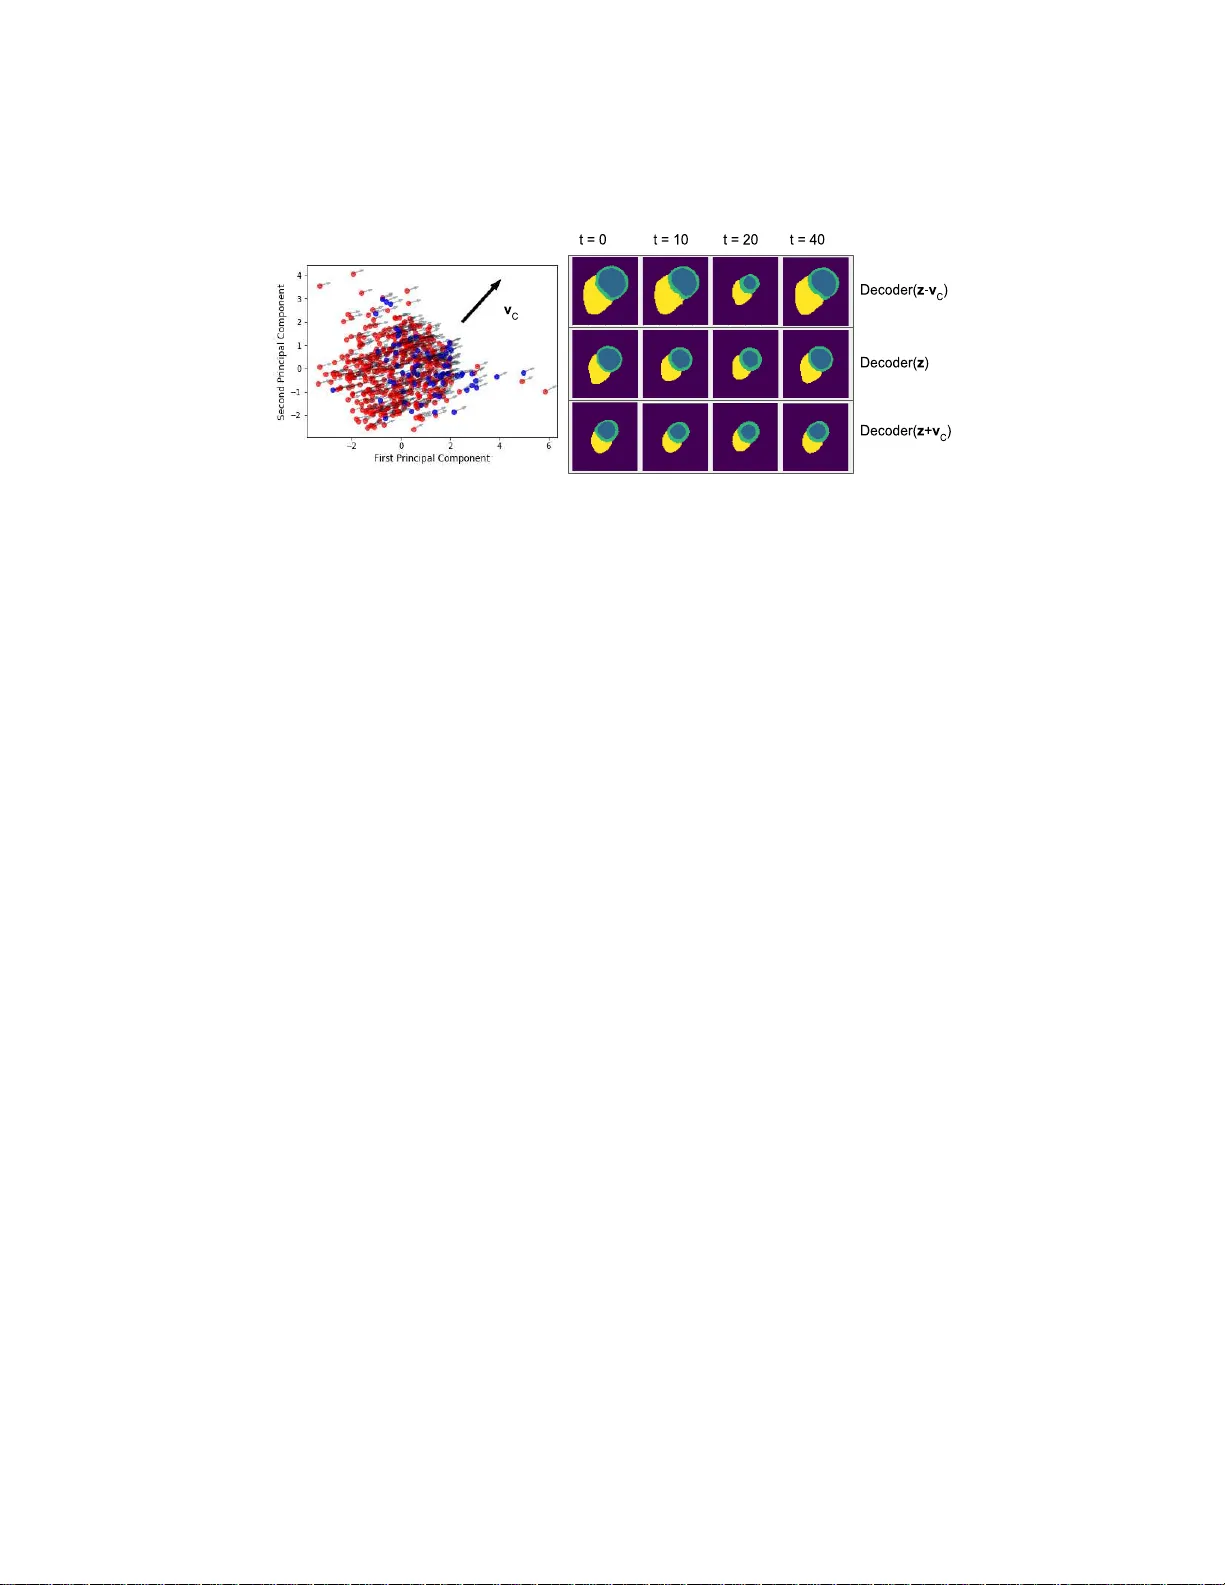
Global and Lo cal In terpretabilit y for Cardiac MRI Classificatio n James R. Clough, Ilk a y Oksuz, Esther Puy ol- Ant´ on, Bram Ruij sink, Andrew P . King, and Julia A. Schnab el School of Biomedical Engineering & Imaging Sciences, King’s Colleg e London, UK james.clou gh@kcl.ac .uk Abstract. Deep learning method s for classifying medical images have demonstrated impressiv e accuracy in a wide range o f tasks but often these models are hard to in terpret, limiting th eir applicability in clinical practice. In this w ork we in tro duce a conv olutional n eural netw ork mod el for identifying disease in temp oral sequences of cardiac MR segmen t a- tions whic h is interpretable in terms of clinicall y famil iar measuremen ts. The model is b ased aroun d a v ariational autoenco der, reducing the inpu t into a lo w-dimensional latent space in whic h classification o ccurs. W e then use t he recently developed ‘concept activ ation vector’ tec h nique to associate concepts whic h are diagnostically meaningful (eg. clinical biomarke rs such as ‘lo w lef t-ven t ricular ejectio n fraction’) to certain vec- tors in the laten t space. These concepts are then qualitatively inspected by observing the change in the image domain resulting from interp ola- tions in the latent space in the d irection of these vec tors. As a result, when th e model classifies images it is also capable of p roviding naturally interpretable concepts relev ant to that classi fication and demonstrating the meaning of th ose concepts in the image domain. Our approac h is demonstrated on the U K Bi obank cardiac MRI dataset where w e detect the presence of coronary artery disease. Keywords: Interpretable ML · Cardiac MRI · Coronary artery disease. 1 In t r o duction Heart disea s e is the le a ding cause of death glo bally . Cardiac magne tic reso- nance (CMR) is the go ld-standard imaging to ol for assessment and diag nosis of many ser ious forms of heart dis e a se [11]. As the p erforma nce of machine lear ning (ML) to ols for image clas s ification has improv ed in recent years [3], the in ter- est in the application of ML to the a na lysis o f CMR images and volumes ha s This work w as supp orted by an EPSRC programme Grant (EP/P001009/ 1) and the W ellcome EPSRC Cen t re for Medical Engineering at the School of Biomedical Engineering and Imaging Sciences, Kings College London (WT 203148 /Z/16/Z). This research has b een condu ct ed using th e UK Biobank Resource under Application Numbers 40119 and 17806. The GPU used in this researc h was generously donated by the NVIDIA Corporation. 2 J. R. Clough et al. grown. Such systems hav e the po ten tia l to provide sig nifican t benefits to pa - tien ts such as improv ed diagnostic quality a nd decr eased time and cost o f image analysis. Ho wev er, ML methods succ e s sfully demonstr ated in a resea rch setting can face barrier s to clinical application due to co ncerns ab out reliability and a lack of interpretabilit y . In particular, deep conv olutio nal neural netw or ks (CNN) hav e prov en powerful to ols for image analysis but their ability to yield adequate explanations o f their decisions to clinicians is still lac king. In terpretable ML mo dels are impor tan t in healthcare for the trust of patients and clinicians, to guard against mo del unreliability in the face of distributiona l shift [10] (e.g. due to a change in scanner design, imag ing pro toco l and pre-pro cessing, or patient demographics ) and for legal rea sons such as a patien t’s ‘right to expla nation’ [5]. In this work we develop a clas sification framework using v ar iational auto en- co ders (V AE) [7] which allows for b oth lo cal and globa l in terpretability of a classification decision. By lo c al interpr etability we mean the ability to as k ‘whic h features of this particular image led to it b eing classified in this particular wa y?’. By glob al interpr etability we mean the ability to ask ‘which common features were generally asso ciated with images assigned to this pa rticular class?’. O ur method first encodes 2D image seg men ta tio ns int o a low-dimensional latent s pace with a V AE and then classifies using the latent vectors. Using concept activ ation vectors [6] in the spa c e o f activ ations in the in ter mediate lay ers of the class ification net- work pr o vides g lobal in ter pretability to the mo del. The V AE contains a decode r which is trained to r econstruct images fro m the latent vectors and so loca l in- terpretability is provided by in terp olating in the latent space and visualising the changes in the corr espo nding deco ded images. This appro ach is demonstr ated using cardiac segmentations, obtained from CMR s tudies in the UK Biobank, and classifying for the pr esence of coronar y arter y diseas e. Our primary contri- bution in this work is the in tegration of lo cal and glo ba l in terpr etabilit y methods in the context of a r e alistic clinical applica tio n. Additionally , our prop osed clas- sification metho d utilises tempo ral information over the full cardiac cycle. This is impor tan t as dynamic features, such a s reg ional and global m yo cardial w all motion, are sensitive mar k ers o f disea s e that a re mis sed when only taking into account images at end-diastolic and/or end-systolic p ositio ns. 2 Related W or k The impor tance of providing in ter pretability to image c lassification mo dels is reflected in the growing b o dy of literatur e around the sub ject. Some classifica- tion mo dels such as simple decision trees or linea r mo dels are co ns idered to b e inherently int erpretable in the sense tha t a h uman o bserver can understand e ach step in the proc ess by w hich a model makes a decision. Unfortunately many ML mo dels which hav e the mos t impressive classifica tion p erformance a nd so a re most desirable to use in clinica l practice do not hav e this prope rt y . When a mo del is too co mplex for its en tire decision pro cess to b e understo o d, int erpretability is still p ossible b y supplementing the output decision with infor- mation which ca n he lp to explain it. Saliency maps [1 5] are a commonly us e d Global and Lo cal Interpretabilit y for Cardiac MRI Classification 3 approach for in terpreting imag e classifica tio n in which the gradient of the los s with res p ect to the input image is visualis ed. Although sa liency maps can b e useful for highlighting r elev a n t regions of images, the level of interpretabilit y that they can provide is often of limited use. Firstly , as ex pla ined in [1], ‘some widely deploye d saliency metho ds ar e indep endent of b oth the data the mo del was tr aine d on, and t he mo del p ar ameters’ , which is clearly undesirable. Secondly , as noted in [12], saliency metho ds only explain ‘where the net work is loo king’. If an image of a dog is misclassified as a cat, and a saliency map highlights the regio n of the imag e containing the dog, we still do not know m uch abo ut why this im- age w as misclass ified. Thirdly , the explanation is only relev ant fo r the particula r image in question and so a n o bserver must manually assess many images and their saliency maps to dr aw more gener al co nclusions [6]. Another family o f appro aches attempts to understand the repres e n ta tio ns learned by intermediate lay ers in a deep CNN by visualising the images which strongly activ ate each neuron [9]. While these methods are helpful for achieving a better understanding of how C NNs work, the imag es pro duced do not t ypically app ear r ealistic a nd so are o ften har d to in ter pret themselv es, appea ring to capture textures more strongly than wider -scale str ucture. Autoenc o der s are neural net works tr ained to find efficient representations of a dataset. They do this with an encoder net work, which maps images to low-dimensional la tent vectors, and a deco der netw ork w hich approximates the original image from the la ten t vector. The repr esen tations learned b y such mo d- els c an b e used to de-noise ima ges or imp o se prior knowledge ab out allow ed structures [8]. In [4] a classification ta sk (detecting h yp ertro phic car diom yopa- th y from CMR volume segmen tations) was perfor med in the latent spa c e of a v a riational autoenco der. This allow ed the classifier to be understo o d beca use o ne can tak e the latent v ector corr espo nding to a patient’s CMR data, and interpo- late it in the direction o f the gra dient of the classifier’s output, and observe the changes to the dec o ded image. Our metho d extends this auto enco de r approach to use the whole cardiac cycle rather than just t wo frames , providing lo cal in- terpretability , and in teg rates it with concept activ a tion vectors [6 ], a metho d for global in ter pretabilit y . 3 Metho ds V AE/Classification net w ork: Our classificatio n mo del is describ ed by the diagram in Figure 1. The model c o nsists fir stly of an enco der which finds a latent repr e s en tation (o f dimensionality 128) for each input. In our case, these inputs are 80 × 8 0 segmentations of 3 central slices in the stack o f short-a xis CMR imag es of the heart, where each slic e is tr eated as a c hannel in the imag e . A deco der netw ork is tra ined to reconstr uct the original data from the la ten t representations. The data for ea c h sub ject consists of T = 50 s egment ations per slice, represe nting one full cardia c cycle. These segmentations ar e mapp ed to T latent vectors by the enco der and the clas sification net w ork then pr edicts the presence of disease from these T la ten t v e ctors us ing fully connected la yers. The 4 J. R. Clough et al. Fig. 1: Diagram showing the architecture of the joint V AE/ classification model. The V AE consists o f a ser ies of residua l conv olutiona l blo cks, with the imag e resolution and num b er of feature maps deno ted in each blo ck. The classification net work consists o f a series of fully connected lay er s (n umber of hidden units in each denoted to the side) which first pro cesses the latent vectors individually , then concatenates them and pr oce s ses them together. vectors a re pro cessed individually and ar e then co ncatenated in to one vector which repres e n ts the state of the whole image sequence. More fully connected lay ers then pro cess this vector to pro duce the classificatio n. W e deno te an input segmentation sequence as X = [ x 1 , x 2 , ... x T ], and its corres p onding laten t mean a nd standar d deviation v ector s as M = [ µ 1 , µ 2 , ...µ T ] and Σ = [ σ 1 , σ 2 , ...σ T ] where ( µ t , σ t ) = Enco der( x t ). The deco ded images are denoted as e X = [ ˜ x 1 , ˜ x 2 , ... ˜ x T ]. During training the deco der is pr ovided samples ˜ x t = Deco der( µ t + σ t ⊙ ν ) where ν ∼ N (0 , I ) is a noise vector and ⊙ denotes element wise multiplication. During inference, the only the mea n is used and so ˜ x t = Deco der( µ t ). The ground truth lab el is denoted by y and the predicted lab el by ˜ y = Classifier( M ). The join t loss function for the V AE and cla ssifier can then b e written as follows: L total = 1 T t = T X t =1 [ L recon ( x t , ˜ x t ) + β L KL ( µ t , σ t )] + γ L class ( y , ˜ y ) (1) for constants β and γ which w e ig h t the comp onent s of the loss function. L recon was chosen to b e the cross-entropy b etw een the input segmentations and the output predictions, and L class the binary cross ent ropy loss for the classifica tion task. L KL is the usual Kullback-Leibler divergence b etw een the latent v a riables and a unit Gaussian, which has the e ffect of p enalising la tent vectors far from the origin and so by pulling each input’s latent vector tow ards the orig in ensures Global and Lo cal Interpretabilit y for Cardiac MRI Classification 5 Fig. 2: Left: Curve o f L V volume over time, with r aw data (crosses), smo othed (curve) and la ndmarks of the car diac cycle a nnotated. Right: Typical cropp ed image sequence with 4 car diac phases shown, and corres p onding segmentations. a smo othness to the latent space. W e train the mo del in tw o stages, firs t using only the V AE lo ss, i.e. γ = 0, and secondly training b oth the V AE and classifier together using γ = 1. W e set β = 0 . 2 thro ughout, chosen by man ual tuning. T he data were augmented during training by randomly applying pixel-wise shifts of up to 5 pix els in the up-down, and left-right directions. Concept Activ ation V ectors: CA V [6] aim to provide explanations fo r a clas- sification netw ork ’s decision in terms of concepts unders ta ndable to a h uman. The net work is trained as usual, and the CA V analysis o ccurs a t test time. Data which do, and do not, contain certain human-understandable c o ncepts are passed through the c lassifier, and the a ctiv atio ns z at a giv e n intermediate hidden layer are r e c orded. F or our exper imen ts this lay er is the fully connec ted lay er with 64 units, lab elled ‘CA V’ in Figur e 1, and the co ncepts are clinic a lly relev ant biomarkers measured from the segment ation. A separate linea r classifier is then trained to distinguish b etw een the activ a tions z pr oduced b y these tw o se ts of inputs. The CA V for a concept c is the normal vector, v c , to this linear classifier. This allows an obs erver to mea sure the sensitivity of the classifier to a co nc e pt understandable to humans by ev a luating the dot pro duct betw een v c and the gradient, a t the la yer of the classifier in question, of the logit v alue of that clas s , ∇ z ˜ y . Here we apply this idea to in terpret cardiac dis ease classification in ter ms of commonly used clinica l bioma r kers. 4 Materials and Exp erimen ts W e demonstrated our a pproach for interpretable classifica tion of CMR using data from the UK Bioba nk [11]. The labels for the cla ssification task w er e derived from the sub ject’s listed medical conditions according to the ICD10 diseas e cla ssifica- tion. Those listed as having any c ondition under I2 1, I22 or I25, cor resp onding to my o car dial infarction and c o ronary artery dis e a se (CAD) were lab elled as po sitiv e. Sub jects who were labelle d a s nega tive for CAD but with other serious 6 J. R. Clough et al. CA V Description ∇ ˜ y · v c > 0 h∇ ˜ y · v c i Lo w EF Ejection F raction 78 . 2% 0.0417 Lo w PER P eak Ejection Rate 88 . 8% 0.0770 Lo w PFR P eak Filling Rate 99 . 6% 0.1560 Lo w APFR Atrial P eak Filling Rate 58 . 2% 0.0048 High L VT V ariance of L V w all thic kening 63 . 4% 0.0156 T able 1: The sensitivity of the class ifier to clinical bioma r kers o f po or cardiac health. A biomarker with no relev ance would have ∇ z ˜ y · v c = 0 on av er age. heart conditions (I00-I5 2 including h yp ertensive heart disease, v a lv e diso rders, congestive he a rt failure etc.) o r who self-rep or ted having previously had a heart attack were excluded from a nalysis a s they could also hav e CAD, or v ery similar symptoms despite not b eing lab elled as s uc h. Using the segmentation metho d of [2] the left ven tricular (L V) my o ca r dium, blo od p oo l, and right ven tricle (R V) were each segmented as shown in the examples in Figure 2. F rom these seg- men tations we c a lculated several es tablished clinical biomarkers of ven tricular function which were then used as p ossible explanatory ‘co ncepts’ in the CA V framework. These metrics were ca lculated from the curve r epresenting bloo d po ol volume over time which was smo othed using a Sa vitzky-Golay filter [1 4], as shown in Figure 2, and desc r ibed in more detail in [13]. The ejection fra ction (EF) is defined as the fractiona l drop in blo o d po o l volume from end-diasto le (ED) to end-systole (ES). The pea k ejection rate (PER), p eak filling ra te (PFR) and p eak atrial filling ra te (P AFR) w ere determined by the magnitude of the maximal gr adient s of the blo o d po ol volume ov er time in the relev ant parts of the car diac cycle, with the atrial co n tribution (AC) determined by the inflec- tion point in this curve. L V wall thick ening w as defined as the v a riance of L V m yocardia l thick ening during co n tr action, observed b et w een six predefined seg- men ts per image slice. This meas ure indica tes the presence of lo calised changes in my o ca rdial con tr action, and is indica tiv e of p o or car diac health in the h yp oki- netic regio n. A rigoro us quality c o n trol pro cess was use d to remov e low quality segmentations, which w er e t ypically asso ciated with a rtefacts in the orig inal im- ages. Sub jects with sho r t-axis image stacks that did not cov er the full L V, o r int ersect the ap ex and/o r mitral v alve plane were disca rded. Physiologically un- realistic segmentations were detected from the L V volume curve, determined by their having a differe nce of > 10% in ven tr ic ular volume b et ween the first and last segmentation in the cycle. The fina l dataset had a to tal of 10,816 sub jects, of which 778 were lab e lle d with CAD. These data were split in to a training set of 5,316 sub jects (708 pos- itive, 4,60 8 negative), test set (70 p ositive, 430 negative) and a held out set o f 5,000 CAD-negative s ub jects used for the CA V a nalysis. The final trained bi- nary cla ssifier had an AUC o f 0.78, and the reconstructed se g men tations had an av erage Dice Score of 0.93 with r eference to the input seg men tations, sug- gesting that the enco der and deco der netw orks w ere acc urately ma pping from segmentations to latent vectors and back. The sets of image s describing each Global and Lo cal Interpretabilit y for Cardiac MRI Classification 7 Fig. 3: Left: PCA of the laten t spac e vectors for the 500 test cases , wher e blue are positive for CAD. Each p oin t’s arrow shows the gradient of the clas s ification logit. F or the concept ‘low p eak ejection rate’ the CA V v c is sho wn. Right: F or a real test cas e the activ a tions z h are calculated. By adding ± v c and decoding the latent vectors the effect o f this concept is vis ible in the image do main, showing noticeable c hang es in L V contraction. F our of the 50 fra mes in each seq ue nc e are shown here. hu man-interpretable concept were determined a s follows. In the held-out set of 5000 sub jects the 1 000 ca s es with the highest and the low est recorded quantities of the given concept were used as the p ositively-labe lle d and negatively-lab elled cases for each concept. T o test the CA V co ncepts the dot pr oduct b etw een the gradient of the classification decision with resp ect to the activ a tio ns ∇ z ˜ y , and the concept activ ation vector v c was mea sured for eac h case in the test set. T able 1 s ho ws the prop ortion o f ca ses in whic h ∇ z ˜ y · v c > 0 , (meaning the concept had a p ositive impact on classification for the dis e ase), and its mea n v alue. Figure 3 shows a n example of a latent-space interpola tion in the direction of the ‘low pea k ejection rate’ conce pt. A subset of the frames are shown here but the full cardiac cycle is av ailable in the supplementary material. 5 Discussion and Conclusions Our mo del not only p erfor ms clas sification, but also allows interpretation of features imp ortant during classification. Utilising CA V to interrogate the im- po rtance o f well established biomarkers we found tha t bioma rkers relating to ven tricular ejection a nd filling rates had a large co n tr ibution sugg e s ting that the classifier netw o rk identifies these clinically relev a n t features as significant. La- ten t space in ter pola tions in the direction of the concept activ a tion vectors, suc h as that in Figure 3 illustrate the ability of our metho d to describ e its learned features, providing evide nc e that these vectors in the latent space corresp ond to t ypical clinical int erpretations of these bio markers. Int erpretable mo dels do not just offer clinicians a well-calibrated estimate of the likeliho od of disease. I nterpretability us ing known biomar k ers allows the 8 J. R. Clough et al. mo del’s prediction to be plac ed in the con text of curr en t medical kno wle dge and clinical decision-making guidelines, which is a key part of tr anslation in to clinica l practice. It also ha s the p otential to improve care by sugges ting ex planatory factors in a n image tha t may hav e b een missed or disregar ded by a h uma n. In future work w e aim to inv es tig ate which k inds o f mo del interpretabilit y are p erceived a s most informative a nd trust w orthy by clinicians, and study the accuracy / in terpretability trade-o ff. W e exper imen ted with using recurrent units such as an LSTM in the classification netw ork to pro cess the time series of la ten t vectors, but found that simply concatenating them gave a super ior cla ssification per formance. Nonetheless mor e sophisticated ar c hitectures whic h more direc tly make use of the temp oral correlatio ns b et w een frames sho uld b e inv estigated. W e also trained our mo del to r e construct and predict from raw CMR images rather than segmentations. While c la ssification p erformance was compara ble (AUC of 0.81) the q ualit y of reco nstructed images and latent space interpolatio ns w a s no t high enough (due to image blurring ) to be co nsidered usefully in terpr etable. W e hop e to extend our appr o ach to the imag e domain using adversarial training to ensure high-quality imag e reconstr uctions which can then b e used to visualise bo th s tructural and textura l features relev a nt to the clas sification. References 1. Adebay o, J., Gilmer, J., Muelly , M., Good fello w, I., Hardt, M., K im, B.: Sanit y chec ks fo r saliency maps. In: Adv ances in Neural I nformation Processing Systems. pp. 9525–953 6 (2018) 2. Bai, W., Sinclair, M., T arroni, G., Oktay , O., Ra jchl, M., V aillant, G., Lee, A.M., Aung, N., Luk asc huk, E., Sanghvi, M.M., et al.: Automated cardio v ascular mag- netic resonance image analysis with fully convolutio nal netw orks. Journal of Car- dio v ascular Magnetic R esonance 20 (1), 65 (2018) 3. Bernard, O., Lalande, A., Zotti, C., Cervenansky , F., Y ang, X., H en g, P ., Cetin, I., Lek adir, K., Camara, O., Ballester, M., Zemrak, F.: Deep learning techniques for automatic MRI cardiac multi-structures segmen tation and d iagnosis : Is the problem solv ed ? IEEE transactions on medical imaging 37 (11), 2514–2525 (2018) 4. Biffi, C., O kta y , O., T arroni, G., Bai, W., De Marv ao, A., Doumou, G., Ra jchl, M., Bedair, R., Prasad, S., Cook, S., et al.: Learning interpretable anatomical features through deep generative mod els: App licatio n t o cardiac remodeling. In: International Conference on Medical Image Computing and Computer-A ssisted Interv ention. pp. 464–47 1. S pringer (2018) 5. Goo dman, B., Flaxman, S.: EU regulations on algorithmic decision-making and a right t o explanation. In: ICML w orkshop on human interpretabili ty in machine learning (WHI 2016), New Y ork, NY. (2016) 6. Kim, B., W attenberg, M., Gilmer, J., Cai, C., W exler, J., Viegas, F., Sayres, R.: Interpretabilit y beyond feature attribution: Qu an titative testing with concept ac- tiv ation vectors (TCA V). arXiv:1711.11 279 (2017) 7. Kingma, D., W elling, M.: Au to-Encodin g V ariational Bay es. arXiv p reprin t arXiv:1312.61 14 (2013) 8. Oktay , O., F errante, E., Kamnitsas, K., Heinric h , M., Bai, W., Caballero, J., Co ok, S.A., De Marv ao, A., Daw es, T., ORegan, D .P ., et al.: Anatomically constrained Global and Lo cal Interpretabilit y for Cardiac MRI Classification 9 neural netw orks (acnns): application to cardiac image enhancement and segmen- tation. IEEE transactions on medical imaging 37 (2), 384–3 95 ( 2018) 9. Olah, C., Saty anaray an, A., Johnson, I., Carter, S., Sch u bert, L., Y e, K., Mordvintsev, A.: The building b locks of interpretabilit y . Distill (2018), https://dis till.pub/2018/building-blocks 10. P atel, V., Gopalan, R., L i, R., Chella ppa, R.: Visual domain adapt ation: A surve y of recent adv ances. IEEE signal pro cessing magazine 32 (3), 53–69 (2015) 11. P etersen, S.E., Matthews, P .M., F rancis, J.M ., Robson, M.D., Zemrak, F., Boub er- takh, R., Y oung, A.A., Hudson, S., W eale, P ., Garratt, S., Collins, R., Piec hn ik, S., Neubauer, S.: UK Biobanks cardiov ascular magnetic resonance protocol. Journal of cardio vas cular magnetic resonance 18 (1), 8 (2015) 12. Rudin, C.: Please stop explaining b lack b ox mo dels fo r high stak es decisi ons. arXiv:1811.10 154 (2018) 13. Ruijsink, B., Puyol-Ant´ on, E., Oksuz, I., S inclair, M., Bai, W., Schnabel, J.A., Raza vi, R., King, A.P .: F ully automated, quality-con t rolled cardiac analysis from cmr: V alidation and large-scale app lication to c haracterize cardiac function. JACC : Cardio va scular Imaging (2019) 14. Sa vitzky , A., Gola y , M.J. : Smo othing and differentiation of data b y simplified least squares pro cedures. Analytical chemistry 36 (8), 1627–1639 ( 1964) 15. Simon yan, K., V edaldi, A., Zisserman, A .: Deep inside con vol utional netw orks: Visualising imag e classificati on mo dels and saliency maps. arXiv:131 2.6034 (2013)
Original Paper
Loading high-quality paper...
Comments & Academic Discussion
Loading comments...
Leave a Comment