Multiple Human Association between Top and Horizontal Views by Matching Subjects Spatial Distributions
Video surveillance can be significantly enhanced by using both top-view data, e.g., those from drone-mounted cameras in the air, and horizontal-view data, e.g., those from wearable cameras on the ground. Collaborative analysis of different-view data …
Authors: Ruize Han, Yujun Zhang, Wei Feng
Multiple Human Association between T op and Horizontal V iews by Matching Subjects’ Spatial Distrib utions Ruize Han, Y ujun Zhang, W ei Feng ∗ , Chenxing Gong, Xiaoyu Zhang, Jie wen Zhao, Liang W an, Song W ang School of Computer Science and T echnology , T ianjin Uni versity , Tianjin, China Abstract V ideo surveillance can be significantly enhanced by us- ing both top-view data, e.g ., those fr om dr one-mounted cameras in the air , and horizontal-view data, e .g., those fr om wearable cameras on the gr ound. Collabor ative anal- ysis of differ ent-view data can facilitate various kinds of ap- plications, such as human trac king, person identification, and human activity r ecognition. However , for such collabo- rative analysis, the first step is to associate people, r eferr ed to as subjects in this paper , acr oss these two vie ws. This is a very challenging pr oblem due to lar ge human-appearance differ ence between top and horizontal views. In this paper , we pr esent a ne w appr oach to address this pr oblem by e x- ploring and matching the subjects’ spatial distrib utions be- tween the two views. More specifically , on the top-view im- age , we model and match subjects’ relative positions to the horizontal-view camera in both views and define a matching cost to decide the actual location of horizontal-view cam- era and its view angle in the top-view image. W e collect a new dataset consisting of top-view and horizontal-view im- age pairs for performance evaluation and the experimental r esults show the effectiveness of the pr oposed method. 1. Introduction The advancement of mo ving-camera technologies pro- vides a ne w perspective for video surveillance. Unmanned aerial vehicles (U A Vs), such as drones in the air , can pro- vide top views of a group of subjects on the ground. W ear- able cameras, such as Google Glass and GoPro, mounted ov er the head of a wearer (one of the subjects on the ground), can pro vide horizontal views of the same group of subjects. As shown in Fig. 1 , the data collected from these two views well complement each other – top-view images contain no mutual occlusions and well e xhibit a global picture and the relativ e positions of the subjects, while horizontal-view images can capture the detailed ap- pearance, action, and beha vior of subjects of interest in a much closer distance. Clearly , their collaborative analysis can significantly impro ve the video-surveillance capabili- T op-view Horizontal -view Figure 1. An illustration of the top-vie w (left) and horizontal-view (right) images. The former is taken by a camera mounted to a drone in the air and the latter is taken by a GoPro worn by a wearer who w alked on the ground. The proposed method identifies on the top-view image the location and view angle of the camera (indi- cated by red box) that produces the horizontal-vie w image, and associate subjects, indicated by identical color box es, across these two videos. ties such as human tracking, human detection, and activity recognition. The first step for such a collaborati ve analysis is to ac- curately associate the subjects across these two vie ws, i.e., we need to identify any person present in both vie ws and identify his location in both vie ws, as sho wn in Fig. 1 . In general, this can be treated as a person re-identification (re- id) problem – for each subject in one view , re-identify him in the other vie w . Howe ver , this is a very challenging per- son re-id problem because the same subject may show to- tally different appearance in top and horizontal vie ws, not to mention that the top view of subjects contains very limited features by only showing the top of heads and shoulders and it can be very dif ficult to distinguish dif ferent subjects from their top views, as sho wn in Fig. 1 . Prior works [ 1 , 2 , 3 ] tried to alle viate the challenge of this problem by assuming 1) the view direction of the top-view camera in the air has certain slope such that subjects’ body , and even part of the background, are still partially visible in top views and can be used for feature matching to the horizontal views, and 2) the view angle of the horizontal- view camera on the ground is consistent with the moving direction of the camera wearer and can be easily estimated by computing optical flow in the top-view videos This can be used to identify the on-the-ground camera wearer in the top-view video. These two assumptions, howe ver , limit the 1 their applicability in practice, e.g., the horizontal-view cam- era wearer may turn head (and therefore the head-mounted camera) when he walks, leading to inconsistency between his moving direction and wearable-camera vie w direction. In this paper, we de velop a ne w approach to associate subjects across top and horizontal views without the above two assumptions. Our main idea is to explore the spatial distribution of the subjects for cross-vie w subject associa- tion. From the horizontal-view image, we detect all the sub- jects, and estimate their depths and spatial distribution us- ing the sizes and locations of the detected subjects, respec- tiv ely . On the corresponding top-view image, we trav erse each detected subject and possible direction to localize the horizontal-view camera (wearer), as well as its view angle. For each trav ersed location and direction, we estimate the spatial distrib ution of all the visible subjects. W e finally de- fine a matching cost between the subjects’ spatial distrib u- tions in top and horizontal views to decide the horizontal- view camera location and vie w angle, with which we can associate the subjects across the two vie ws. In the exper - iments, we collect a new dataset consisting of image pairs from top and horizontal-views for performance e v aluation. Experimental results verify that the proposed method can effecti vely associate multiple subjects across top and hori- zontal views. The main contributions of this paper are: 1) W e propose to use the spatial distribution of multiple subjects for as- sociating subjects across top and horizontal views, instead of using subject appearance and motions in prior works. 2) W e develop geometry-based algorithms to model and match the subjects spatial distrib utions across top and hor- izontal views. 3) W e collect a new dataset of top-view and horizontal-view images for ev aluating the proposed cross- view subject association. The remainder of this paper is organized as follo ws. Sec- tion 2 revie ws the related work. Section 3 elaborates on the proposed method and Section 4 reports the e xperimental re- sults, followed by a brief conclusion in Section 5 . 2. Related W ork Our work can be regarded as a problem of associating first-person and third-person cameras, which has been stud- ied by many researchers. For example, Fan et al. [ 4 ] iden- tify a first-person camera wearer in a third-person video by incorporating spatial and temporal information from the videos of both cameras. In [ 5 ], information from first- and third-person cameras, together with laser range data, is fused to improv e depth perception and 3D reconstruction. Park et al. [ 14 ] predict gaze behavior in social scenes using both first- and third-person cameras. In [ 22 ], first- and third- person cameras are synchronized, followed by associating subjects between their videos. In [ 18 ], a first-person video is combined to multiple third-person videos for more reli- able action recognition. The third-person cameras in these methods usually bear horizontal views or vie ws with cer- tain slope angle. Differently , in this paper the third-person camera is mounted on a drone and produces top-view im- ages, making cross-view appearance matching a very diffi- cult problem. As mentioned above, cross-vie w subject association can be treated as a person re-id problem, which has been widely studied in recent years. Most existing re-id methods can be grouped into two classes: similarity learning and represen- tation learning. The former focuses on learning the simi- larity metric, e.g., the in v ariant feature learning based mod- els [ 10 , 16 , 23 ], classical metric learning models [ 9 , 13 , 7 ], and deep metric learning models [ 11 , 21 ]. The latter fo- cuses on feature learning, including low-le vel visual fea- tures such as color , shape, and texture [ 8 , 12 ], and more recent CNN deep features [ 24 , 20 ]. These methods assume that all the data are taken from horizontal vie ws, with sim- ilar or dif ferent horizontal view angles, and almost all of these methods are based on appearance matching. In this paper , we attempt to re-identify subjects across top and hor- izontal views, where appearance matching is not an appro- priate choice. More related to our work is a series of recent works by Ardeshir and Borji [ 1 , 2 , 3 ] on building association between top-view and horizontal-view cameras. In [ 1 , 2 ], by jointly handling a set of egocentric (first-person) horizontal-view videos and a top-view video, a graph-matching based algo- rithm is dev eloped to locate all the horizontal-view camera wearers in the top-vie w video. In [ 3 ], the problem is ex- tended to locate not only the camera wearers, b ut also other horizontal-view subjects in the top-view video. Ho wev er , as mentioned abov e, these methods are based on two as- sumptions: 1) the top-vie w camera bears certain slope an- gle to enable the partial visibility of human body and the use of appearance matching for cross-vie w association, and 2) the looking-at direction of the horizontal-view camera is the same as the mo ving direction of the camera wearer . In this paper , we remove these two assumptions and lev erage the spatial distribution of subjects for cross-vie w subject as- sociation. The methods de veloped in [ 1 , 2 , 3 ] require multi- frame video inputs since it needs to estimate each subject’ s moving direction, while our method can associate a single frame in top vie w and its corresponding frame in horizontal view . 3. Proposed Method In this section, we first gi ve an o vervie w of the proposed method and then elaborate on the main steps. 3.1. Overview Giv en a top-vie w image and a horizontal-view image that are taken by respecti ve cameras at the same time, we detect P 1 P 2 O P 3 Q 1 Q 2 Q 3 min x % W 1 h 2 h 3 h t y h y t x h x 1 ˆ x min ˆ x 2 ˆ x 3 ˆ x max ˆ x f 1 x % 2 x % 3 x % max x % ( a ) ( b ) Figure 2. An illustration of vector representation in (a) top vie w and (b) horizontal view . all persons (referred to as subjects in this paper) on both images by a person detector [ 15 ]. Let T = { O top i } N i =1 be the collection of N subjects detected on the top-vie w im- age, with O top i being the i - th detected subject. Similarly , let E = { O hor j } M j =1 be the collection of M subjects detected on the horizontal-view image, with O hor j being the j - th de- tected subject. The goal of cross-vie w subject association is to identify all the matched subjects between T and H that indicate the the same persons. In this paper , we address this problem by exploring the spatial distributions of the detected subjects in both vie ws. More specifically , from each detected subject O top i in the top vie w , we infer a vector V top i = ( x top i , y top i ) that reflects its relativ e position to the horizontal-view camera (wearer) on the ground. Then for each detected subject O hor j in the horizontal view , we also infer a vector V hor j = ( x hor j , y hor j ) to reflect its relativ e position to the horizontal-vie w cam- era on the ground. W e associate the subjects detected in two vie ws by seeking matchings between two vector sets V top ( T , θ , O ) = { V top i } N i =1 and V hor ( E ) = { V hor j } M j =1 , where O and θ are the location and view angle of the horizontal-view camera (wearer) in the top-vie w image and they are unknown priorly . Finally , we define a matching cost function φ to measure the dissimilarity between the two vector sets and optimize this function for finding the matching subjects between two views, as well as the cam- era location O , and camera view angle θ . In the following, we elaborate on each step of the proposed method. 3.2. V ector Representation In this section, we discuss ho w to deri ve V top and V hor . On the top-view image, we first assume that the horizontal- view camera location O and its vie w angle θ are given. This way , we can compute its field of vie w in the top-vie w im- age and all the detected subjects’ relativ e positions to the horizontal-view camera on the ground. Horizontal-view im- age is egocentric and we can compute the detected subjects’ relativ e positions to the camera based on the subjects’ sizes and positions on the horizontal-view image. 3.2.1 T op-V iew V ector Representation As shown in Fig. 2 (a), in the top-view image we can easily compute the left and right boundaries of the field of view of the horizontal-view camera, denoted by * L , * R , respec- tiv ely , based on the giv en camera location O and its view angle θ . For a subject at P in the field of view , we estimate its relativ e position to the horizontal-view camera by using two geometry parameters ˆ x and ˆ y , where ˆ x is the (signed) distance to the horizontal-vie w camera along the (camera) right direction * V , as shown in Fig. 2 (a) and ˆ y is the depth. Based on pinhole camera model, we can calculate them by ( ˆ x = f cot h * O P , * V i ˆ y = | * O P | · sin h * O P , * V i , (1) where h· , ·i indicates the angle between two directions and f is the focus length of horizontal-vie w camera. Next we consider the range of ˆ x . From Fig. 2 (a), we can get ( ˆ x min = f cot h * L, * V i = f cot( π + α 2 ) ˆ x max = f cot h * R, * V i = f cot( π − α 2 ) , (2) where α ∈ [0 , π ] is the given field-of-vie w angle of the horizontal-view camera as indicated in Fig. 2 (a). From Eq. ( 2 ), we hav e ˆ x max = − ˆ x min > 0 . T o enable the matching to the vector representation from the horizontal view , we further normalize the v alue range of ˆ x to [ − 1 , 1] , i.e., x top = ˆ x f cot( π − α 2 ) y top = ˆ y . (3) W ith this normalization, we actually do not need the actual value of f in the proposed method. Let O top k , k ∈ K ⊂ { 1 , 2 , · · · , N } be the subset of de- tected subjects in the field of view in the top-view image. W e can find the vector representation for all of them and sort them in terms of x top values in an ascending order . W e then stack them together as V top = ( x top , y top ) ∈ R |K|× 2 (4) where |K| is the size of K , and x top and y top are the column-wise v ectors of all the x top and y top values of the subjects in the field of view , respectiv ely . 3.2.2 Horizontal-V iew V ector Representation For each subject in the horizontal-vie w image, we also com- pute a vector representation to mak e it consistent to the top- view vector representation, i.e., x -value reflects the distance to the horizontal-view camera along the right direction and y -v alue reflects the depth to the horizontal-view camera. As shown in Fig. 2 (b), in the horizontal-view image, let Q = ( ˜ x, ˜ y ) and h be the location and height of a detected subject, respectiv ely . If we take the top-left corner of the image as the origin of the coordinate, ˜ x − W 2 , with W being the width of the horizontal-view image, is actually the sub- ject’ s distance to the horizontal-vie w camera along the right direction. T o facilitate the matching to the top-view vectors, we normalize its value range to [ − 1 , 1] by x hor = ˜ x − W 2 W 2 y hor = 1 h , (5) where we simply take the in v erse of the subject height as its depth to the horizontal-view camera. For all M detected subjects in the horizontal-view im- age, we can find their vector representations and sort them in terms of x hor values in an ascending order . W e then stack them together as V hor = ( x hor , y hor ) ∈ R M × 2 (6) where x hor and y hor are the column-wise vectors of all the x hor and y hor values of the M subjects detected in the horizontal-view image, respecti vely . 3.3. V ector Matching In this section we associate the subjects across two views by matching the vectors between the two v ector sets V top and V hor . Since the x values of both vector sets have been normalized to the range of [ − 1 , 1] , they can be directly com- pared. Howe ver , the y values in these two vector sets are not comparable, although both of them reflect the depth to the horizontal-view camera: y top values are in terms of num- ber of pixels in the top-view image while y hor values are in terms of the number of pixels in the horizontal-view im- age. It is non-tri vial to normalize them into a same scale giv en their errors in reflecting the true depth – it is a very rough depth estimation by using y hor since it is very sensi- tiv e to subject detection errors and height difference among subjects. W e first find reliable subset matchings between x top and x hor and use them to estimate the scale difference between their corresponding y v alues. More specifically , we find a scaling factor µ to scale y top values to mak e them compara- ble to the y hor values. For this purpose, we use a RANSA C- alike strategy [ 6 ]: for each element x top in V top , we find the nearest x hor in V hor . If | x top − x hor | is less than a very small threshold value, we consider x top and x hor a matched pair and tak e the ratio of their corresponding y v alues and the average of this ratio ov er all the matched pairs is taken as the scaling factor µ . W ith the scaling factor µ , we match V top and V hor using dynamic programming (DP) [ 17 ]. Specifically , we define a dissimilarity matrix D of dimension |K| × M , where D ij is the dissimilarity between V top i and V hor j and it is defined by D ij = λ | x top i − x hor j | + | µy top i − y hor j | , (7) where λ > 0 is a balance factor . Giv en that x top and x hor are both ascending sequences, we use dynamic pro- gramming algorithm to search a monotonic path in D from D 1 , 1 to D |K| ,M to build the matching between V top and V hor with minimum total dissimilarities. If a vector V top matches to multiple vectors in V hor , we only keep one with the smallest dissimilarity giv en in Eq. ( 7 ). After that, we check if a vector V hor matches to multiple vectors in V top and we keep one with the smallest dissimilarity . These two- step operations will guarantee the resulting matching is one- on-one and we denote γ to be the number of final matched pairs. Denote the resulting matched vector subsets to be V top ∗ = ( x top ∗ , y top ∗ ) and V hor ∗ = ( x hor ∗ , y hor ∗ ) , both of di- mension γ × 2 . W e define a matching cost between V top and V hor as φ ( V top , V hor ) = 1 γ ρ L γ ( λ k x top ∗ − x hor ∗ k 1 + k µ y top ∗ − y hor ∗ k 1 ) , (8) where ρ > 1 is a pre-specified factor and L = max( |K| , M ) . In this matching cost, the term ρ L γ encour- ages the inclusion of more v ector pairs into the final match- ing, which is important when we use this matching cost to search for optimal camera location O and view angle θ to be discussed next. 3.4. Detecting Horizontal-V iew Camera and V iew Angle In calculating the matching cost of Eq. ( 8 ), we need to know the horizontal-vie w camera location O and its view angle θ to compute the vector V top . In practice, we do not know O and θ priorly . As mentioned earlier , we e x- haustiv ely try all possible v alues for O and θ and then se- lect the ones that lead to the minimum matching cost φ . The matching with such minimum cost provides us the final cross-view subject association. For view angle θ , we sample the its range [0 , 2 π ) uniformly with an interval of ∆ θ and in the experiments, we will report results by using different sample intervals. For the horizontal-view camera location O , we simply try e very subject detected in the top-vie w im- age as the camera (wearer) location. An occlusion in the horizontal-vie w image indicates that two subjects and the horizontal-view camera are collinear, as sho wn by P 1 and P 2 in Fig. 3 (a). In this case, the subject with larger depth, i.e., P 2 , is not visible in the horizontal view and we simply ignore this occluded subject in vec- tor representation of V top . In practice, we set a tolerance threshold β = 2 ◦ and if h * O P 1 , * O P 2 i < β , we ignore the ( ) b P 1 P 2 ( ) a O Figure 3. An illustration of mutual occlusion in the horizontal view . (a) T op-view image and (b) horizontal-vie w image. one with larger depth. The entire cross-vie w subject associ- ation algorithm is summarized in Algorithm 1 . Algorithm 1: Cross-V iew Subject Association: Input: T , H : Subjects detected in top vie w and horizontal view respecti vely; parameters ρ , λ . Output: Matched vector pair V top ∗ and V hor ∗ ; camera location O ∗ ; camera-view angle θ ∗ . 1 Compute the horizontal-view vector V hor by Eq. ( 6 ) ; 2 for O ∈ T do 3 for θ ∈ [0 , 2 π ) , with step length ∆ θ do 4 Compute the top-view v ector V top by Eq. ( 4 ) ; 5 Estimate scaling µ as discussed in Section 3.3 . 6 Calculate D by Eq. ( 7 ) using µ and λ ; 7 Calculate V top , V hor based on D by DP algorithm; 8 Calculate φ by Eq. ( 8 ) 9 Find θ with the minimum φ ; 10 return O ∗ , θ ∗ , V top ∗ and V hor ∗ with the minimum φ . 4. Experiment In this section, we first describe the dataset used for per- formance e valuation and then introduce our experimental results. 4.1. T est Dataset W e do not find publicly av ailable dataset with corre- sponding top-vie w and horizontal-vie w images/videos and ground-truth labeling of the cross-vie w subject associa- tion. Therefore, we collect a new dataset for performance ev aluation. Specifically , we use a GoPro HER O7 cam- era (mounted over wearer’ s head) to take horizontal-view videos and a DJI “yu” Mavic 2 drone to take top-view videos. Both cameras were set to hav e the same fps of 30. W e manually synchronize these videos such that corre- sponding frames between them are taken at the same time. W e then temporally sample these two videos uniformly to construct frame (image) pairs for our dataset. V ideos are taken at three different sites with dif ferent background and the sampling interval is set to 100 frames to ensure the v a- riety of the collected images. Finally , we obtain 220 image pairs from top and horizontal views, and for both views, the 0 20 40 60 80 100 120 140 160 180 0 20 40 60 80 100 120 hor top 1 2 6 5 4 3 11 10 9 8 7 7 13 12 ( . , . ] 0 3 0 4 ( . , . ] 0 4 0 5 ( . , . ] 0 5 0 6 [ . , . ] 0 0 0 1 ( . , . ] 0 1 0 2 ( . , . ] 0 2 0 3 ( . , . ] 0 6 0 7 ( . , . ] 0 7 0 8 ( . , . ] 0 8 0 9 ( . , . ] 0 9 1 0 hor top n u m be r o f s ub j e c t s p r o po r t i o n o f s h ar e d s u b j e c ts ( a ) ( b ) n um b e r of i m a ge s n um b e r of i m a ge s Figure 4. (a) Histogram of the cro wdedness in top- and horizontal- view images, respectively . (b) Histogram of the proportion of the shared subjects in top- and horizontal-view images, respecti vely . image resolution is 2 , 688 × 1 , 512 . W e label the same per- sons across two videos on all 220 image pairs. Note that, this manual labeling is quite labor intensiv e gi ven the dif- ficulty in identifying persons in the top-view images (see Fig. 1 for an example). For ev aluating the proposed method more comprehen- siv ely , we examine all 220 image pairs and consider the following five attributes: Occ : horizontal-view images containing partially or fully occluded subjects; Hor mov : the horizontal-view images sampled from videos when the camera-wearer mov es and rotates his head. Hor rot : the horizontal-view images sampled from videos when the camera-wearer rotates his head. Hor sta : the horizontal- view images sampled from videos when the camera-wearer stays static. TV var : the top-vie w images sampled from videos when the drone moves up, do wn and/or change camera-view direction. T able 1 shows the number of im- age pairs with these five attributes, respectiv ely . Note that some image pairs show multiple attrib utes listed above. T able 1. Number of image pairs with the considered attributes. Attribute Occ Hor mov Hor r ot Hor sta TV var # image pairs 96 62 124 96 30 For each pair of images, we analyze two more proper- ties. One is the number of subjects in an image, which re- flects the lev el of crowdedness. The other is the proportion between the number of shared subjects in two views and the total number of subjects in an image. Both of them can be computed against either the top-view image or the horizontal-view image and their histograms on all 220 im- age pairs are shown in Fig. 4 . In this paper , we use two metrics for performance e v al- uation. 1) The accuracy in identifying the horizontal-view camera wearer in the top-view image, and 2) the precision and recall of cross-vie w subject association. W e do not in- clude the camera-vie w angle θ for e valuation because it is difficult to annotate its ground truth. 4.2. Experiment Setup W e implement the proposed method in Matlab and run on a desktop computer with an Intel Core i7 3.4GHz CPU. W e use the general YOLO [ 15 ] detector to detect sub- jects in the form of bounding boxes in both top-vie w and horizontal-view images 1 . The pre-specified parameters ρ and λ are set to 25 and 0.015 respectively . W e will further discuss the influence of these parameters in Section 4.4 . W e did not find av ailable methods with code that can directly handle our top- and horizontal-vie w subject asso- ciation. One related work is [ 3 ] for cross-view matching. Howe ver , we could not include it directly into comparison because 1) its code is not a vailable to public, and 2) it com- putes optical flow for θ and therefore cannot handle a pair of static images in our dataset. Actually , the method in [ 3 ] as- sumes a certain slope view angle of the top-view camera and use appearance matching for cross association. This is simi- lar to the appearance-matching-based person re-id methods. In this paper , we chose a recent person re-id method [ 19 ] for comparison. W e take each subject detected in the horizontal-view image as query and search it in the set of subjects detected in the top-vie w image. W e tried two ver- sions of this re-id method: one is retrained from scratch us- ing 1,000 sample subjects collected by ourselv es (no over - lap with the subjects in our test dataset) and the other is to fine-tune from the version provided in [ 19 ] these 1,000 sample subjects. 4.3. Results W e apply the proposed method to all 220 pairs of images in our dataset. W e detect the horizontal-vie w camera wearer on the top-vie w image as described in 3.4 and the detection accuracy is 84.1%. W e also use the Cumulative Matching Characteristic (CMC) curve to ev aluate the matching accu- racy , as sho wn in Fig. 5 (a), where the horizontal and vertical axes are the CMC rank and the matching accuracy respec- tiv ely . For a pair of images, we use the precision and recall scores to e valuate the cross-view subject association. As shown in T able 2 , the average precision and recall scores of our method are 79.6% and 77.0% respectiv ely . In this table, ‘Ours w O ’ indicates the use of our method by gi v- ing the ground-truth camera location O . W e can find in this table that the re-id method, either retrained or fune-tuned, produces v ery poor result, which confirms the dif ficulty in using appearance features for the proposed cross-view sub- ject association. W e also calculate the proportion of all the image pairs with precision or recall score of 1 (Prec.@1 and Reca.@1). 1 W e use the Y OLOv3 version detector . For top-view subject detection, we fine-tune the network using 600 top-view human images that have no overlap with our test images. 0 0.1 0.2 0.3 0.4 0.5 0.6 0.7 0.8 0.9 1 Pr ec . ( w O) Pr e Re c. (w O ) Pr ec . Re c. 0 0 1 . 0.2 0.3 0.4 0.5 0.6 0.7 0.8 0.9 1.0 0 0 1 . 0.2 0.3 0.4 0.5 0.6 0.7 0.8 0.9 1.0 0 0.1 0.2 0.3 0.4 0.5 0.6 0.7 0.8 0.9 1 C MC r a nk ( a) m at c hi n g a cc u ra c y p ro p or t i on p re c is i o n or r e ca l l s co r e ( b) Figure 5. (a) The CMC curv e for horizontal-view camera detec- tion. (b) Precision and recall scores in association, where the hor- izontal axis denotes a precision or recall score x , and the vertical coordinate denotes the proportion of image pairs with correspond- ing precision or recall score that is greater than x . T able 2. Comparative results of different methods. Prec.A vg and Reca.A vg are the a verage precision and recall scores over all image pairs. Prec.@1 and Reca.@1 are the proportion of image pairs with precision and recall scores of 1, respectiv ely . Method Prec.A vg Reca.A vg Prec.@1 Reca.@1 Re-id (fine-tune) 14.0 16.0 - - Re-id (retrain) 22.0 24.0 - - Ours (w O ) 86.6 84.2 66.4 57.7 Ours 79.6 77.0 60.0 50.9 They reach 60.0% and 50.9% respectiv ely . The distribu- tions of these two scores on all 220 image pairs are shown in Fig. 5 (b). In T able 3 , we report the ev aluation results on different subsets with respectiv e attributes. W e can see that the proposed method is not sensitive to the motion of both top-view and horizontal-view cameras, which is highly de- sirable for motion-camera applications. T able 3. Comparative results on the subsets with dif ferent at- tributes. Attr Occ Hor mov Hor rot Hor sta TV var Prec.A vg 76.6 78.3 80.5 78.4 53.3 Rec.A vg 74.5 74.9 77.9 75.7 53.3 4.4. Ablation Studies Step Length for θ . W e study the influence of the value ∆ θ , the step length for searching optimal camera view angle θ in the range [0 , 2 π ) . W e set the value of ∆ θ to 1 ◦ , 5 ◦ and 10 ◦ , respectiv ely and the association results are sho wn in T able 4 . As expected, ∆ θ = 1 ◦ leads to the highest performance, although a larger step length, such as ∆ θ = 5 ◦ also produces acceptable results. V ector representation. Next we compare the associa- tion results using dif ferent vector representation methods as shown in T able 5 . The first row denotes that we represent the subjects in two views by one-dimensional vectors x top and x hor respectiv ely . The second ro w denotes that we rep- resent the subjects in tw o vie ws by one-dimensional vectors T able 4. Results by using different values for ∆ θ . Step length Prec.A vg Reca.A vg Prec.@1 Reca.@1 ∆ θ = 1 ◦ 79.6 77.0 60.0 50.9 ∆ θ = 5 ◦ 78.8 76.9 59.6 51.8 ∆ θ = 10 ◦ 72.5 71.1 53.2 46.8 y top and y hor , respectively , which are simply normalized to the range [0 , 1] to make them comparable. The third row denotes that we combine the one-dimensional vectors for the first and second rows to represent each vie w , which dif- fers from our proposed method (the fourth row of T able 5 ) only on the normalization of y top and y hor – our proposed method uses a RANSA C strate gy . By comparing the re- sults in the third and fourth ro ws, we can see that the use of RANSA C strategy for estimating the scaling factor µ does improv e the final association performance. The results in the first and second rows show that using only one dimen- sion of the proposed v ector representation cannot achie ve performance as good as the proposed method that combines both dimensions. W e can also see that x top and x hor pro- vides more accurate information than y top and y hor when used for cross-view subject association. T able 5. Comparativ e study of using different vector representa- tions. ¯ y top and ¯ y hor are normalized results of y top and y hor , respectiv ely , by simply scaled to [0 , 1] . V ector Prec.A vg Reca.A vg Prec.@1 Reca.@1 x top , hor 63.2 61.6 41.8 35.9 ¯ y top , hor 23.4 13.4 6.8 0.9 x top , hor , ¯ y top , hor 67.7 66.6 46.4 42.7 Ours 79.6 77.0 60.0 50.9 Parameters selection. There are tw o free parameters ρ and λ in Eq. ( 8 ). W e select different v alues for them and see their influence to the final association performance. T able 6 reports the results by v arying one of these two parameters while fixing the other one. W e can see that the final asso- ciation precision and recall scores are not very sensitiv e to the selected values of these tw o parameters. T able 6. Results by varying values of ρ and λ . ρ Prec.A vg Reca.A vg λ Prec.A vg Reca.A vg ρ = 10 76.4 73.7 λ = 0 . 005 79.2 76.6 ρ = 25 79.6 77.0 λ = 0 . 015 79.6 77.0 ρ = 40 79.1 76.7 λ = 0 . 025 78.4 75.9 Detection method. In order to analyze the influence of subjects detection’ s accuracy to the proposed cross-view as- sociation, we tried the use of different subject detections. As shown in T able 7 , in the first row , we use manually an- notated bounding boxes of each subject on both views for the proposed association. In the second and third rows, we use manually annotated subjects on top-vie w images and horizontal-view images, respecti vely , while using automati- cally detected subjects [ 15 ] on the other-vie w images. In the fourth ro w , we automatically detect subjects in both views first, and then only keep those that show an IoU > 0 . 5 (Inter- section over Union) against a manually annotated subject, in terms of their bounding boxes. W e can see that the use of manually annotated subjects produces much better cross- view subject association. This indicates that further efforts on improving subject detection will benefit the association. T able 7. Results by using different methods for subject detection. Subjects detection Prec.A vg Reca.A vg Prec.@1 Reca.@1 Manual 83.5 80.5 76.8 61.4 Manual-T op 84.8 82.0 70.5 59.1 Manual-Hor 80.6 77.4 69.1 55.5 Automatic w selection 80.7 76.1 69.6 52.7 Automatic (Ours) 79.6 77.0 60.0 50.9 p re c is i on / re c a ll n um b er o f a s so c i at e d su b je c t s ( a) ( b) p re c is i on / re c a ll Pr ec . Pr e Re ca . 0 1 2 3 4 5 6 7 8 9 10 0 0.1 0.2 0.3 0.4 0.5 0.6 0.7 0.8 0.9 1 0 0 1 . 0.2 0.3 0.4 0.5 0.6 0.7 0.8 0.9 1.0 0 0.1 0.2 0.3 0.4 0.5 0.6 0.7 0.8 0.9 1 Pr ec . Pr e Re ca . p ro p or t io n o f as s o ci a te d s ub j e ct s Figure 6. (a) Association performance for image pairs with differ - ent number of associated subjects. (b) Association performance for image pairs with different proportion of associated subjects. T able 8. Association results using the proposed method with and without handling occlusions. Method Whole dataset Occ subset Prec.A vg Reca.A vg Prec.A vg Reca.A vg Ours 79.6 77.0 76.6 74.5 Ours(w/o occ) 65.2 65.1 46.1 46.8 4.5. Discussion Number of associated subjects. W e in vestigate the cor- relation between the association performance and the num- ber of associated subjects. Figure 6 (a) shows the a verage association performance on the image pairs with different number of associated subjects. W e can see that the asso- ciation results get worse when the number of associated subjects is too high or too lo w . When there are too many 8 7 6 5 4 3 2 1 0 0 0 8 7 6 5 4 3 2 1 8 7 6 5 4 3 1 1 2 3 4 5 6 7 8 4 3 2 1 0 0 0 0 4 3 2 1 Top-view Horizontal-view Top-view Horizontal-view 4 3 2 1 0 0 0 0 0 0 4 3 2 1 Top-view Horizontal-view 0 0 6 5 4 3 2 1 5 4 3 2 1 6 0 0 0 Top-view Horizontal-view Figure 7. Row 1: T wo sample results on image pairs with occlusions. Row 2: T wo sample results with large number of unshared subjects between two vie ws. V ector sets V top and V hor are shown in the top-right corner of e very image. 0 5 4 3 2 1 1 2 3 4 1 2 3 4 5 0 5 4 3 2 1 0 T op-view Horizontal-view 6 5 4 3 1 2 3 1 2 0 0 0 0 1 2 3 0 6 5 4 3 2 1 0 0 0 0 Horizontal-view 0 5 T op-view Figure 8. T wo failure cases. associated subjects, the cro wded subjects in the horizontal view may prev ent the accurate detection of subjects. When there are two fe w subjects, the constructed vector represen- tation is not sufficiently discriminativ e to locate the camera location O and camera-view angle θ . Figure 6 (b) sho ws the av erage association performance on the image pairs with different proportions of associated subjects. More specifi- cally , the performance at x along the horizontal axis is the av erage precision/recall score on all the image pairs with the proportion of associated subjects (to the total number of subjects in the top-vie w image) less than x . This confirms that on the images with higher such proportion, the associ- ation can be more reliable. Occlusion. Occlusions are very common, as shown in T able 1 . T able 8 shows the association results on the en- tire dataset and the subset of data with occlusions, by using the proposed method with and without the step of identi- fying and ignoring occluded subjects. W e can see that our simple strate gy for handling occlusion can significantly im- prov e the association performance on the image pairs with occlusions. Sample results on image pairs with occlusions are shown in the top row of Fig. 7 , where associated sub- jects bear same number labels. W e can see that occlusions occur more often when 1) the subjects are crowded, and 2) one subject is very close to the horizontal-vie w camera. Proportion of shared subjects. It is a common situation that many subjects in two views are not the same persons. In this case, the shared subjects may only count for a small proportion in both top- and horizontal-vie ws. T wo exam- ples are sho wn in the second row of Fig. 7 . In the left, we show a case where many subjects in the top view are not in the field of view of the horizontal-view camera. In the right, we sho w a case where many subjects in the horizontal vie w are too far from the horizontal-view camera and not cov- ered by the top-view camera. W e can see that the proposed method can handle these two cases very well, by exploring the spatial distribution of the shared subjects. Failur e case. At last, we give two f ailure cases as shown in Fig. 8 – one caused by the error in subject detection (blue boxes) and the other is caused by the close distance of mul- tiple subjects, e.g, subjects 3,4 and 5, in either top or hori- zontal vie w , which lead to error detection of occlusions and incorrect vector representations. 5. Conclusion In this paper , we dev eloped a new method to associate multiple subjects across top-vie w and horizontal-view im- ages by modeling and matching the subjects’ spatial dis- tributions. W e constructed a vector representation for all the detected subjects in the horizontal-vie w image and an- other v ector representation for all the detected subjects in the top-view image that are located in the field of vie w of the horizontal-view camera. These two vector representa- tions are then matched for cross-view subject association. W e proposed a ne w matching cost function with which we can further optimize for the location and view angle of the horizontal-view camera in the top-view image. W e col- lected a ne w dataset, as well as manually labeled ground- truth cross-view subject association, and experimental re- sults on this dataset are very promising. References [1] S. Ardeshir and A. Borji. Ego2top: Matching viewers in egocentric and top-vie w videos. In ECCV , 2016. 1 , 2 [2] S. Ardeshir and A. Borji. Egocentric meets top-view . IEEE TP AMI , 2018. 1 , 2 [3] S. Ardeshir and A. Borji. Integrating e gocentric videos in top-view surv eillance videos: Joint identification and tem- poral alignment. 2018. 1 , 2 , 6 [4] C. Fan, J. Lee, M. Xu, K. K. Singh, Y . J. Lee, D. J. Crandall, and M. S. Ryoo. Identifying first-person camera wearers in third-person videos. In CVPR , 2017. 2 [5] F . Ferland, F . Pomerleau, C. T . L. Dinh, and F . Michaud. Egocentric and exocentric teleoperation interf ace using real- time, 3d video projection. 2 [6] M. Fischler . Random sample consensus : A paradigm for model fitting with application to image analysis and auto- mated cartography . A CMM , 1981. 4 [7] L. Giuseppe, M. Iacopo, A. D. Bagdanov , and D. B. Alberto. Person re-identification by iterati ve re-weighted sparse rank- ing, 2015. 2 [8] D. Gray and T . Hai. V iewpoint in variant pedestrian recogni- tion with an ensemble of localized features. In ECCV , 2008. 2 [9] M. Kstinger , M. Hirzer, P . W ohlhart, P . M. Roth, and H. Bischof. Large scale metric learning from equi valence constraints. In CVPR , 2012. 2 [10] S. Liao, Y . Hu, X. Zhu, and S. Z. Li. Person re-identification by local maximal occurrence representation and metric learning. In CVPR , 2015. 2 [11] K. B. Low and U. U. Sheikh. Learning hierarchical represen- tation using siamese con volution neural network for human re-identification. In ICDIM , 2016. 2 [12] B. Ma, S. Y u, and F . Jurie. Local descriptors encoded by fisher vectors for person re-identification. In ECCV , 2012. 2 [13] S. Paisitkriangkrai, C. Shen, and A. V . D. Hengel. Learning to rank in person re-identification with metric ensembles. In CVPR , 2015. 2 [14] H. S. Park, E. Jain, and Y . Sheikh. Predicting primary gaze behavior using social salienc y fields. In ICCV , 2013. 2 [15] J. Redmon, S. Di vvala, R. Girshick, and A. Farhadi. Y ou only look once: Unified, real-time object detection. In CVPR , 2016. 3 , 6 , 7 [16] Z. Rui, W . Ouyang, and X. W ang. Learning mid-lev el filters for person re-identification. In CVPR , 2014. 2 [17] M. Sniedovich. Dynamic programming. foundations and principles. Monographs and T extbooks in Pure and Applied Mathematics , 2011. 4 [18] B. Soran, A. Farhadi, and L. G. Shapiro. Action recognition in the presence of one egocentric and multiple static cameras. In A CCV , 2014. 2 [19] Y . Sun, Z. Liang, Y . Y i, T . Qi, and S. W ang. Beyond part models: Person retrie val with refined part pooling (and a strong con volutional baseline). In ECCV , 2018. 6 [20] X. T ong, H. Li, W . Ouyang, and X. W ang. Learning deep feature representations with domain guided dropout for per- son re-identification. In CVPR , 2016. 2 [21] R. R. V arior, S. Bing, J. Lu, X. Dong, and W . Gang. A siamese long short-term memory architecture for human re- identification. In ECCV , 2016. 2 [22] M. Xu, C. Fan, Y . W ang, M. S. Ryoo, and D. J. Crandall. Joint person segmentation and identification in synchronized first- and third-person videos. In ECCV , 2018. 2 [23] Y . Y ang, J. Y ang, J. Y an, S. Liao, Y . Dong, and S. Z. Li. Salient color names for person re-identification. In ECCV , 2014. 2 [24] L. Zheng, H. Zhang, S. Sun, M. Chandrak er , Y . Y ang, and Q. Tian. Person re-identification in the wild. In CVPR , 2017. 2
Original Paper
Loading high-quality paper...
Comments & Academic Discussion
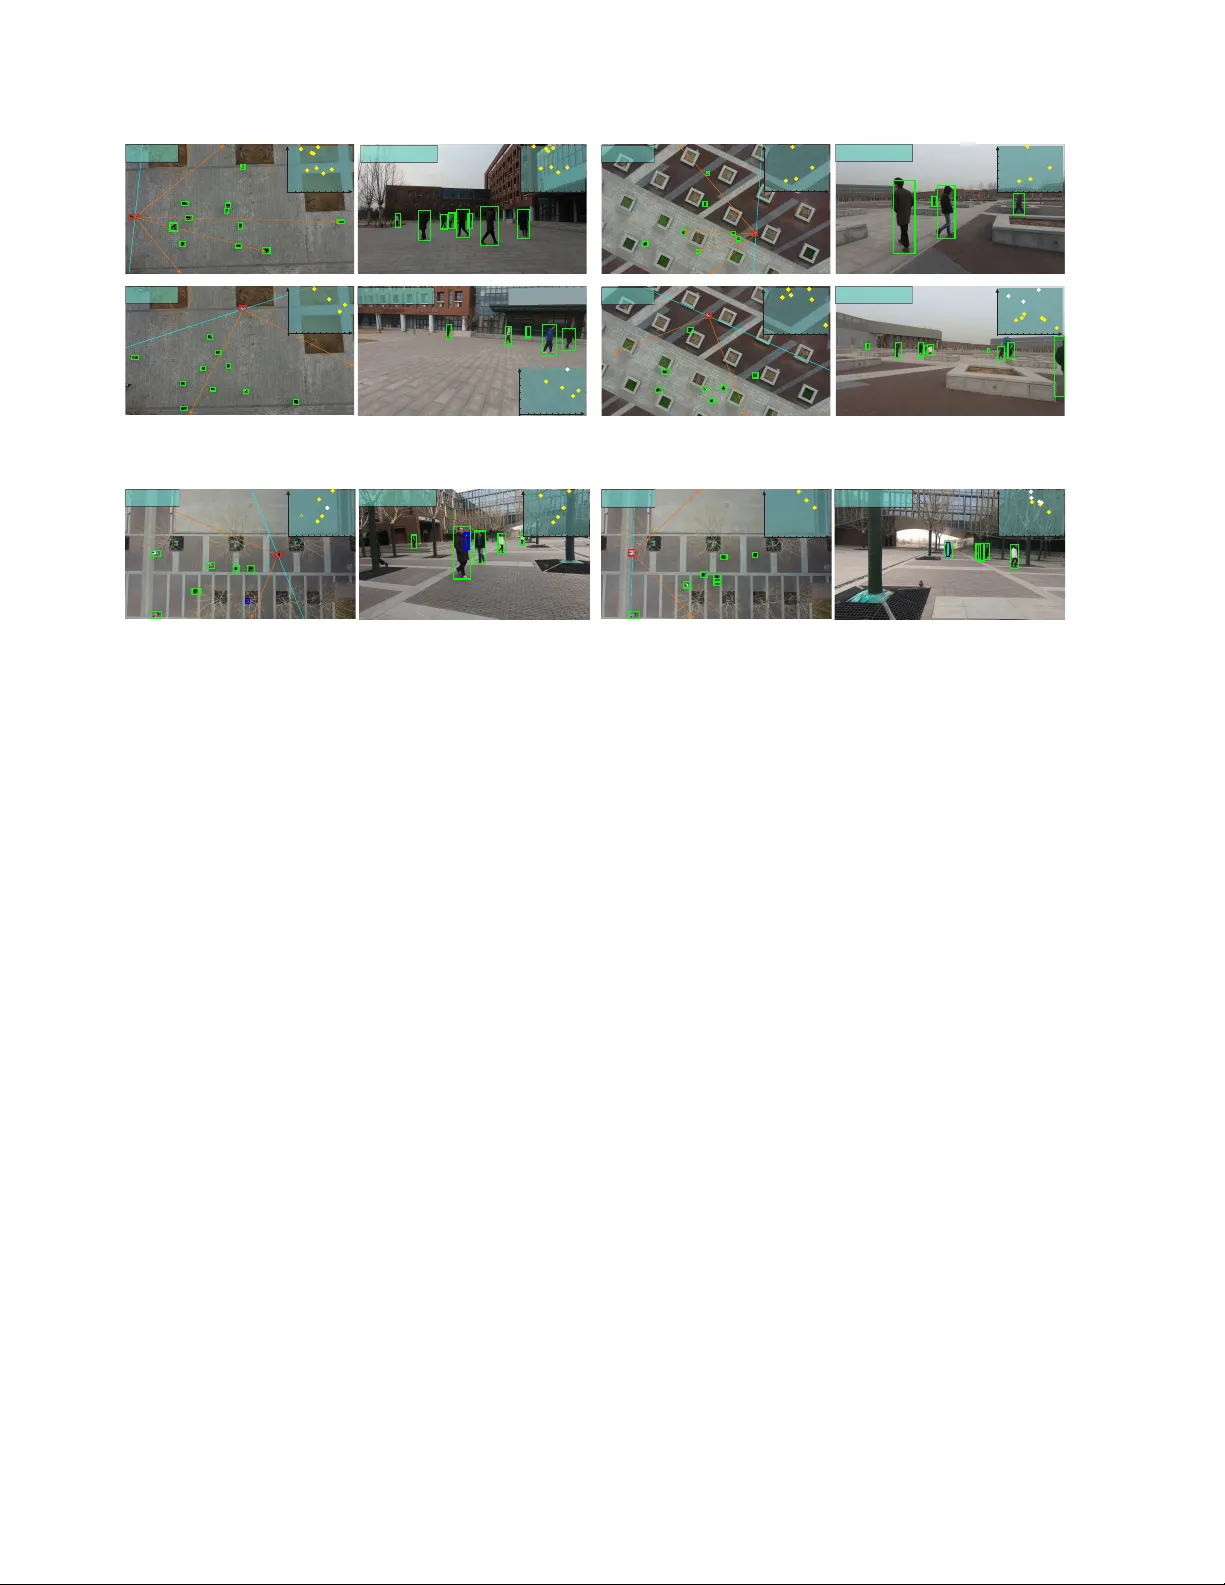
Loading comments...
Leave a Comment