WaveletBrain: Characterization of human brain via spectral graph wavelets
Early diagnosis of Alzheimer's disease plays a key role in understanding the degree of the patient's mental decline and determining preventive therapies. In this study, we introduce WaveletBrain, a novel representation of the white and gray matter su…
Authors: Majid Masoumi, Matthew Toews, Herve Lombaert
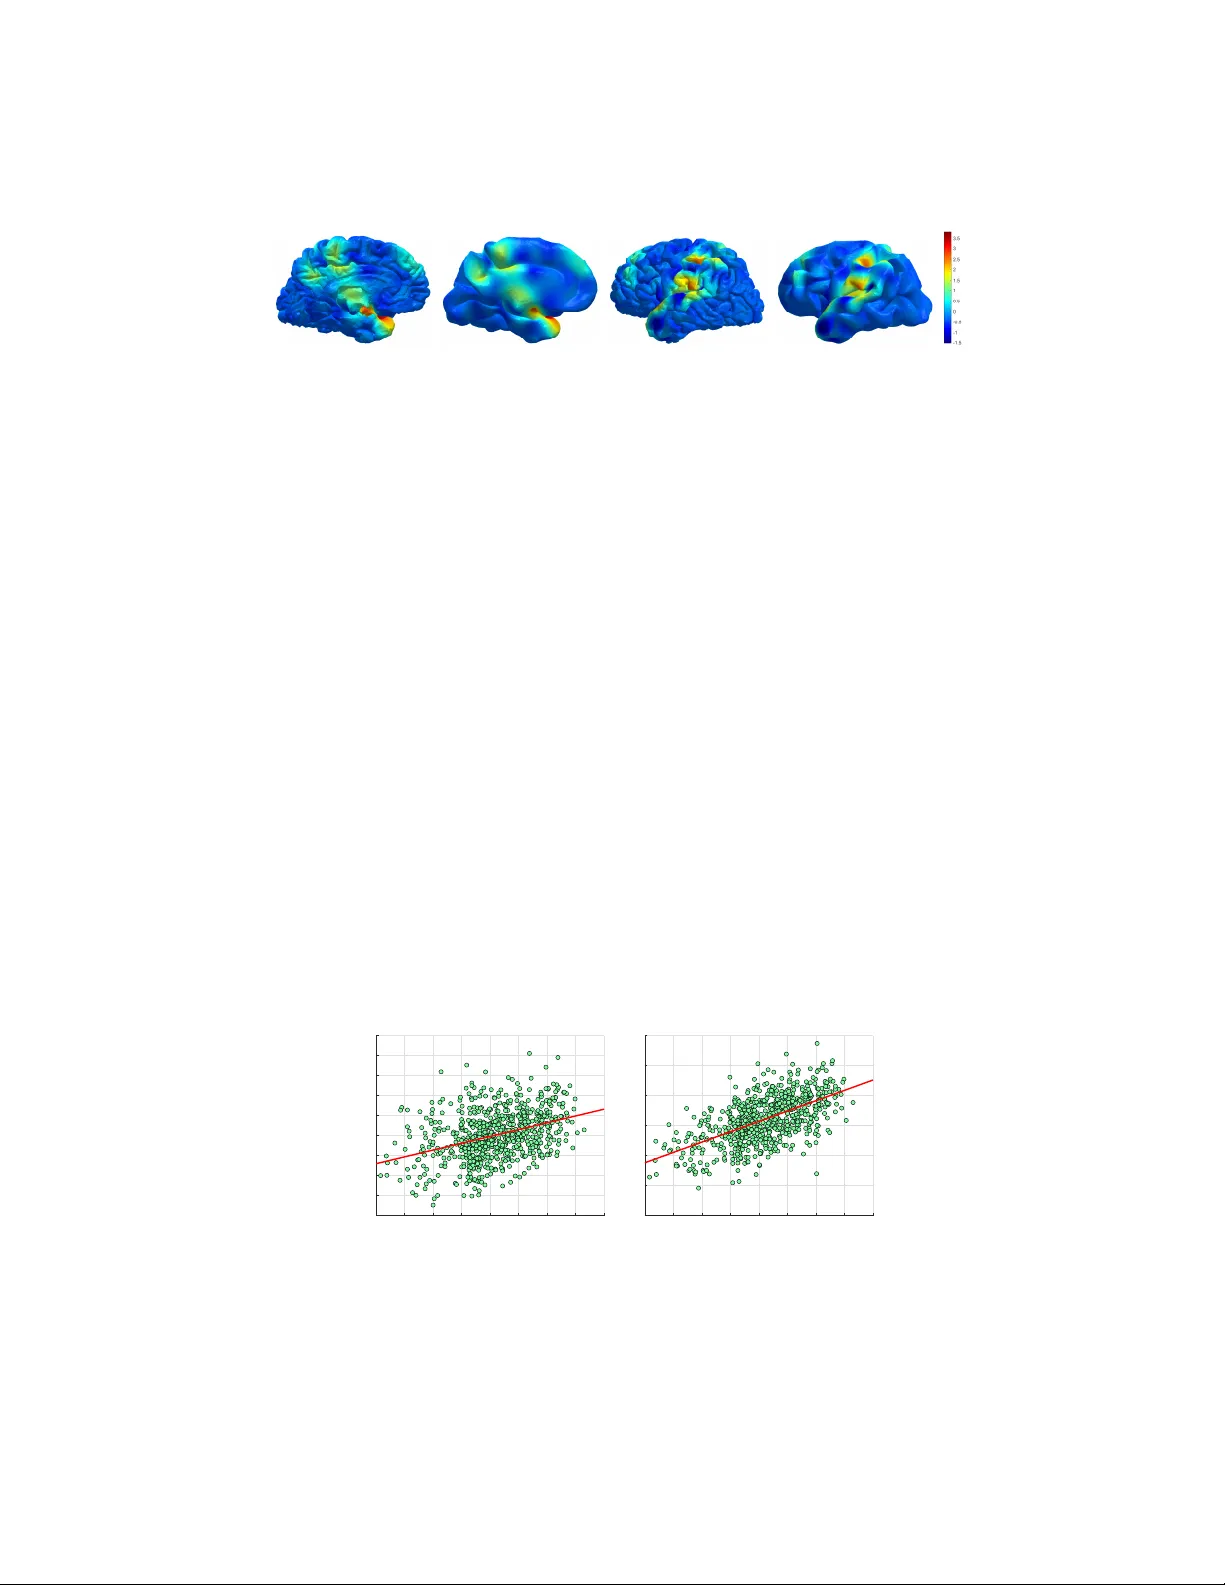
W a veletBrain: Characterization of human brain via spectral graph wa velets Majid Masoumi, Matthew T oe ws, and Herv ´ e Lombaert, for the Alzheimer’ s Disease Neuroimaging Initiativ e ? ´ Ecole de technologie sup ´ erieure, Montreal, Canada Abstract. Early diagnosis of Alzheimer’ s disease plays a ke y role in understand- ing the degree of the patient’ s mental decline and determining pre venti ve ther- apies. In this study , we introduce W av eletBrain, a novel representation of the white and gray matter surfaces of the cortex. The proposed framework innov ates by deriving localized shape information from a global harmonic representation, that can be used in large-scale population studies of surface data. Results sho w that W aveletBrain leads to statistically significant improvements in comparison to the ShapeDN A representation in a variety of experiments including (i) clas- sification of Alzheimer’ s disease, normal aging, and mild cognitiv e impairment, (ii) sex classification and (iii) age prediction of subjects. W e performed our anal- ysis on 719 patients and 2,876 surfaces. While this work focuses primarily on Alzheimer’ s disease diagnosis, our proposed framework can be used to address general surface analysis problems in neuroscience. Keyw ords: W aveletBrain · Spectral graph wa velets · Brain · Alzheimer’ s dis- ease. 1 Introduction Alzheimer’ s disease (AD) is a progressive disease that affects the brain both mentally and physically . In fact, the brain morphometry starts to change years before recognizing the first symptoms of AD. Although no cure for AD is known, ef forts to wards early detection of the disease could directly impact the quality of a patient’ s life [15]. Recently , there has been a flurry of research acti vity on designing a computer- assisted model to detect subtle changes in brain shape and, hence determining risk le vel and prev entiv e therapiess [4,22,21]. Measuring the similarity between all image pairs of a large set of N magnetic resonance images (MRIs) is a computationally expensiv e operation of O ( N 2 ) complexity [20]. Moreover , scanning art ifacts and inhomogeneities can lead to noisy intensity variations in MRI scans, limiting the accurac y of AD classi- fication [21]. The accuracy of prediction is closely linked to the model or representation ? Corresponding Author: ma masou@encs.concordia.ca. Data used in preparation of this arti- cle were obtained from the Alzheimer’ s Disease Neuroimaging Initiativ e (ADNI) database (adni.loni.usc.edu). As such, the inv estigators within the ADNI contributed to the design and implementation of ADNI and/or provided data b ut did not participate in analysis or writing of this report. A complete listing of ADNI in vestigators can be found at: http://adni.loni.usc.edu/ wp- content/uploads/how to apply/ADNI Ackno wledgement List.pdf 2 M. Masoumi et al. used [3]. The cortical surface is responsible for all cognition, and finding an ef ficient and informativ e representation may lead to significant impro vements in tasks such as classification and regression. Early approaches to modeling brain shape included vol- umetric measurements or voxel-wise morphometric analysis [7,18,9]. Although these representations are useful in describing inter-class dif ferences, they ignore important regional information about brain shape [17]. Brain surf aces can be modeled as triangu- lated meshes leading to a more efficient and compact representation. Most existing ap- proaches hav e analyzed the surfaces of subcortical structures, e.g. hippocampus [6,5,2] and measure a shape coarsely [21], here we focus on the gray and white matter surfaces. Recently , spectral signatures based on the eigendecomposition of Laplace-Beltrami Operator (LBO) hav e attracted a lot of attention in a wide range of applications includ- ing object retrie val and classification [11,13]. Spectral shape descriptors are grouped into two categories, i.e. global and local descriptors. The local descriptors [12] are defined on each verte x and contain information about the local structure of that ver- tex, while global descriptors [16,19,1] capture information of the entire object. Shape- DN A [16] introduced by Reuter et al. as a global signature defined by non-trivial k - smallest eigen values of LBO normalized by mesh area that sorted in ascending order . Most recently , the authors extended the idea for brain identification called BrainPrint [21]. Howe ver , a global descriptor only provides a limited representation of a surface as a whole and cannot be applied when, for instance, to analyze local features on surfaces. Spectral graph wav elet signature (SGWS) is a compact descriptor that is not only pose-in variant but also allows assessing shapes in different scales. In a bid to resolve the deficiencies of the global descriptors, SGWS has been introduced in [11,13] as a multiresolution descriptor that encodes both local and global structure of the shape. It efficiently captures valuable information about both macroscopic and microscopic structures of the shape, notably , the cortical folding pattern. SGWS has since showed superiority o ver ShapeDN A in both non-rigid shape classification and retriev al [11,12]. Unlike BrainPrint, which relies on 44 descriptors calculated from both cortical and subcortical surfaces, we compute our SGWS only on the cortical surfaces, with 4 de- scriptors. This compact representation is less prone to segmentation error and more computationally feasible for large datasets. The ne w framew ork leads to more accurate classification and prediction results. The contributions of this paper are tw ofold: (1) we propose a framework to precisely model a brain by harnessing the power of the spectral graph wavelets called W avelet- Brain. (2) W e exploit the W aveletBrain to predict Alzheimer’ s disease and show the superiority of our approach with respect to the well-known ShapeDN A in different ex- periments. 2 Background W e model a brain surface as a triangular mesh M , where M is defined by G = ( V , E , T ) , with V = { v 1 , . . . , v m } as the set of vertices, E = { e ij } as the set of edges, and T = { t 1 , . . . , t g } as the set of triangles. Each e ij = [ v i , v j ] connects a pair of v ertices { v i , v j } . W e denote two adjacent vertices by v i ∼ v j or simply i ∼ j ) if there is a connectivity between them by an edge, i.e. e ij ∈ E . W aveletBrain: Characterization of human brain via spectral graph wa velets 3 Spectral Analysis W e build our Laplacian matrix by discretization of the Laplace- Beltrami operator (LBO) [10] based on cotangent weight scheme as suggested by [14] giv en by L = A − 1 ( D − W ) , where A = diag( a i ) is a mass matrix, D = diag( d i ) is a degree matrix constructed by d i = P n j =1 w ij , and W = ( w ij ) = (cot α ij + cot β ij ) / 2 a i is a weight matrix if i ∼ j (readers are referred to [10,14] for detailed description). W e solve the gener alized eigen value problem , such that C ξ ` = λ ` A ξ ` , where λ ` and ξ ` are the eigensystem of LBO, and C = D − W . 3 Method Manifold Harmonic T ransform For a given graph signal f : V → R m , we obtain the eigensystem { λ ` , ξ ` } , ` = 1 , . . . , m of LBO to define the manifold harmonic (forward graph F ourier) and inv erse manifold harmonic (in verse graph Fourier) transforms as [8] ˆ f ( ` ) = h f , ξ ` i = m X i =1 f ( i ) ξ ` ( i ) , and f ( i ) = m X ` =1 ˆ f ( ` ) ξ ` ( i ) , (1) respectiv ely , where ˆ f ( ` ) is the value of f at eigen value λ ` (i.e. ˆ f ( ` ) = ˆ f ( λ ` ) ). The lower -order eigen vectors capture the global structure of the brain, while the higher-order eigen vectors encode more details of the surf ace including cortical folding. Spectral Graph W avelet T ransform Similar to the Fourier transform, the wa velet transform has the po wer to decompose a signal into its constituent frequencies. How- ev er, the advantage of the wa velet transform over the Fourier transform is its capabil- ity to perform localization in both frequency and space domain making spectral graph wa velet a perfect candidate for analyzing the signal in multile vel of descriptions. The localization of wav elet function around a surface point j ∈ V may be character - ized by applying a wavelet operator T t g at kernel g and scale t to an indicator function f ( i ) = δ j ( i ) such that ψ t,j = T t g δ j . The inner product between the input function f and ψ t,j results in wa velet coef ficients as W δ j ( t, j ) = h δ j , ψ t,j i = m X ` =1 g ( tλ ` ) ξ 2 ` ( j ) , (2) also we may construct the coefficients of the scaling function by applying the scaling operator T h on a unit impulse function δ j , i.e. φ j = T h δ j as follows S δ j ( j ) = h δ j , φ t i = m X ` =1 h ( λ ` ) ξ 2 ` ( j ) . (3) W e inte grate the coef ficients of the wav elet and scaling function to build the spectral graph signature at verte x index j as follows: s L ( j ) = { W δ j ( t k , j ) | k = 1 , . . . , L } ∪ { S δ j ( j ) } . (4) where s L ( j ) is the spectral graph wa velet descriptor at resolution le vel L . The di- mension p of SGWS is L + 1 , which leads to a compact signature for analyzing the 4 M. Masoumi et al. 0 0.2 0.4 0.6 0.8 1 (a) (b) (c) (d) Fig. 1. Representation of the local spectral graph wav elets from a reference point on left pial (top row) and inflated surfaces (bottom row) at L = 3 . Information captured by (a) scaling function, (b)-(d) wavelets, scales 1-3. The colder colors represent a similar structure to the highlighted point while the hotter colors capture the different structure of the brain. Spectral graph wav elets hav e been visualized on the inflated pial surface for a clearer representation of their v ariations. cortex surf ace. Moreover , to access the full spectrum of the brain structure, the w av elet scales t k ( t k > t k +1 ) are selected to be logarithmically equispaced between maximum and minimum scales t 1 and t L , respectiv ely . W e define the spectral graph wavelet generating kernel g and scaling function h as follows g ( x ) = 2 √ 3 π 1 4 1 − x 2 exp − x 2 2 and h ( x ) = γ exp − ( x 0 . 3 λ min ) 4 , respec- tiv ely . W e set γ such that h (0) has the same v alue as the maximum value of g and λ min = λ max / 15 . Also, the maximum and minimum scales are set to t 1 = 2 /λ min and t L = 2 /λ max , where λ min and λ max are the lower and upper bounds of the spectrum, respec- tiv ely . Figure 1 represents the normalized χ -squared distance between a specified point and the rest of points on normal (top row) and smoothed (bottom row) brain surface using SGWS. Featur e Aggregation In W a veletBrain, a brain surface M is modeled by a p × m ma- trix S = ( s 1 , . . . , s m ) of spectral graph wavelet signatures, where each p -dimensional feature vector s i is a local descriptor that encodes the local information around the i th verte x. T o aggregate the local features attained from spectral graph wa velet transform (SGWT), we employ bag-of-features (BoF) model leading to a simple and lightweight representation of a brain surface that facilitates the process of brain comparison. The BoF model consists of four main steps: feature extraction and description, dictionary design, feature coding, and pooling. Algorithm In an ef fort to model the brain shape in spectral graph wa velets domain, we first select the white and gray matter surfaces for each subject in the dataset D . After- ward, each brain surf ace is characterized to a compact and discriminative representation with SGWS. Subsequently , we perform soft-assignment coding by embedding the local signatures into the geometric dictionary space of size k , resulting in higher dimensional mid-lev el features U = ( u 1 , . . . , u m ) ∈ R k × m which we refer to as spectral graph wa velet codes (SGWC). Consequently , we apply sum-pooling on code assignment ma- trix U to achieve a histogram h r = P m i =1 u ri that represents each brain surface M . This process is repeated separately for right/left gray and white matters of a brain sur- W aveletBrain: Characterization of human brain via spectral graph wa velets 5 MRI image FreeSurfer SGW BoF Aggregate Surfaces Local features Histogr ams W a v el etBr ain Fig. 2. Flowchart of the proposed approach. First, brain surfaces of the left/right gray and white matters are created by FreeSurfer . Second, SGW signatures are computed on the surfaces. Third, a global signature (histogram) is calculated by the BoF paradigm for each surface. Fourth, his- tograms are aggregated to constitute the W aveletBrain. face in the dataset. W e combine extracted signatures of n brain surfaces in the dataset and arranged them into a 4 k × n data matrix Z = ( z 1 , . . . , z n ) called W av eletBrain. It is noteworthy to mention that the dictionary is computed offline by concatenating all the SGWS matrices into a data matrix, followed by applying the K-means algorithm result- ing in a vocabulary matrix V , where V = ( v 1 , . . . , v k ) ∈ R p × k . Any further process- ing such as age prediction and disease classification is conducted on the lightweight rep- resentation, i.e. the W av eletBrain Z . This requires considerably less memory and makes it easier to model, compute and compare than the image scans. W av eletBrain represents shape information in multiple lev els of details and offers a greater descripti ve represen- tation on, for instance, fine levels of details such as the cortical folds, where definitely important shape information on brain atrophy may be hidden. T o provide more dis- criminativ e power for W aveletBrain, we normalized our descriptor with surface area A , where A = diag( a i ) . The flowchart of the proposed frame work is depicted in Figure 2. 4 Experiments and Results In this section, we assess the performance of the proposed W av eletBrain through ex- tensiv e experiments for disease classification, sex classification and age prediction. W e validate our approach by performing a comprehensiv e comparison with ShapeDN A [16] as a well-known approach in medical shape analysis. Dataset The performance of the proposed frame work is e valuated on ADNI database ( adni.loni.usc.edu ). The ADNI was launched in 2003 as a public-priv ate partnership, led by Principal In vestigator Michael W . W einer , MD. The primary goal of ADNI has been to test whether serial magnetic resonance imaging (MRI), positron emission tomogra- phy (PET), other biological markers, and clinical and neuropsychological assessment can be combined to measure the progression of mild cognitiv e impairment (MCI) and 6 M. Masoumi et al. early Alzheimers disease (AD). Early diagnosis of AD by sensitiv e and specific mark- ers is a breakthrough to assist clinicians to de velop new pre ventiv e treatment as well as reducing time and cost of clinical trial.In our experiment, we selected 719 subjects from ADNI dataset resulting in 2 , 892 surfaces including right/left white and gray matters. Perf ormance Evaluation Measures In a bid to perform AD and se x classification, we split our W aveletBrain data matrix Z = { ( z i , y i ) } , where z i ∈ R 4 k in two disjoint subsets of training set Z train for learning, and the test set Z test for testing. W e ev aluate the performance of a classifier on test data by b uilding a contingency table. W e then extract the accurac y results by dividing the total number of correctly classified examples by the total number of examples. W e use support vector machine (SVM) as a classifier in our experiments to separate different categories since it works well in high-dimensional feature space. T o perform age prediction, we employ partial least-squares (PLS) regression [23]. PLS is beneficial when the number of variables in a data matrix Z is significantly larger than the number of observ ations. The intuition behind employing PLS regression is the failure of multiple linear re gression due to multicollinearity among Z variables. As a result, the regression is performed on the latent variables. Intuitiv ely , if there is a disparity between the predicted and the real age, it means a patient is suspected of suffering from AD. Classification of Alzheimer’ s disease W e applied 10 -fold cross-validation to clas- sify brain surfaces of AD from those of the NC and MCI classes in the dataset. W e consider an equal size of classes to perform classification. For instance, to classify NC and MCI groups, the data consists of 212 brain surf aces for each class. T o capture more information about the brain shape, we also aggreg ated the differences between the right gray and white matters as well as those of the left hemispheres to the W av eletBrain. T able 1 reports a comparison between the performance of our W av eletBrain approach with ShapeDN A for differentiating between patients with AD, NC, and MCI. As can be seen, our framew ork outperforms the ShapeDNA in disease classification and results in higher accuracy with p -values of 0 . 0022 , 0 . 0001 , and 0 . 0024 for AD/NC, NC/MCI, and AD/MCI classification, respectiv ely . For visualization purposes, Fig. 3 reveals the sig- nificance map of group differences between AD and NC. As can be seen, the location of brain differences correlates with changes in the hippocampal re gion. Sex prediction The task here is to predict the sex based on the W av eletBrain. W e consider a subset of ADNI dataset to hav e the same number of male and female subjects, resulting in N = 594 subjects. The performance of W av eletBrain in sex classification is e valuated by using an SVM classifier . In this e xperiment, ShapeDN A provided an T able 1. The average accurac y of disease classification for ShapeDN A and W av eletBrain. # of subjects ShapeDNA W aveletBrain p -value AD vs. NC 158 65 . 90 ± 9 . 2 68 . 75 ± 7 . 1 0 . 0022 NC vs. MCI 212 54 . 49 ± 6 . 5 58 . 52 ± 7 . 3 0 . 0001 AD vs. MCI 158 56 . 00 ± 4 . 7 57 . 97 ± 6 . 6 0 . 0024 W aveletBrain: Characterization of human brain via spectral graph wa velets 7 medial view lateral view Fig. 3. V isualization of group differences between AD vs NC on original and smoothed pial surfaces. Coloring indicates dif ferences from low (blue) to high (red). accuracy of 76 . 67 ± 4 . 70% . W av eletBrain achieved an accuracy of 81 . 67 ± 4 . 30% , yielding therefore a higher accuracy for se x prediction with a p -value of 0 . 0001 . Age prediction W e ev aluate the performance of the W aveletBrain on the prediction of the subject’ s age by exploiting 719 subjects from ADNI dataset. W e employed PLS regression among dif ferent diagnostic classes to predict subjects’ age. Our results are ev aluated using a leav e-one-out cross-validation. Figure 4 shows a scatter plot of true versus predicted age on the ADNI dataset. The least regression line is also included in the plot for both ShapeDN A and W aveletBrain. T o sho w the strength of the W av eletBrain in contrast with ShapeDN A for predicting age, we computed Pearson’ s r for both methods, yielding in r = 0 . 48 for ShapeDN A and r = 0 . 58 for W av eletBrain, respectively . As can be seen in Figure 4, our frame work outperforms ShapeDN A in terms of Pearson’ s r with performance improv ement of 0 . 10 . In an ef fort to perform a further comparison between ShapeDNA and W av eletBrain, we calculated the mean absolute error (MAE) for real and estimated ages. The results showed that our proposed method attains an MAE of 4 . 31 compared to ShapeDNA with 4 . 59 . As a result, W aveletBrain ameliorates prediction of the subject’ s age with a lo wer error of 0 . 22 . 55 60 65 70 75 80 85 90 95 True age 68 70 72 74 76 78 80 82 84 86 Predicted age 55 60 65 70 75 80 85 90 95 True age 60 65 70 75 80 85 90 Predicted age Fig. 4. Scatter plots of true versus predicted ages of subjects in ADNI dataset show the superiority of W av eletBrain (right) with Pearson’ s r = 0 . 58 compared with ShapeDN A (left) with Pearson’ s r = 0 . 48 . 8 M. Masoumi et al. 5 Conclusions In this paper , we introduced W aveletBrain to characterize brain morphology . W e built the W a veletBrain only on the cortical surfaces of the brain resulting in a compact repre- sentation that is less prone to se gmentation error and ideal for analysis of large datasets. The performance result of the W aveletBrain was compared with the ShapeDN A, yield- ing in significantly higher accuracy in all experiments including classification of Alz- heimer’ s disease ( p -values ≤ 0 . 0024 ), sex prediction ( p -values ≤ 0 . 0001 ) and age pre- diction (lower MAE error of 0 . 22 ). For future work, we plan to apply the proposed approach to in vestigate brain asymmetry . 6 Acknowledgements This work was supported by Fonds de recherche du Quebec Nature et technologies (FQRNT), NSERC and ETS. Data collection and sharing for this project was funded by the Alzheimers Disease Neuroimaging Initiativ e (ADNI) (National Institutes of Health Grant U01 AG024904) and DOD ADNI (Department of Defense award number W81XWH- 12-2-0012). ADNI is funded by the National Institute on Aging, the National Institute of Biomedical Imaging and Bioengineering, and through generous contributions from many other sources. Detailed Acknowledgements information is av ailable in http://adni. loni.usc.edu/wp- content/uploads/how to apply/ADNI Manuscript Citations.pdf . References 1. Aubry , M., Schlicke wei, U., Cremers, D.: The wav e kernel signature: A quantum mechanical approach to shape analysis. In: Proc. Computational Methods for the Innov ativ e Design of Electrical Devices (2011) 2. Costafreda, S., Dinov , I., T u, Z., Shi, Y ., Liu, C., Kloszewska, I., Mecocci, P ., Soininen, H., Tsolaki, M., V ellas, B., et al.: Automated hippocampal shape analysis predicts the onset of dementia in mild cognitiv e impairment. Neuroimage 56 (1) (2011) 3. Dickinson, S., Leonardis, A., Schiele, B., T arr, M.: Object categorization: computer and hu- man vision perspectiv es. Cambridge Univ ersity Press (2009) 4. Falahati, F ., W estman, E., Simmons, A.: Multivariate data analysis and machine learning in alzheimer’ s disease with a focus on structural magnetic resonance imaging. J. Alzheimers Dis. 41 (3) (2014) 5. Ferrarini, L., Frisoni, G., Pievani, M., Reiber , J., Johan, H., Ganzola, R., Milles, J.: Mor- phological hippocampal mark ers for automated detection of alzheimer’ s disease and mild cognitiv e impairment conv erters in magnetic resonance images. J. Alzheimers Dis. 17 (3) (2009) 6. Gerardin, E., Ch ´ etelat, G., Chupin, M., Cuingnet, R., Desgranges, B., et al.: Multidimen- sional classification of hippocampal shape features discriminates alzheimer’ s disease and mild cognitiv e impairment from normal aging. Neuroimage 47 (4) (2009) 7. Good, C., Johnsrude, I., Ashburner , J., Henson, R., Friston, K., Fracko wiak, R.: A voxel- based morphometric study of ageing in 465 normal adult human brains. Neuroimage 14 (1) (2001) 8. Hammond, D., V andergheynst, P ., Gribon val, R.: W av elets on graphs via spectral graph the- ory . A CHA 30 (2) (2011) W aveletBrain: Characterization of human brain via spectral graph wa velets 9 9. Hastings, R.S., Parsey , R.V ., Oquendo, M.A., Arango, V ., Mann, J.: V olumetric analysis of the prefrontal cortex, amygdala, and hippocampus in major depression. Neuropsychophar- macology 29 (5) (2004) 10. L ´ evy , B.: Laplace-Beltrami eigenfunctions: T owards an algorithm that “understands” geom- etry . In: SMI (2006) 11. Li, C., Ben Hamza, A.: A multiresolution descriptor for deformable 3D shape retriev al. The V is Comput 29 (2013) 12. Masoumi, M., Ben Hamza, A.: Spectral shape classification: A deep learning approach. J V is Commun Image Represent 43 (2017) 13. Masoumi, M., Li, C., Ben Hamza, A.: A spectral graph wa velet approach for nonrigid 3D shape retriev al. Pattern Recognit Lett 83 (2016) 14. Meyer , M., Desbrun, M., Schr ¨ oder , P ., Barr , A.: Discrete differential-geometry operators for triangulated 2-manifolds. V isualization and mathematics III 3 (7) (2003) 15. Paquerault, S.: Battle against alzheimer’ s disease: the scope and potential value of magnetic resonance imaging biomarkers. Academic radiology 19 (5) (2012) 16. Reuter , M., W olter, F ., Peinecke, N.: Laplace-Beltrami spectra as ’Shape-DN A’ of surfaces and solids. Computer-Aided Design 38 (4) (2006) 17. Shakeri, M., Lombaert, H., Datta, A., N, A., Oser, N., L ´ etourneau-Guillon, L., et al.: Statis- tical shape analysis of subcortical structures using spectral matching. Comput Med Imaging Graph 52 (2016) 18. Shi, F ., Liu, B., Zhou, Y ., C. Y u, T .J.: Hippocampal volume and asymmetry in mildcogniti ve impairment and alzheimers disease: meta-analyses of mri studies. J. Alzheimers Dis. 19 (11) (2009) 19. Sun, J., Ovsjanikov , M., Guibas, L.: A concise and provably informative multi-scale signa- ture based on heat diffusion. Comput Graph F orum 28 (5) (2009) 20. T oews, M., W achinger, C., Estepar , R., W ells, W .M.: A feature-based approach to big data analysis of medical images. In: IPMI (2015) 21. W achinger, C., Golland, P ., Kremen, W ., Fischl, B., M. Reuter, A.D.N.I., et al.: Brainprint: A discriminativ e characterization of brain morphology . NeuroImage 109 (2015) 22. W achinger, C., Reuter, M., Initiativ e, A.D.N., et al.: Domain adaptation for alzheimer’ s dis- ease diagnostics. Neuroimage 139 (2016) 23. W old, S., Ruhe, A., W old, H., Dunn, W .J.: The collinearity problem in linear regression. the partial least squares (pls) approach to generalized in verses. SISC 5 (3) (1984)
Original Paper
Loading high-quality paper...
Comments & Academic Discussion
Loading comments...
Leave a Comment