AMD Severity Prediction And Explainability Using Image Registration And Deep Embedded Clustering
We propose a method to predict severity of age related macular degeneration (AMD) from input optical coherence tomography (OCT) images. Although there is no standard clinical severity scale for AMD, we leverage deep learning (DL) based image registra…
Authors: Dwarikanath Mahapatra
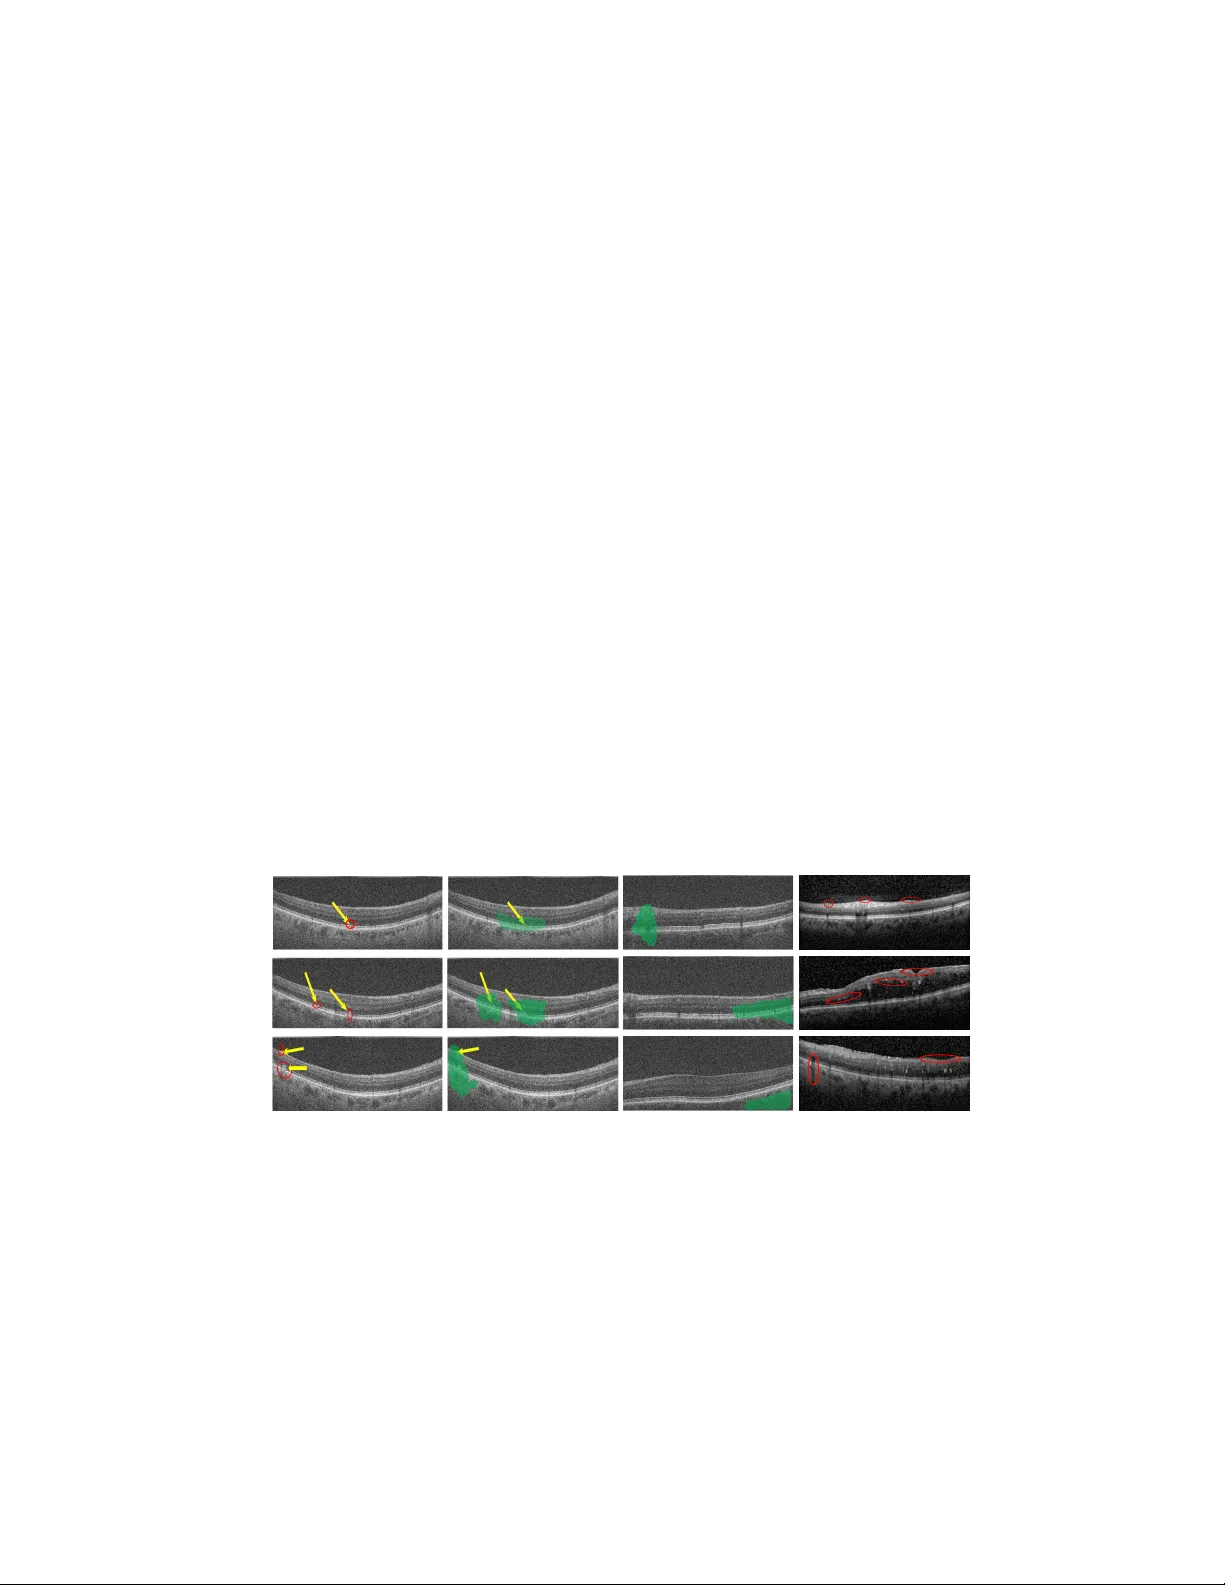
AMD Sev erit y Prediction And Explainabilit y Using Image Registration And Deep Em b edded Clustering Dw arik anath Mahapatra and Hidemasa Muta IBM Researc h Australia [dwarim,hidem]@au1.ibm.com. Abstract. W e prop ose a method to predict severit y of age related macu- lar degeneration (AMD) from input optical coherence tomography (OCT) images. Although there is no standard clinical severit y scale for AMD, w e lev erage deep learning (DL) based image registration and cluster- ing metho ds to identify diseased cases and predict their sev erity . Ex- p erimen ts demonstrate our approach’s disease classification performance matc hes state of the art metho ds. The predicted disease severit y p er- forms w ell on previously unseen data. Registration output pro vides bet- ter explainabilit y than class activ ation maps regarding label and severit y decisions. 1 In tro duction Most approaches to deep learning (DL) based medical image classification out- put a binary decision about presence or absence of a disease without explicitly justifying decisions. Moreov er, disease severit y prediction in an unsup ervised approac h is not clearly defined unless the lab els pro vide suc h information, as in diab etic retinopathy [1]. Diseases such as age related macular degeneration (AMD) do not hav e a standard clinical severit y scale and it is left to the ob- serv er’s exp ertise to assess severit y . While class activ ation maps (CAMs) [73] highligh t image regions that hav e high resp onse to the trained classifier they do not provide measurable parameters to explain the decision. Explainability of classifier decisions is an essential requirement of modern diagnosis systems. In this pap er w e propose a con volutional neural net work (CNN) based optical coherence tomography (OCT) image registration metho d that: 1) predicts the disease class of a given image (e.g., normal, diab etic macular edema (DME) or dry AMD); 2) uses registration output to grade disease sev erity on a normalized scale of [1 , 10] where 1 indicates normal and 10 indicates confirmed disease, and 3) provides explainability by outputting measurable parameters. Previous approaches to DL based image registration include regressors [70,68,4,5,23,75,63,28,22,11,21,35] and generative adversarial net works (GANs) [34,30,31,36,39,18]. [3,17,20,16,57,55] learn a parameterized registration function from training data without the need for simulated deformations in [68,53,33,25,34,24]. Although there is consider- able researc h in the field of in terpretable mac hine learning their application to 2 medical image analysis problems is limited [65,7,43,42,74,27,26,32]. The CAMs of [73] serv e as visualization aids rather than sho wing quantitativ e parameters. W e propose a nov el approach to o vercome the limitations of CAM, by pro vid- ing quanitativ e measures and their visualization for disease diagnosis based on image registration. Image registration makes the approac h fast and enables pro- jection of registration parameters to a linear scale for comparison against normal and diseased cases. It also provides localized and accurate quan titative output compared to CAMs. Our paper mak es the follo wing con tributions: 1) a nov el approac h for AMD severit y estimation using registration parameters and clus- tering; and 2) mapping registration output to a classification decision and output quan titative v alues explaining classification decision. 2 Metho d Our proposed metho d consists of: 1) atlas construction for differen t classes; 2) End to end training of a neural net work to estimate registration parameters and assign sev erity lab els; 3) Assign a test volume to a disease severit y scale, output its registration parameters and pro vide quan titatively in terpretable information. 2.1 A tlas Construction Using Groupwise Registration All normal v olumes are coarsely aligned using their p oin t cloud cluster and the iterated closest p oin t (ICP) algorithm. Groupwise registration using ITK [2] on all volumes giv es the atlas image A N . Each normal image is registered to A N using B-splines. The registration parameters are displacements of grid no des. They are easier to store and predict than a dense 3D deformation field and can b e used to generate the 3D deformation field. The abov e steps are used to obtain atlases for AMD ( A AM D ) and DME ( A DM E ). 2.2 Deep Em b edded Clustering Net work Deep embedded clustering [72,40,62,10,38,37,46] is an unsup ervised clustering approac h and giv es sup erior results than traditional clustering algorithms. T o cluster n p oin ts x i ∈ X n i =1 in to k clusters, each represen ted by a centroid µ j , j = 1 , · · · , k , DEC first transforms the data with a nonlinear mapping f θ : X 7→ Z , where θ are learnable parameters and Z is the latent feature space with lo wer dimensionality than X . Similarity b et ween em b edded p oin t z i and cluster cen troid µ j is given by the Student’s t-distribution as q ij = 1 + k z i − µ j k 2 /α − α +1 2 P j 0 1 + k z i − µ j 0 k 2 /α − α +1 2 , (1) where α = 1 for all exp eriments. DEC simultaneously learns k cluster centers in feature space Z and the parameters θ . It inv olv es: (1) parameter initializa- tion with a deep auto enco der [69] and (2) iterativ e parameter optimization b y 3 computing an auxiliary target distribution and minimizing the KullbackLeibler (KL) divergence. F or further details w e refer the reader to [72] 2.3 Estimation of Registration parameters Con ven tional registration metho ds output a deformation field from an input image pair while we join tly estimate the grid displacemen ts and severit y lab el using end to end training. Figure 1 depicts our workflo w. An input volume of dimension 512 × 1024 × N , N is n umber of slices, is con verted to a stack of N conv olution feature maps by do wnsampling to 256 × 512 × N and employing 1 × 1 con volution. The output is sho wn in Figure 1 as d256 fN k1, whic h indicates output maps of dimension ( d ) 256 × 512, N feature maps ( f ) and kernel dimension ( k ) of 1 × 1. The next conv olution lay er uses 3 × 3 kernels and outputs f = 32 feature maps. This is follow ed by a max p o oling step that reduces the map dimensions to 128 × 128 and the next conv olution la yer outputs 64 feature maps using 3 × 3 k ernels. After three further max p ooling and conv olution lay ers, the output of the “Enco der” stage are 128 feature maps of dimension 16 × 16. The Enco der output is used in tw o wa ys. The first branch is the input to the Deep Em b edded Clustering (DEC) netw ork (green b o xes depicting fully con- nected lay ers) that outputs a cluster lab el indicating severit y score. The second branc h from the Enco der is connected, along with the input volume’s disease lab el, to a fully connected (FC) lay er (orange b o xes) ha ving 4096 neurons. It is follow ed by t wo more FC la yers of 4096 neurons each and the final output is the set of registration parameters. The “Class Lab el id” (disease lab el of input v olume) and the Enco der output are combined using a global p o oling step. The motiv ation b ehind com bining the t wo is as follows: W e are interested to register, for example, a normal v olume to the normal atlas. The ground truth registration parameters of a normal v olume corresp ond to those obtained when registering the input volume to the normal atlas, and we wan t the regression netw ork to predict these parameters. F eeding the input volume’s actual disease lab el guides the regression netw ork to register the image to the corresponding atlas. 2.4 T raining Stage Implemen tation The en tire dataset is divided into training (70%), v alidation (10%) and test (20%) folds for eac h class. The DEC parameter initialization closely follows the steps outlined in [72]. The regression net work is trained using the input im- ages, their labels and the corresp onding registration parameters. W e augment the datasets 150 times by rotation and flipping and obtain their registration parameters with the corresp onding atlas. In the first phase of training only the regression netw ork is trained using mean squared error (MSE) loss for 50 epo chs to get an initial set of w eights. Subsequently , the DEC is trained using the out- put of the Enco der net w ork. After training is complete w e cluster the differen t v olumes and observe that 97 . 8% of the normal patients are assigned to clusters 1 , 2 and 3. 97 . 5% of Diab etic macular Edema (DME) cases are assigned to clus- ters 4 , 5 , 6 and 7, while 97 . 2% of AMD cases are assigned to clusters 8 , 9 and 10. 4 Fig. 1. Architecture of our proposed netw ork for AMD classification and sev erity es- timation. A regression netw ork for image registration and deep embedded clustering net work are combined to ac hieve our ob jectiv es. Th us the follo wing mapping betw een image lab els and cluster labels are obtained Normal ∈ { 1 , 2 , 3 } , DME ∈ { 4 , 5 , 6 , 7 } , and AMD ∈ { 8 , 9 , 10 } . 2.5 Predicting Sev erity of test image When a test image comes in we first use the trained DEC to predict the cluster lab el, which apart from providing disease severit y on a scale of [1 , 10] also gives the image’s disease class. The disease label is then used to predict the image’s registration parameters to the corresp onding atlas. Dep ending upon the desired lev el of granularit y of disease severit y the num b er of clusters can b e v aried to iden tify different cohorts that exhibit sp ecific traits. 3 Exp erimen tal Results W e demonstrate the effectiveness of our algorithm on a public dataset [66,19,29,61,59,60,58] consisting of OCT v olumes from 50 normal, 48 dry AMD, and 50 DME patients. The axial resolution of the images is 3 . 5 µ -m with scan dimension of 512 × 1024 pixels. The num b er of B-scans v aries betw een 19 , 25 , 31 , 61 p er volume in dif- feren t patients. The dataset is publicly av ailable at http://www.biosigdata.com. F or all registration steps w e used a grid size of 16 × 16 × 16. The n umber of predicted grid parameters are 16 3 = 4096 3.1 Registration Results The output registration parameters from our metho d are used to generate a de- formation field using B-splines and compared with outputs of other registration 5 metho ds. F or the purp ose of quantitativ e ev aluation w e applied simulated defor- mation fields and use differen t registration methods to reco ver the registration field. V alidation of accuracy is based on mean absolute distance (MAD) b et w een applied and reco vered deformation fields. W e also manually annotate retinal la y- ers and compute their 95% Hausdorff Distance ( H D 95 ) and Dice Metric (DM) b efore and after registration. Our method was implemented with Python and Keras, using SGD and Adam with β 1 = 0 . 93 and batc h normalization. T raining and test was p erformed on a NVIDIA T esla K40 GPU with 12 GB RAM. T able 1 compares results of the following metho ds: 1) R eg − D E C : Our prop osed metho d; 2) Reg N oDE C : Reg − D E C using only the registration without additional clustering; 3) V oxel M or ph : The metho d of [3,13,15,71,14,12,56]; 4) F low N et : - the registration method of [6,50,51,52,54,47,48]; 5) DI R N et : - the metho d of [70,45,44,49,64,41]; 6) Reg − k M eans - replacing DEC with kmeans clustering. Our metho d outperforms the state of the art DL based registration metho ds. 3.2 Classification Results T able 2 summarizes the performance of different metho ds on the test set for classifying b et ween normal, DME and AMD. Results are also sho wn for CNN based classification netw orks such as V GG-16 [67], Resnet [8] and DenseNet [9], three of the most widely used classification CNNs and the multiscale CNN ensem ble of [66] that serv es as the baseline for this dataset. Our prop osed metho d outp erforms standard CNN arc hitectures, th us proving the efficacy of com bining registration with clustering for classification tasks. It also shows Reg − D E C ’s adv antages of low er computing time and fewer training parameters. 3.3 Iden tification of Disease Subgroups And Explainability Besides predicting a disease lab el and severit y score, our metho d pro vides ex- plainabilit y behind the decision. F or a given test image and its predicted registra- tion parameters w e calculate its l 2 distance from eac h of the 10 cluster cen ters to giv e us a single v alue quan tifying the sample’s similarity with each disease clus- ter. Let the sample s b e assigned to cluster i ∈ [1 , 10] and let the corresp onding Bef. After Registration Reg Reg-DEC Reg N oD E C Reg-kMeans DIRNet Flo wNet V oxelMorph DM(%) 78.9 89.3 85.9 84.8 83.5 87.6 88.0 HD 95 (mm) 12.9 6.9 8.4 8.7 9.8 7.5 7.4 MAD 13.7 7.3 8.9 10.3 9.1 8.6 7.9 Time(s) 0.5 0.4 0.6 0.5 0.6 0.6 T able 1. Image registration results from differen t metho ds. T ime indicates computa- tion time in seconds. 6 l 2 distances of s to each cluster b e d i . W e calculate a normalized v alue p d = d i − d 1 d 10 − d i , (2) where p d giv es a probabilit y of the test sample reaching the highest severit y score. It is also a severit y score on a normalized scale of [0 , 1]. Scores from m ultiple visits help to build a patien t sev erity profile for analysing differen t factors b ehind increase or decrease of severit y , as well as the corresp onding rate of c hange. The rate of sev erity change is an important factor to determine a p ersonalized diagnosis plan. p d is different from the class probability obtained from a CNN classifier. The classifier probability is its confidence in the decision while p d giv es the probability of transitioning to the most sev ere stage. T ables 1,2 demonstrate Reg − D E C ’s superior p erformance for classification and registration. T o determine Reg − D E C ’s effectiveness in predicting disease sev erity of classes not part of the training data, we train our severit y prediction net work on normal and AMD images only , leaving out the DME affected images. W e keep the same n umber of clusters (i.e., 10) as be fore. Since there are no DME images and num ber of clusters is unc hanged, assignment of images to clusters is differen t than b efore. In this case 96 . 4% of AMD images are assigned to clusters 8 , 9 , 10 which is a drop of 0 . 8% than the previous assignment while 96 . 5% of normal samples are assigned to clusters 1 , 2 , 3 which is decrease of 1 . 3%. W e see few er images in clusters 4 , 5 , 6 , 7 although the ma jority of original assignmen ts of normal and AMD cases are unchanged. When w e use this trained mo del on the DME images we find that 96 . 9% of the images are assigned to clusters 4 , 5 , 6 , 7, a decrease of 0 . 9% from before. The ab o ve results lead to the follo wing conclusions: 1) Reg − D E C ’s performance reduces by 0 . 9% for DME and maximum of 1 . 3% (for Normal images) when DME images were not part of the training data. This is not a significant drop indicating Reg − D E C ’s capacit y to identify sub-groups that were not part of the training data. 2) Using k-means clustering do es not give same p erformance levels demonstrating that end to end feature learning com bined with clustering gives muc h b etter results than p erforming the steps separately . Reg − D E C accurately predicts disease sev erity even though there is no standard sev erity grading scale. Severit y scale also identifies sub-groups from the p opulation with a sp ecific disease activit y . Figure 2 first and second columns, respectively , sho w AMD images accurately classified by R eg − D E C and DenseNet. The yello w arro ws highlight regions of Reg − D E C V GG 16 ResN et 50 D enseN et DEC kmeans MultCNN [66] Sen 93.6 91.7 92.5 92.6 89.5 85.7 92.5 Sp e 94.3 92.8 93.6 93.5 90.6 86.8 93.4 A UC 96.4 94.1 95.2 95.3 91.9 87.7 95.2 Time(h) 4.3 16.7 12.4 13.6 2.5 0.5 15.1 T able 2. Classification results for AMD, DME and normal on the test set using dif- feren t netw orks. Time indicates training time in hours. 7 abnormalit y iden tified b y clinicians. Red ellipses (in first column) show the region of disease activit y . The length of ma jor axis quan tifies magnitude of displacemen t of the corresp onding grid point, and the orientation indicates direction. The lo cal displacemen t magnitude is prop ortional to disease severit y while the orientation iden tifies the exact location. The second column shows the corresponding CAMs obtained from DenseNet (region highlighted in green). Although the CAMs in- clude the region of disease activit y it does not localize it accurately and is spread out, nor do es it output a measurable v alue. By dividing the displacement mag- nitude with the distance b et ween the grid p oin ts w e get a v alue very close to p d . The adv antages of our registration based method is ob vious since it pinp oin ts abnormalit y and quantifies it in terms of displacement magnitude and angle. Figure 2 third column sho ws examples of normal images that were rightly classified b y Reg − D E C but incorrectly classified as AMD by DenseNet. The green regions highlight disease activt y as identified by DenseNet, which is er- roneous since there are no abnormalities here. Reg − DE C do es not show any lo calization of pathologies in these examples. The fourth column sho ws examples of DME that w ere righ tly identified b y Reg − D E C , despite not b eing being part of the training data, alongwith red ellipses sho wing localized regions of disease activit y . They were assigned to clusters 4 , 6 , 7 resp ectiv ely . The CNNs trained to classify AMD and normal w ould mostly classify the second and third image as diseased while the first image w as usually classified as normal because of its similar app earance to some normal images. Th us, our metho d iden tifies different patien t cohorts despite those not b eing part of the training data. (a) (b) (c) (d) Fig. 2. Example of misclassified images. Y ello w arrows sho w p ositions of diseased ac- tivit y in AMD images. (a) predictions by Reg − D E C and quanitfication of disease activit y; (b) CAMs by DenseNet; (c) normal images inaccurately classified as AMD by DenseNet with CAMs; (d) DME images correctly classified by Reg − DE C . Red circles are prop ortional to disease severit y . 8 4 Conclusion W e prop ose a metho d to predict disease severit y from retinal OCT images despite there being no lab els pro vided for the disease severit y . CNN regressor predicts registration parameters for a giv en test image which are undergo clustering to output a disease severit y scale and a disease probability score in addition to the classification label (diseased or normal). Experimental results sho w our propo sed metho d ac hieves b etter registration and classification p erformance compared to existing approaches. W e are able to identify distinct patien t cohorts not part of training data. Our approac h also pro vides explainabilit y b ehind the classification decision by quantifying disease activity from the registration parameters. References 1. h ttps://www.eyepacs.com 2. ”the insigh t segmentation and registration to olkit” www.itk.org 3. Balakrishnan, G., Zhao, A., Sabuncu, M., Guttag, J.: An supervised learning model for deformable medical image registration. In: Pro c. CVPR. pp. 9252–9260 (2018) 4. Bozorgtabar, B., Mahapatra, D., v on T eng, H., Pollinger, A., Ebner, L., Thiran, J.P ., M.Reyes.: Informative sample generation using class a ware generative ad- v ersarial netw orks for classification of chest xrays. Computer Vision and Image Understanding 184, 57–65 (2019) 5. D. Mahapatra, B.B., Garna vi, R.: Image sup er-resolution using progressiv e gen- erativ e adversarial netw orks for medical image analysis. Computerized Medical Imaging and Graphics 71(1), 30–39 (2019) 6. Doso vitskiy , A., Fischer, P ., et. al.: Flownet: Learning optical flow with conv olu- tional net works. In: In Pro c. IEEE ICCV. pp. 2758–2766 (2015) 7. Graziani, M., Andrearczyk, V., Mller, H.: Regression concept v ectors for bidirec- tional explanations in histopathology . In: In Pro c. MICCAI-iMIMIC. pp. 124–132 (2018) 8. He, K., Zhang, X., Ren, S., Sun, J.: Deep residual learning for image recognition. In: In Pro c. CVPR (2016) 9. Huang, G., Liu, Z., v an der Maaten, L., W einberger, K.: Densely connected con- v olutional netw orks. In: https://arxiv.org/abs/1608.06993, (2016) 10. Kuang, H., Guthier, B., Saini, M., Mahapatra, D., Saddik, A.E.: A real-time smart assistan t for video surveillance through handheld devices. In: In Pro c: ACM Intl. Conf. Multimedia. pp. 917–920 (2014) 11. Li, Z., Mahapatra, D., J.Tielbeek, Stoker, J., v an Vliet, L., V os, F.: Image registra- tion based on auto correlation of lo cal structure. IEEE T rans. Med. Imaging 35(1), 63–75 (2016) 12. Mahapatra, D.: Neonatal brain mri skull stripping using graph cuts and shape priors. In: In Pro c: MICCAI w orkshop on Image Analysis of Human Brain Dev el- opmen t (IAHBD) (2011) 13. Mahapatra, D.: Cardiac lv and rv segmentation using m utual context information. In: Pro c. MICCAI-MLMI. pp. 201–209 (2012) 14. Mahapatra, D.: Group wise registration of dynamic cardiac p erfusion images using temp oral information and segmentation information. In: In Pro c: SPIE Medical Imaging (2012) 9 15. Mahapatra, D.: Landmark detection in cardiac mri using learned lo cal image statis- tics. In: Proc. MICCAI-Statistical Atlases and Computational Mo dels of the Heart. Imaging and Mo delling Challenges (ST ACOM). pp. 115–124 (2012) 16. Mahapatra, D.: Skull stripping of neonatal brain mri: Using prior shap e information with graphcuts. J. Digit. Imaging 25(6), 802–814 (2012) 17. Mahapatra, D.: Cardiac image segmen tation from cine cardiac mri using graph cuts and shap e priors. J. Digit. Imaging 26(4), 721–730 (2013) 18. Mahapatra, D.: Cardiac mri segmentation using mutual context information from left and righ t ven tricle. J. Digit. Imaging 26(5), 898–908 (2013) 19. Mahapatra, D.: Graph cut based automatic prostate segmentation using learned seman tic information. In: Pro c. IEEE ISBI. pp. 1304–1307 (2013) 20. Mahapatra, D.: Join t segmentation and group wise registration of cardiac perfusion images using temp oral information. J. Digit. Imaging 26(2), 173–182 (2013) 21. Mahapatra, D.: Automatic cardiac segmentation using semantic information from random forests. J. Digit. Imaging. 27(6), 794–804 (2014) 22. Mahapatra, D.: Com bining m ultiple expert annotations using semi-sup ervised learning and graph cuts for medical image segmentation. Computer Vision and Image Understanding 151(1), 114–123 (2016) 23. Mahapatra, D.: Semi-sup ervised learning and graph cuts for consensus based med- ical image segmen tation. Pattern Recognition 63(1), 700–709 (2017) 24. Mahapatra, D., Bozorgtabar, S., Hewa vitahranage, S., Garnavi, R.: Image super resolution using generative adversarial netw orks and lo cal saliencymaps for retinal image analysis,. In: In Proc. MICCAI. pp. 382–390 (2017) 25. Mahapatra, D., Bozorgtabar, S., Thiran, J.P ., Rey es, M.: Efficient active learning for image classification and segmentation using a sample selection and conditional generativ e adversarial netw ork. In: In Pro c. MICCAI (2). pp. 580–588 (2018) 26. Mahapatra, D., Buhmann, J.: Obtaining consensus annotations for retinal image segmen tation using random forest and graph cuts. In: In Proc. OMIA. pp. 41–48 (2015) 27. Mahapatra, D., Buhmann, J.: Visual saliency based active learning for prostate mri segmen tation. In: In Pro c. MLMI. pp. 9–16 (2015) 28. Mahapatra, D., Buhmann, J.: Visual saliency based active learning for prostate mri segmen tation. SPIE Journal of Medical Imaging 3(1) (2016) 29. Mahapatra, D., Buhmann, J.: Automatic cardiac rv segmen tation using semantic information with graph cuts. In: Proc. IEEE ISBI. pp. 1094–1097 (2013) 30. Mahapatra, D., Buhmann, J.: Analyzing training information from random forests for improv ed image segmen tation. IEEE T rans. Imag. Proc. 23(4), 1504–1512 (2014) 31. Mahapatra, D., Buhmann, J.: Prostate mri segmentation using learned semantic kno wledge and graph cuts. IEEE T rans. Biomed. Engg. 61(3), 756–764 (2014) 32. Mahapatra, D., Buhmann, J.: A field of exp erts model for optic cup and disc segmen tation from retinal fundus images. In: In Proc. IEEE ISBI. pp. 218–221 (2015) 33. Mahapatra, D., Ge, Z.: T raining data independent image registration with gans using transfer learning and segmen tation information. In: In Pro c. IEEE ISBI (2019) 34. Mahapatra, D., Ge, Z., Sedai, S., Chakra vort y ., R.: Joint registration and segmen- tation of xray images using generative adversarial net works. In: In Pro c. MICCAI- MLMI. pp. 73–80 (2018) 10 35. Mahapatra, D., Gilani, S., Saini., M.: Coherency based spatio-temporal saliency detection for video ob ject segmentation. IEEE Journal of Selected T opics in Signal Pro cessing. 8(3), 454–462 (2014) 36. Mahapatra, D., J.Tielb eek, Mak any anga, J., Stoker, J., T aylor, S., V os, F., Buh- mann, J.: Automatic detection and segmentation of crohn’s disease tissues from ab dominal mri. IEEE T rans. Med. Imaging 32(12), 1232–1248 (2013) 37. Mahapatra, D., J.Tielb eek, Mak any anga, J., Stoker, J., T aylor, S., V os, F., Buh- mann, J.: Active learning based segmentation of crohn’s disease using principles of visual saliency . In: Pro c. IEEE ISBI. pp. 226–229 (2014) 38. Mahapatra, D., J.Tielb eek, Mak any anga, J., Stoker, J., T aylor, S., V os, F., Buh- mann, J.: Combiningm ultiple exp ert annotations using semi-sup ervised learning and graph cuts for crohns disease segmentation. In: In Pro c: MICCAI-ABD (2014) 39. Mahapatra, D., J.Tielb eek, V os, F., Buhmann, J.: A sup ervised learning approach for crohn’s disease detection using higher order image statistics and a nov el shape asymmetry measure. J. Digit. Imaging 26(5), 920–931 (2013) 40. Mahapatra, D., Li, Z., V os, F., Buhmann, J.: Joint segmentation and groupwise registration of cardiac dce mri using sparse data representations. In: In Proc. IEEE ISBI. pp. 1312–1315 (2015) 41. Mahapatra, D., Routra y , A., Mishra, C.: An active snak e mo del for classification of extreme emotions. In: IEEE International Conference on Industrial T echnology (ICIT). pp. 2195–2199 (2006) 42. Mahapatra, D., Roy , P ., Sedai, S., Garna vi, R.: A cnn based neurobiology inspired approac h for retinal image quality assessment. In: In Pro c. EMBC. pp. 1304–1307 (2016) 43. Mahapatra, D., Roy , P ., Sedai, S., Garnavi, R.: Retinal image quality classification using saliency maps and cnns. In: In Proc. MICCAI-MLMI. pp. 172–179 (2016) 44. Mahapatra, D., Roy , S., Sun, Y.: Retriev al of mr kidney images by incorp orating spatial information in histogram of low level features. In: In 13th International Conference on Biomedical Engineering (2008) 45. Mahapatra, D., Saini, M., Sun, Y.: Illumination in v arian t trac king in office envi- ronmen ts using neurobiology-saliency based particle filter. In: IEEE ICME. pp. 953–956 (2008) 46. Mahapatra, D., Sch ¨ u ffler, P ., Tielb eek, J., V os, F., Buhmann, J.: Semi-supervised and activ e learning for automatic segmentation of crohn’s disease. In: Pro c. MIC- CAI, P art 2. pp. 214–221 (2013) 47. Mahapatra, D., Sun, Y.: Nonrigid registration of dynamic renal MR images using a saliency based MRF model. In: Pro c. MICCAI. pp. 771–779 (2008) 48. Mahapatra, D., Sun, Y.: Registration of dynamic renal MR images using neurobi- ological mo del of saliency . In: Pro c. ISBI. pp. 1119–1122 (2008) 49. Mahapatra, D., Sun, Y.: Using saliency features for graphcut segmentation of p er- fusion kidney images. In: In 13th In ternational Conference on Biomedical Engi- neering (2008) 50. Mahapatra, D., Sun, Y.: Joint registration and segmentation of dynamic cardiac p erfusion images using mrfs. In: Pro c. MICCAI. pp. 493–501 (2010) 51. Mahapatra, D., Sun., Y.: An mrf framew ork for join t registration and segmen tation of natural and perfusion images. In: Pro c. IEEE ICIP . pp. 1709–1712 (2010) 52. Mahapatra, D., Sun, Y.: Retriev al of perfusion images using cosegmen tation and shap e context information. In: Pro c. APSIP A Annual Summit and Conference (ASC) (2010) 11 53. Mahapatra, D., Sun, Y.: Rigid registration of renal p erfusion images using a neu- robiology based visual saliency mo del. EURASIP Journal on Image and Video Pro cessing. pp. 1–16 (2010) 54. Mahapatra, D., Sun, Y.: A saliency based mrf metho d for the joint registration and segmen tation of dynamic renal mr images. In: Pro c. ICDIP (2010) 55. Mahapatra, D., Sun, Y.: Mrf based intensit y in v arian t elastic registration of cardiac p erfusion images using saliency information. IEEE T rans. Biomed. Engg. 58(4), 991–1000 (2011) 56. Mahapatra, D., Sun, Y.: Orientation histograms as shap e priors for left ven tricle segmen tation using graph cuts. In: In Pro c: MICCAI. pp. 420–427 (2011) 57. Mahapatra, D., Sun, Y.: Integrating segmen tation information for improv ed mrf- based elastic image registration. IEEE T rans. Imag. Proc. 21(1), 170–183 (2012) 58. Mahapatra, D., Ti elb eek, J., Buhmann, J., V os, F.: A supervised learning based ap- proac h to detect crohn’s disease in ab dominal mr v olumes. In: Pro c. MICCAI work- shop Computational and Clinical Applications in Ab dominal Imaging(MICCAI- ABD). pp. 97–106 (2012) 59. Mahapatra, D., Tielb eek, J., V os, F., ., J.B.: Crohn’s disease tissue segmen tation from ab dominal mri using seman tic information and graph cuts. In: Pro c. IEEE ISBI. pp. 358–361 (2013) 60. Mahapatra, D., Tielb eek, J., V os, F., Buhmann, J.: Lo calizing and segmenting crohn’s disease affected regions in ab dominal mri using nov el con text features. In: Pro c. SPIE Medical Imaging (2013) 61. Mahapatra, D., Tielb eek, J., V os, F., Buhmann, J.: W eakly supervised semantic segmen tation of crohn’s disease tissues from ab dominal mri. In: Pro c. IEEE ISBI. pp. 832–835 (2013) 62. Mahapatra, D., V os, F., Buhmann, J.: Crohn’s disease segmentation from mri using learned image priors. In: In Proc. IEEE ISBI. pp. 625–628 (2015) 63. Mahapatra, D., V os, F., Buhmann, J.: Active learning based segmentation of crohns disease from abdominal mri. Computer Methods and Programs in Biomedicine 128(1), 75–85 (2016) 64. Mahapatra, D., Winkler, S., Y en, S.: Motion saliency outw eighs other low-lev el features while w atching videos. In: SPIE HVEI. pp. 1–10 (2008) 65. P ereira, S., Meier, R., Alves, V., Reyes, M., Silv a., C.: Automatic brain tumor grading from mri data using conv olutional neural net w orks and qualit y assessmen t. In: In Pro c. MICCAI-iMIMIC. pp. 106–114 (2018) 66. Rasti, R., Rabbani, H., Mehri, A., Ha jizadeh, F.: Macular oct classification using a m ulti-scale conv olutional neural net work ensemble. IEEE T rans. Med. Imag. 37(4), 1024–1034 (2018) 67. Simon yan, K., Zisserman., A.: V ery deep conv olutional net works for large-scale image recognition. CoRR abs/1409.1556 (2014) 68. Sok o oti, H., de V os, B., Berendsen, F., Lelieveldt, B., Isgum, I., Staring, M.: Non- rigid image registration using m ultiscale 3d conv olutional neural net works. In: MIC- CAI. pp. 232–239 (2017) 69. Vincen t, P ., Laro chelle, H., La joie, I., Bengio, Y., Manzagol, P .: Stack ed denois- ing auto encoders: Learning useful represen tations in a deep net work with a lo cal denoising criterion. Journal of Mac h. Learn. Res. 11, 3371–3408 (2010) 70. de V os, B., Berendsen, F., Viergev er, M., Staring, M., Isgum, I.: End-to-end un- sup ervised deformable image registration with a con volutional neural netw ork. In: arXiv preprin t arXiv:1704.06065 (2017) 12 71. V os, F.M., Tielb eek, J., Naziroglu, R., Li, Z., Sc h ¨ u ffler, P ., Mahapatra, D., Wieb el, A., La vini, C., Buhmann, J., Hege, H., Stoker, J., v an Vliet, L.: Computational mo deling for assessmen t of IBD: to be or not to b e? In: Pro c. IEEE EMBC. pp. 3974–3977 (2012) 72. Xie, J., Girshick, R., F arhadi, A.: Unsup ervised deep embedding for clustering analysis. In: Pro c. ICML. pp. 478–487 (2016) 73. Zhou, B., Khosla, A., Lap edriza, A., Oliv a, A., T orralba, A.: Learning deep features for discriminativ e lo calization. In: Proc. CVPR. pp. 2921–2929 (2016) 74. Zilly , J., Buhmann, J., Mahapatra, D.: Bo osting conv olutional filters with entrop y sampling for optic cup and disc image segmentation from fundus images. In: In Pro c. MLMI. pp. 136–143 (2015) 75. Zilly , J., Buhmann, J., Mahapatra, D.: Glaucoma detection using en tropy sampling and ensemble learning for automatic optic cup and disc segmentation. In Press Computerized Medical Imaging and Graphics 55(1), 28–41 (2017)
Original Paper
Loading high-quality paper...
Comments & Academic Discussion
Loading comments...
Leave a Comment