Dashboard Task Monitor for Managing ATLAS User Analysis on the Grid
The organization of the distributed user analysis on the Worldwide LHC Computing Grid (WLCG) infrastructure is one of the most challenging tasks among the computing activities at the Large Hadron Collider. The Experiment Dashboard offers a solution that not only monitors but also manages (kill, resubmit) user tasks and jobs via a web interface. The ATLAS Dashboard Task Monitor provides analysis users with a tool that is independent of the operating system and Grid environment. This contribution describes the functionality of the application and its implementation details, in particular authentication, authorization and audit of the management operations.
💡 Research Summary
The paper presents the “Dashboard Task Monitor,” a web‑based tool that enables ATLAS physicists to monitor and actively manage their analysis jobs running on the Worldwide LHC Computing Grid (WLCG). With more than 350 000 analysis jobs submitted daily, the need for a responsive, user‑friendly interface that works across operating systems and grid environments is critical. The authors describe the architecture, security model, user interface, and operational experience of the system.
Architecture
The solution is built on three logical layers. The first layer consists of collectors that ingest job‑status information from multiple sources: the PanDA workload management database, GANGA submissions to the gLite Workload Management System, local batch systems, and ActiveMQ message brokers. All collected data are stored in the Dashboard Data Repository, an Oracle‑based backend. The second layer provides services that expose this data through REST‑like APIs, enabling other Dashboard components to retrieve monitoring information. The third layer is the user‑facing web interface, implemented with the hBrowse framework. hBrowse follows a client‑side Model‑View‑Controller (MVC) pattern: the model holds cached job data and UI state, the view renders tables, charts (via Highcharts), and controls, while the controller synchronises the URL hash with the model and handles user actions through AJAX calls.
User Interface
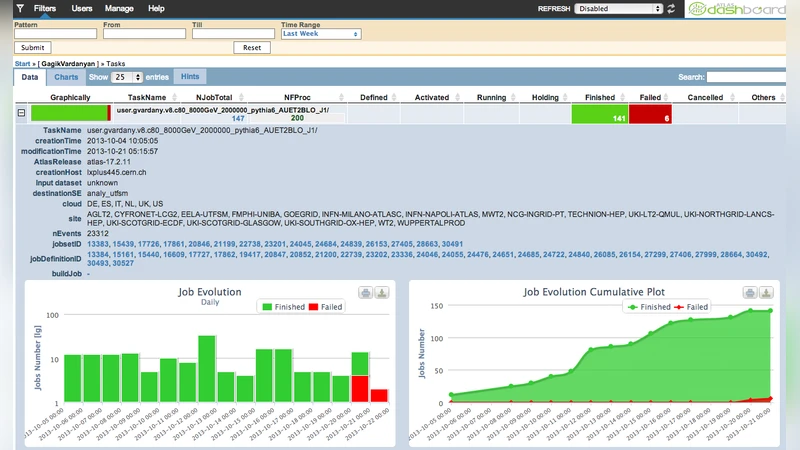
The UI offers two operational modes: View and Manage. In View mode any authenticated user can inspect his/her own tasks as well as those of collaborators, applying filters by time range, site, or job status. Rich visualisations such as “Jobs distributed by site,” failure‑reason breakdowns, and resubmission histories help users diagnose problems quickly. Manage mode is restricted to the task owner and provides fine‑grained control: users can kill all jobs in a task, kill only jobs running on a specific site, or select individual jobs for termination. All actions are performed without page reload, thanks to asynchronous communication, and the interface supports on‑the‑fly filtering, sorting, pagination, bookmarking, and a refresh button.
Security Model
Access to the Dashboard is granted only to users possessing a valid X.509 Grid certificate. Authentication is performed over HTTPS with mandatory client‑certificate verification, ensuring mutual TLS. Upon successful login, the server generates a strong, random session identifier, stores it in the Dashboard Central Repository, and embeds it as a hidden field in subsequent POST requests. Session IDs are time‑limited and automatically expire after a configurable timeout. To prevent cross‑site request forgery (CSRF), the session token is combined with a CSRF nonce. All incoming parameters are sanitized against a whitelist and regular expressions; server‑side code uses prepared statements with bound variables to eliminate SQL injection risks. The kill/resubmit operations include an authorization check that compares the distinguished name (DN) of the requester with the DN of the job owner; only a match permits the action. Comprehensive audit logging records client IP, request parameters, user DN, and PanDA server responses in three locations (local log file, CERN Central Security Logging, and the Dashboard Central Repository) to support forensic analysis.
Operational Experience and Future Work
The system has been deployed for several years and is now widely used by both experienced and novice ATLAS analysts. Security testing by CERN experts confirmed the robustness of the kill functionality. Users appreciate the intuitive UI, the breadth of visual analytics, and the ability to manage jobs directly from a browser. Planned enhancements include adding a “resubmit” button to the Manage UI, integrating automated error‑recovery workflows, and exploring machine‑learning‑driven anomaly detection to proactively flag problematic sites or jobs.
In summary, the Dashboard Task Monitor successfully bridges the gap between complex grid‑level job management and end‑user accessibility, delivering real‑time monitoring, secure job control, and rich visual feedback within a single, platform‑independent web application. Its design principles—modular collectors, a central data repository, a clean MVC front‑end, and a rigorous security framework—make it a valuable reference for other large‑scale distributed computing projects.
Comments & Academic Discussion
Loading comments...
Leave a Comment