Integration of LiDAR and multispectral images for exposure and earthquake vulnerability estimation. Application in Lorca, Spain
We present a procedure for assessing the urban exposure and seismic vulnerability that integrates LiDAR data with aerial and satellite images. It comprises three phases: first, we segment the satellite image to divide the study area into different urban patterns. Second, we extract building footprints and attributes that represent the type of building of each urban pattern. Finally, we assign the seismic vulnerability to each building using different machine-learning techniques: Decision trees, SVM, logistic regression and Bayesian networks. We apply the procedure to 826 buildings in the city of Lorca (SE Spain), where we count on a vulnerability database that we use as ground truth for the validation of results. The outcomes show that the machine learning techniques have similar performance, yielding vulnerability classification results with an accuracy of 77% - 80% (F1-Score). The procedure is scalable and can be replicated in different areas. It is especially interesting as a complement to conventional data gathering approaches for disaster risk applications in areas where field surveys need to be restricted to certain areas, dates or budget. Keywords LiDAR, satellite image, orthophoto, image segmentation, machine learning, earthquake vulnerability.
💡 Research Summary
**
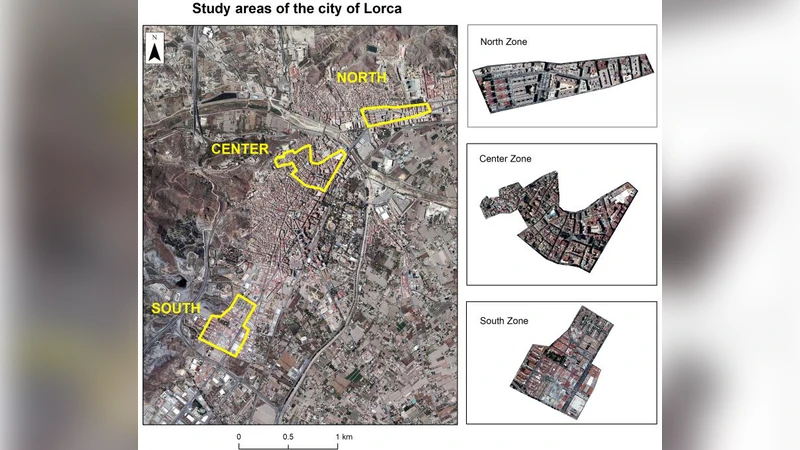
The paper presents an integrated workflow for assessing urban exposure and seismic vulnerability by combining airborne LiDAR point clouds, multispectral satellite imagery, and orthophotos. The case study focuses on Lorca, Spain, where a ground‑truth database of 826 buildings—derived from post‑2011 earthquake field surveys—provides the reference for validation. The workflow is divided into three distinct phases.
Phase 1 performs a city‑wide stratification using an 11‑band Landsat‑8 image (30 m resolution, 12‑bit GeoTIFF). Object‑Based Image Analysis (OBIA) segments the image into homogeneous urban patterns (e.g., residential, commercial, industrial). These patterns serve as spatial masks that guide subsequent building extraction and attribute calculation.
Phase 2 extracts building footprints and derives geometric attributes. Two sources are compared: the official cadastral polygon layer and automatically generated footprints obtained from the OBIA segmentation. Although the automatic segmentation suffers from under‑ and over‑segmentation, a lightweight GIS post‑processing (buffering, smoothing) yields acceptable outlines. Building height is estimated directly from the LiDAR point cloud (average density 1 point / m²) using the proprietary “Magic Surface” algorithm, which classifies ground versus roof points and computes the mean elevation difference. Additional attributes such as plan area, estimated number of stories (height divided by assumed floor‑to‑floor height), and roof material (inferred from LiDAR intensity) are automatically calculated, eliminating the need for a separate image classification step.
Phase 3 allocates seismic vulnerability to each building. The target variable is the Model Building Type (MBT) defined by the Risk‑UE framework, which in Lorca collapses into six categories (one reinforced‑concrete type and five masonry types). Because the reference database groups the five masonry types into a single class for statistical robustness, the classification problem reduces to a binary distinction between reinforced‑concrete (RC) and masonry (M) structures. Four supervised machine‑learning models are trained: Decision Trees, Support Vector Machines (SVM), Logistic Regression, and Bayesian Networks. Each model undergoes 5‑fold cross‑validation and hyper‑parameter tuning. Performance is assessed using overall accuracy and the F1‑Score, which balances precision and recall for the minority class. All models achieve comparable results, with F1‑Scores ranging from 0.77 to 0.80, indicating that the selected geometric attributes are sufficiently discriminative for MBT prediction.
Key contributions of the study include: (1) Demonstrating that publicly available Spanish PNOA LiDAR and orthophoto products can be leveraged to build a cost‑effective exposure database without extensive field surveys; (2) Proposing a streamlined pipeline that bypasses labor‑intensive image classification by extracting all relevant attributes directly from LiDAR and footprint geometry; (3) Providing a systematic comparison of multiple machine‑learning classifiers, showing that model choice has limited impact when high‑quality input features are available.
Limitations are acknowledged. The relatively low LiDAR point density may hinder accurate height extraction in densely built‑up zones, potentially leading to under‑estimation of building volume. Moreover, the ground‑truth MBT labeling aggregates three distinct masonry typologies, which restricts the granularity of vulnerability assessment. Future work is suggested to incorporate higher‑density UAV‑LiDAR, hyperspectral data for refined roof‑material discrimination, and a multi‑class classification scheme that distinguishes all six MBT categories.
In conclusion, the presented methodology offers a scalable, reproducible approach for rapid generation of exposure and seismic vulnerability datasets. By reducing reliance on costly field campaigns, it supports disaster risk reduction initiatives, urban planning, and insurance underwriting, especially in regions where resources for extensive ground surveys are limited.
Comments & Academic Discussion
Loading comments...
Leave a Comment