An Interactive Insight Identification and Annotation Framework for Power Grid Pixel Maps using DenseU-Hierarchical VAE
Insights in power grid pixel maps (PGPMs) refer to important facility operating states and unexpected changes in the power grid. Identifying insights helps analysts understand the collaboration of various parts of the grid so that preventive and correct operations can be taken to avoid potential accidents. Existing solutions for identifying insights in PGPMs are performed manually, which may be laborious and expertise-dependent. In this paper, we propose an interactive insight identification and annotation framework by leveraging an enhanced variational autoencoder (VAE). In particular, a new architecture, DenseU-Hierarchical VAE (DUHiV), is designed to learn representations from large-sized PGPMs, which achieves a significantly tighter evidence lower bound (ELBO) than existing Hierarchical VAEs with a Multilayer Perceptron architecture. Our approach supports modulating the derived representations in an interactive visual interface, discover potential insights and create multi-label annotations. Evaluations using real-world PGPMs datasets show that our framework outperforms the baseline models in identifying and annotating insights.
💡 Research Summary
The paper addresses the problem of discovering and annotating “insights” in Power Grid Pixel Maps (PGPMs), which are visual representations of bus‑level variables (e.g., voltage) over time. Traditional approaches rely on manual inspection of thousands of chart images, a labor‑intensive process that requires deep domain expertise and suffers from a lack of labeled data. To overcome these challenges, the authors propose an end‑to‑end interactive framework that combines a novel deep generative model with a visual analytics interface, enabling analysts to explore latent representations, define semantic insights, and automatically generate multi‑label annotations.
Key Contributions
-
DenseU‑Hierarchical VAE (DUHiV) – A new hierarchical variational auto‑encoder architecture tailored for large‑scale PGPMs. The encoder incorporates a DenseNet‑121 backbone with dense blocks, improving feature reuse and gradient flow, while the decoder adopts a symmetric U‑Net up‑sampling path to preserve spatial detail. Two hierarchical configurations (2‑layer and 4‑layer latent spaces) are provided to accommodate datasets of different sizes. Compared with two baseline hierarchical VAEs that use multilayer perceptrons (Deep Latent Gaussian Model and Ladder VAE), DUHiV achieves a substantially tighter Evidence Lower Bound (ELBO) and produces higher‑fidelity reconstructions.
-
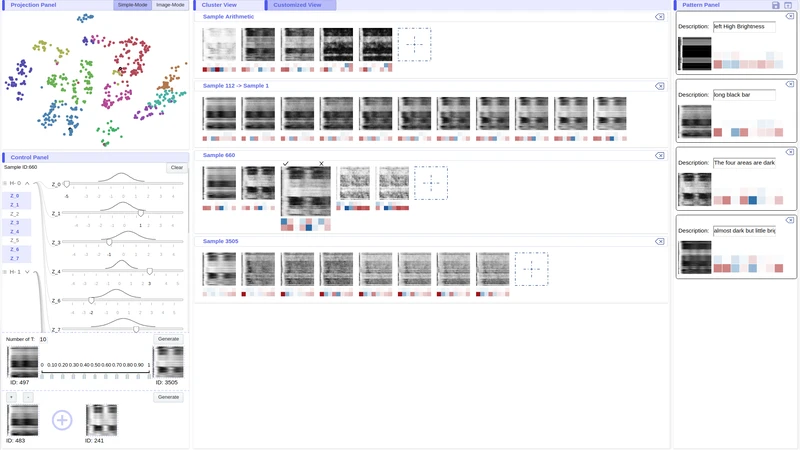
Interactive Insight Identification Interface – After training DUHiV, the posterior distribution (q_{\phi}(z|x)) of each PGPM is taken as its latent representation. The interface projects all PGPMs into a 2‑D space using t‑SNE and K‑means clustering, with blue‑noise sampling to reduce visual clutter. Analysts can:
- Walk through the latent space by adjusting individual latent dimensions and instantly view the reconstructed PGPM.
- Perform three types of arithmetic on latent vectors: random sampling with manual tweaks, linear interpolation between two PGPMs, and vector addition/subtraction.
- Observe semantic changes in the reconstructed images, allowing them to isolate a specific phenomenon (e.g., a voltage surge on a subset of buses) and record the corresponding latent vector as an “insight representation” together with a textual description.
-
Semi‑Supervised and Unsupervised Annotation Schemes – Once a set of insight representations ({p_i}) is defined, the framework can annotate the entire dataset:
- Semi‑supervised: Analysts label a small subset manually; DUHiV then learns from both labeled and unlabeled data to propagate labels.
- Unsupervised: For each PGPM, the mean of its posterior marginal distributions is compared to each insight vector using Euclidean distance, yielding a similarity vector that serves as multi‑label probabilities.
Experimental Evaluation
Two real‑world PGPM datasets are used:
- PGPM‑3K: 3,504 maps of size 368 × 464, manually annotated with 10 possible insight labels (average 2.5 labels per map). This dataset is used for quantitative evaluation.
- PGPM‑250K: 250,925 maps of size 800 × 640, used mainly to demonstrate scalability of DUHiV.
Sample Generation: DUHiV outperforms DLGM and Ladder VAE in visual quality and ELBO on PGPM‑3K, confirming that dense blocks and U‑Net decoding better capture the high‑resolution structure of PGPMs.
Insight Identification: Qualitative case studies show that analysts can isolate complex patterns (e.g., simultaneous voltage rise on a specific bus cluster) by navigating the latent space, something that automatic clustering alone cannot achieve.
Annotation Accuracy: Using the manually labeled PGPM‑3K as ground truth, the unsupervised similarity‑based labeling achieves ~85 % F1 score, while the semi‑supervised approach reaches >90 % F1, demonstrating that a small amount of human input dramatically boosts performance.
Strengths and Limitations
The paper’s strengths lie in (a) a well‑designed VAE that scales to large image sizes, (b) a thoughtful human‑in‑the‑loop interface that leverages the interpretability of latent vectors, and (c) thorough experimental validation on realistic power‑grid data. Limitations include reliance on t‑SNE for projection (which may distort high‑dimensional relationships), the need for domain experts to guide the definition of insight vectors, and limited quantitative evaluation on the massive PGPM‑250K set due to labeling constraints.
Future Directions
Potential extensions include automated semantic labeling of latent dimensions (e.g., using disentanglement metrics), replacing t‑SNE with more scalable dimensionality reduction methods like UMAP, and integrating temporal models (e.g., recurrent VAEs) to capture dynamic patterns across time windows. Moreover, expanding the framework to other grid variables (frequency, rotor angle) and to other domains with similar chart‑image data could broaden its impact.
In summary, the authors present a compelling combination of deep generative modeling and interactive visual analytics that significantly advances the state of the art in automated insight discovery and annotation for power‑grid visual data.
Comments & Academic Discussion
Loading comments...
Leave a Comment