A multi-room reverberant dataset for sound event localization and detection
This paper presents the sound event localization and detection (SELD) task setup for the DCASE 2019 challenge. The goal of the SELD task is to detect the temporal activities of a known set of sound event classes, and further localize them in space wh…
Authors: Sharath Adavanne, Archontis Politis, Tuomas Virtanen
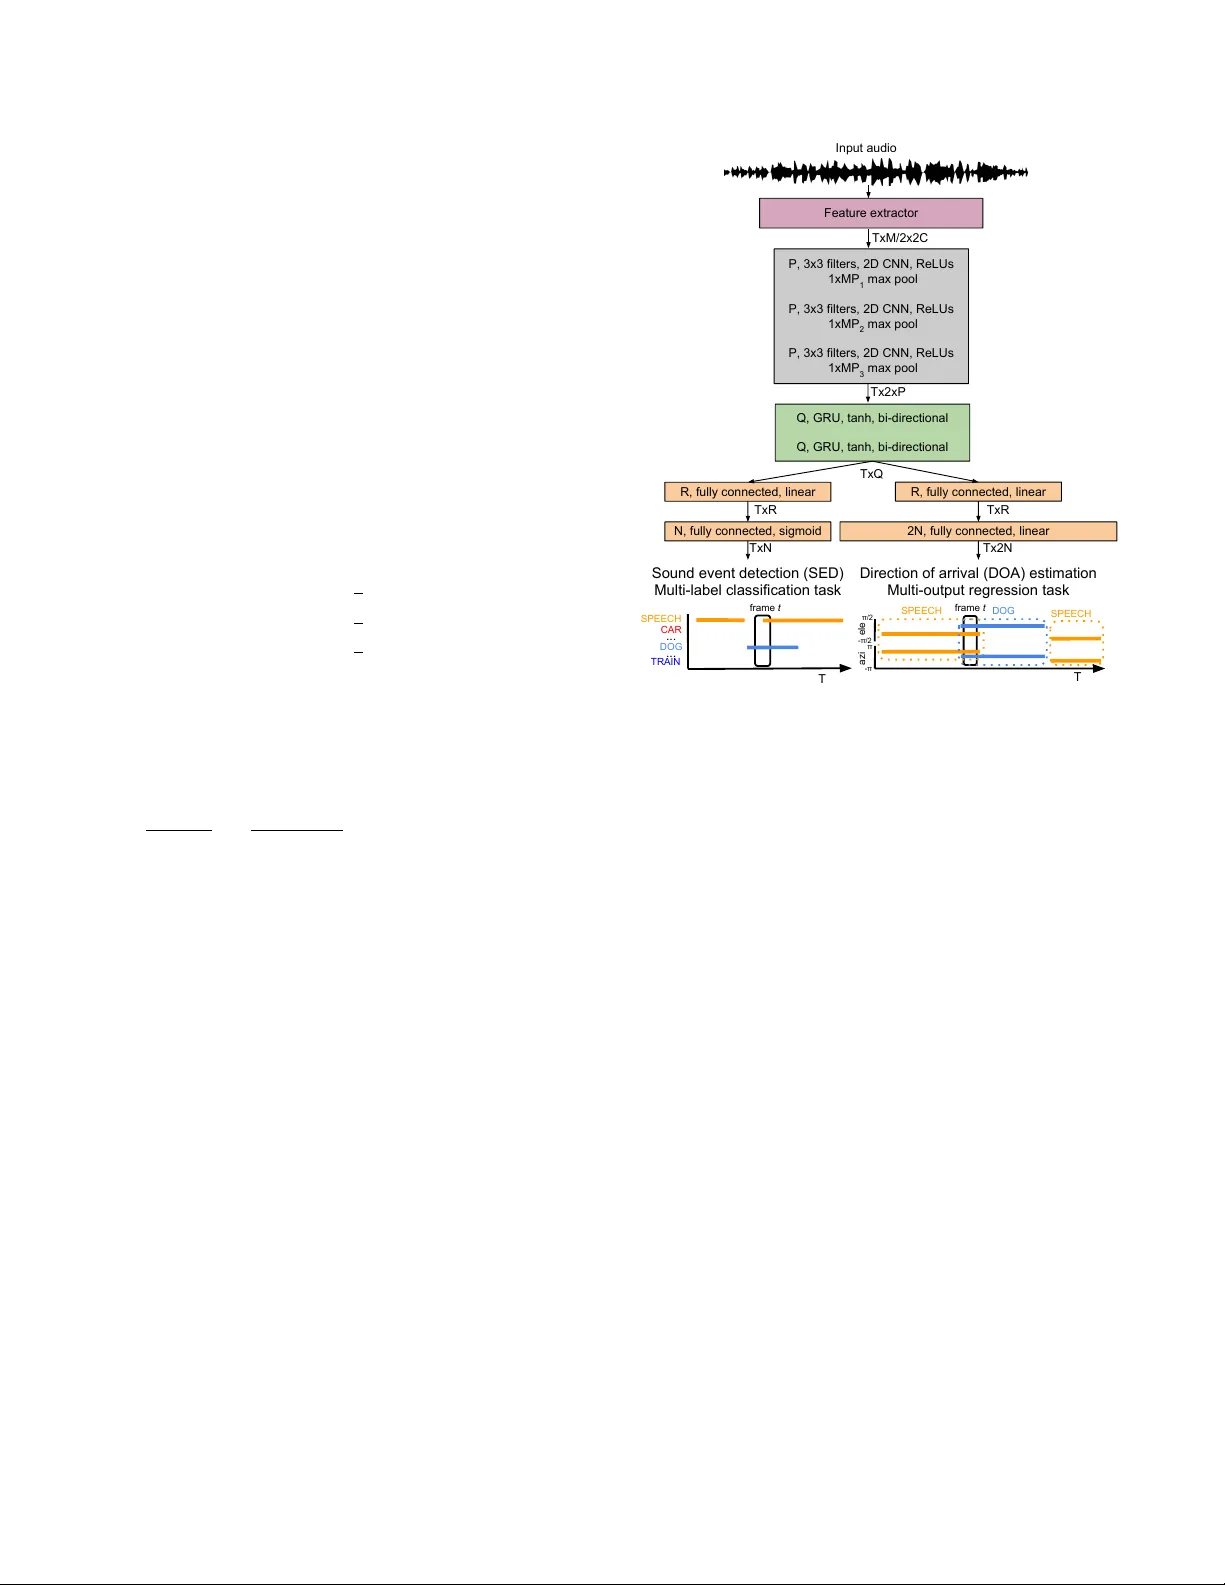
A MUL TI-R OOM REVERBERANT D A T ASET FOR SOUND EVENT LOCALIZA TION AND DETECTION Sharath Adavanne , Ar chontis P olitis, and T uomas V irtanen Audio Research Group, T ampere Univ ersity , Finland ABSTRA CT This paper presents the sound ev ent localization and detection (SELD) task setup for the DCASE 2019 challenge. The goal of the SELD task is to detect the temporal acti vities of a known set of sound ev ent classes, and further localize them in space when activ e. As part of the challenge, a synthesized dataset with each sound ev ent associated with a spatial coordinate represented using azimuth and elev ation angles is provided. These sound ev ents are spatialized using real-life impulse responses collected at multiple spatial coordinates in fi ve different rooms with v arying dimensions and material properties. A baseline SELD method employing a con volutional recurrent neural network is used to generate bench- mark scores for this rev erberant dataset. The benchmark scores are obtained using the recommended cross-validation setup. Index T erms — Sound ev ent localization and detection, sound ev ent detection, direction of arriv al, deep neural networks 1. INTR ODUCTION The goals of the sound ev ent localization and detection (SELD) task includes recognizing a kno wn set of sound ev ent classes such as ‘dog bark’, ‘bird call’, and ‘human speech’ in the acoustic scene, detecting their indi vidual onset and of fset times, and further local- izing them in space when acti ve. Such a SELD method can auto- matically describe human and social acti vities with a spatial dimen- sion, and help machines to interact with the world more seamlessly . Specifically , SELD can be an important module in assisted listening systems, scene information visualization systems, immersi ve inter- activ e media, and spatial machine cognition for scene-based deploy- ment of services. The number of existing methods for the SELD task are lim- ited [1–5] providing ample research opportunity . Thus to promote the research and de velopment of SELD methods we propose to or- ganize the SELD task at DCASE 2019 1 . Pre viously , the SELD task has been treated as two stand-alone tasks of sound ev ent de- tection (SED) and direction of arriv al (DOA) estimation [1]. The SED in [1] was performed using a classifier -based on Gaussian mix- ture model - hidden Marko v model, and the DO A estimation using the steered response power (SRP). In the presence of multiple over - lapping sound events, this approach resulted in the data association problem of assigning the individual sound e vents detected in a time- frame to their corresponding DO A locations. This data association problem was overcome in [2] by using a sound-model-based local- ization instead of the SRP method. Recent methods hav e proposed to jointly learn the SELD sub- tasks of SED and DOA estimation using deep neural networks This work has receiv ed funding from the European Research Council under the ERC Grant Agreement 637422 EVER YSOUND. 1 http://dcase.community/challenge2019/task-sound-ev ent-localization- and-detection (DNN). Based on the DOA estimation approach, these methods can be broadly categorized into classification [3] and regression approaches [5]. The classification approaches estimate a discrete set of angles, whereas the regression approaches estimate continu- ous angles. As the classification approach, Hirvonen [3] employed a conv olutional neural network and treated SELD as a multiclass- multilabel classification task. Po wer spectrograms extracted from multichannel audio were used as the acoustic feature and mapped to two sound classes at eight different azimuth angles. F ormally , the SELD task was performed by learning an acoustic model, pa- rameterized by parameters W , that estimates the probability of each sound class to be active at a certain time-frame, and discrete spatial angle P ( Y | X , W ) , where X ∈ R K × T × F is the frame- wise acoustic feature for each of the K channels of audio with feature-length F , and number of time-frames T . Y ∈ R T × C × U is the class-wise SELD probabilities for C sound classes and U num- ber of azimuth angles. The SELD activity could then be obtained from the class-wise probabilities Y by applying a binary threshold. Finally , the onset and offset times of the indi vidual sound ev ent classes, and their respectiv e azimuth locations could be obtained from the presence of prediction in consecutiv e time-frames. As the regression approach, we recently proposed a con volu- tional recurrent neural network, SELDnet [5], that was sho wn to perform significantly better than [3]. In terms of acoustic features X , the SELDnet employed the naive phase and magnitude compo- nents of the spectrogram, thereby avoiding any task- or method- specific feature extraction. These features were mapped to two outputs using a joint acoustic model W . As the first output, SED was performed as a multiclass-multilabel classification by estimat- ing the class-wise probabilities Y SED ∈ R T × C as P ( Y SED | X , W ) . The second output, DOA estimation was performed as multiout- put regression task by estimating directly the L dimensional spa- tial location as Y DOA ∈ R T × L × G × C for each of the C classes as f W : X 7→ Y DOA . At each time-frame, G spatial coordinates are estimated per sound class and can be chosen based on the complex- ity of the sound scene and recording array setup capabilities. In [5], one trajectory was estimated per sound class ( G = 1 ), and the re- spectiv e DOA was represented using its 3D Cartesian coordinates along x , y , and z axes ( L = 3 ). The tw o DNN-based approaches for SELD, i.e., classifica- tion [3] and regression approach [5], have their respectiv e advan- tages and restrictions. For instance, the resolution of DOA estima- tion in a classification approach is limited to the fixed set of angles used during training, and the performance on unseen DOA values is unknown. For datasets with a higher number of sound classes and DOA angles, the number of output nodes of the classifier in- creases rapidly . Training such a large multilabel classifier , where the training labels per frame have a fe w positiv es classes represent- ing acti ve sound class and location in comparison to a lar ge number of neg ativ e classes, poses problems of imbalanced dataset train- ing. Additionally , such a lar ge output classifier requires a larger dataset to ha ve sufficient examples for each class. On the other hand, the regression approach performs seamlessly on unseen DO A values, does not face the imbalanced dataset problems, and can learn from smaller datasets. As discussed earlier, algorithmically the two approaches can potentially recognize multiple instances of the same sound class occurring simultaneously , b ut such a sce- nario has ne ver been ev aluated and hence their performances are unknown. Additionally , it was observed that the DOA estimation of the classification approach for seen locations was more accurate than the regression approach. This was concluded to be a result of incomplete learning of the regression mapping function due to the small size of dataset [5]. Data-driv en SELD approaches [3, 5] require suf ficient data with annotation of sound ev ent activities and their spatial location. An- notating such a real-life recording to produce large dataset is a te- dious task. One of the ways to overcome this is to develop meth- ods that can learn to perform real-life SELD from a large synthe- sized dataset and a smaller real-life dataset. The performance of such methods is directly related to the similarity of the synthesized dataset to the real-life sound scene. In [5] we proposed to create such realistic sound scene by conv olving real-life impulse responses with real-life isolated sound ev ents, and summing them with real- life ambient sound. These sound scenes were created to have both isolated, and ov erlapping sound events. The ambient sound was added to the recording at different signal-to-noise ratios (SNRs) to simulate varying real-life conditions. Howe ver , all the impulse re- sponses for the dataset in [5] were collected from a single environ- ment. Learning real-life SELD with such restricted dataset is diffi- cult. One of the approaches to overcome this is to train the methods with larger acoustic variability in the training data. In this regard, for the DCASE 2019 SELD task, we employ impulse responses col- lected from five different en vironments with varying room dimen- sions and reverberant properties. Additionally , in order to support research focused on specific audio formats, we provide an identical dataset in two formats of four-channels each: first-order Ambison- ics and microphone array recordings. T o summarize, we propose the SELD task for the DCASE 2019 challenge to promote SELD research. W e present a challenging multi-room reverberant dataset 2 with varying numbers of overlap- ping sound ev ents, and a fixed ev aluation setup to compare the per- formance of different methods. As the benchmark, we provide a modified version of the recently proposed SELDnet 3 [5] and report the results on the multi-room rev erberant dataset. 2. MUL TI-R OOM REVERBERANT DA T ASET The SELD task in DCASE 2019 provides two datasets, T A U Spa- tial Sound Events 2019 - Ambisonic (FO A) and T A U Spatial Sound Events 2019 - Microphone Array (MIC), of identical sound scenes with the only difference in the format of the audio. The FOA dataset provides four-channel First-Order Ambisonic recordings while the MIC dataset provides four-channel directional microphone record- ings from a tetrahedral array configuration. Both formats are ex- tracted from the same microphone array . The SELD methods can be developed on either one of the two or both the datasets to ex- ploit their mutual information. Both the datasets, consists of a dev elopment and e v aluation set. The de velopment set consists of 400 one-minute long recordings sampled at 48000 Hz, divided into 2 https://doi.org/10.5281/zenodo.2580091 3 https://github .com/sharathadav anne/seld-dcase2019 four cross-validation splits of 100 recordings each. The ev aluation set consists of 100 one-minute long recordings. These recordings were synthesized using spatial room impulse response (IRs) col- lected from five indoor environments, at 504 unique combinations of azimuth-elev ation-distance. In order to synthesize these record- ings the collected IRs were con volv ed with isolated sound events from DCASE 2016 task 2 4 . Additionally , half the number of record- ings have up to two temporally overlapping sound ev ents, and the remaining have no overlapping. Finally , to create a realistic sound scene recording, natural ambient noise collected in the IR record- ing en vironments was added to the synthesized recordings such that the average SNR of the sound events was 30 dB. The only explicit difference between each of the dev elopment dataset splits and e val- uation dataset is the isolated sound ev ent examples employed. 2.1. Real-life Impulse Response Collection The real-life IR recordings were collected using an Eigenmike 5 spherical microphone array . A Genelec G T wo loudspeaker 6 was used to playback a maximum length sequence (MLS) around the Eigenmike. The MLS playback le vel was ensured to be 30 dB greater than the ambient sound level during the recording. The IRs were obtained in the STFT domain using a least-squares regression between the known measurement signal (MLS) and far -field record- ing independently at each frequency . These IRs were collected in the following directions: a) 36 IRs at ev ery 10 ◦ azimuth angle, for 9 elev ations from − 40 ◦ to 40 ◦ at 10 ◦ increments, at 1 m distance from the Eigenmike, resulting in 324 discrete DO As. b) 36 IRs at every 10 ◦ azimuth angle, for 5 elev ations from − 20 ◦ to 20 ◦ at 10 ◦ increments, at 2 m distance from the Eigenmike, resulting in 180 discrete DOAs. The IRs were recorded at fiv e different indoor en vironments inside the T ampere University campus at Hervanta, Finland during non-office hours. These en vironments had varying room dimensions, furniture, flooring and roof materials. Addition- ally , we also collected 30 minutes of ambient noise recordings from these fi ve environments with the IR recording setup unchanged dur- ing office hours thereby obtaining realistic ambient noise. W e refer the readers to the DCASE 2019 challenge webpage for description on individual en vironments. 2.2. Dataset Synthesis The isolated sound events dataset from DCASE 2016 task 2 con- sists of 11 classes, each with 20 examples. These examples were randomly split into five sets with an equal number of examples for each class; the first four sets were used to synthesize the four splits of the dev elopment dataset, while the remaining one set was used for the evaluation dataset. Each of the one-minute recordings were generated by con volving randomly chosen sound event e xamples with a corresponding random IR to spatially position them at a given distance, azimuth and elev ation angles. The IRs chosen for each recording are all from the same environment. Further , these spa- tialized sound events were temporally positioned using randomly chosen start times following the maximum number of overlapping sound ev ents criterion. Finally , ambient noise collected at the re- spectiv e IR en vironment was added to the synthesized recording such that the av erage SNR of the sound ev ents is 30 dB. Since the number of channels in the IRs is equal to the num- ber of microphones in Eigenmike (32), in order to create the MIC 4 http://dcase.community/challenge2016/task-sound-ev ent-detection-in- synthetic-audio 5 https://mhacoustics.com/products#eigenmike 6 https://www .genelec.com/home-speakers/g-series-active-speak ers dataset we select four microphones that hav e a nearly-uniform tetra- hedral co verage of the sphere. Those are the channels 6, 10, 26, and 22 that corresponds to microphone positions ( 45 ◦ , 35 ◦ , 4.2 cm), ( − 45 ◦ , − 35 ◦ , 4.2 cm), ( 135 ◦ , − 35 ◦ , 4.2 cm) and ( − 135 ◦ , 35 ◦ , 4.2 cm). The spherical coordinate system in use is right-handed with the front at ( 0 ◦ , 0 ◦ ), left at ( 90 ◦ , 0 ◦ ) and top at ( 0 ◦ , 90 ◦ ). Finally , the FOA dataset is obtained by con verting the 32-channel micro- phone signals to the first-order Ambisonics format, by means of encoding filters based on anechoic measurements of the Eigenmike array response, generated with the methods detailed in [6]. 2.3. Array Response For model-based localization approaches the array response may be considered known. The following theoretical spatial responses (steering v ectors) modeling the two formats describe the directional response of each channel to a source incident from DO A giv en by azimuth angle φ and ele v ation angle θ . For the FOA format, the array response is given by the real orthonormalized spherical harmonics: H 1 ( φ, θ, f ) = 1 (1) H 2 ( φ, θ, f ) = √ 3 ∗ sin( φ ) ∗ cos( θ ) (2) H 3 ( φ, θ, f ) = √ 3 ∗ sin( θ ) (3) H 4 ( φ, θ, f ) = √ 3 ∗ cos( φ ) ∗ cos( θ ) . (4) For the tetrahedral array of microphones mounted on spherical baffle, similar to Eigenmike, an analytical expression for the direc- tional array response is giv en by the expansion: H m ( φ m , θ m , φ, θ, ω ) = 1 ( ω R/c ) 2 30 X n =0 i n − 1 h 0 (2) n ( ω R/c ) (2 n + 1) P n (cos( γ m )) , (5) where m is the channel number , ( φ m , θ m ) are the specific micro- phone’ s azimuth and elev ation position, ω = 2 π f is the angular fre- quency , R = 0 . 042 m is the array radius, c = 343 m/s is the speed of sound, cos( γ m ) is the cosine angle between the microphone po- sition and the DOA, P n is the unnormalized Legendre polynomial of degree n , and h 0 (2) n is the deri vati ve with respect to the argument of a spherical Hankel function of the second kind. The expansion is limited to 30 terms which provide negligible modeling error up to 20 kHz. Note t hat the Ambisonics format is frequenc y-independent, something that holds true to about 9 kHz for Eigenmike and devi- ates gradually from the ideal response for higher frequencies. 3. B ASELINE METHOD As the benchmark method, we employ the SELDnet [5]. Contrary to [5], where the DO A estimation is performed as multi-output re- gression of the 3D Cartesian DOA vector components x, y, z ∈ [ − 1 , 1] , in this benchmark implementation we directly estimate the azimuth φ ∈ [ − π, π ] and elev ation θ ∈ [ − π / 2 , π / 2] angles. Ac- cordingly , the acti vation function of the DO A estimation layer is changed from tanh to linear . The remaining architecture remains unchanged and is illustrated in Figure 1. The input to the method is a multichannel audio of 48 kHz sampling rate, from which the phase and magnitude components of the spectrogram are extracted using 2048-point discrete Fourier transform from 40 ms length Han- ning window and 20 ms hop length. A sequence of T spectrogram frames ( T = 128) is then fed to the three con volutional layers that TxR Tx2N TxN Q, GRU, tanh, bi-directional Q, GRU, tanh, bi-directional Input audio Feature extractor P, 3x3 filters, 2D CNN, ReLUs 1xMP 1 max pool P, 3x3 filters, 2D CNN, ReLUs 1xMP 2 max pool P, 3x3 filters, 2D CNN, ReLUs 1xMP 3 max pool Tx2xP TxM/2x2C R, fully connected, linear N, fully connected, sigmoid Sound event detection (SED) Multi-label classification task Direction of arrival (DOA) estimation Multi-output regression task TxQ TxR R, fully connected, linear 2N, fully connected, linear T frame t SPEECH CAR DOG TRAIN ... ... -π/2 π/2 SPEECH SPEECH DOG T frame t azi ele -π π Figure 1: Con volutional recurrent neural network for SELD. extract shift-inv ariant features using 64 filters each. Batch normal- ization is used after each con volutional layer . Dimensionality re- duction of the input spectrogram feature is performed using max pooling operation only along the frequency axis. The temporal axis is untouched to keep the resolution of the output unchanged from the input dimension. The temporal structure of the sound ev ents is modeled using two bi-directional recurrent layers with 128 gated recurrent units each. Finally , the output of the recurrent layer is shared between two fully-connected layer branches each producing the SED as multi- class multilabel classification and DOA as multi-output regression; together producing the SELD output. The SED output obtained is the class-wise probabilities for the C classes in the dataset at each of the T frames of input spectrogram sequence, resulting in a dimen- sion of T × C . The localization output estimates one single DOA for each of the C classes at ev ery time-frame T , i.e., if multiple in- stances of the same sound class occur in a time frame the SELDnet localizes either one or oscillates between multiple instances. The ov erall dimension of localization output is T × 2 C , where 2 C rep- resents the class-wise azimuth and elev ation angles. A sound ev ent class is said to be active if its probability in SED output is greater than the threshold of 0.5, otherwise, the sound class is considered to be absent. The presence of sound class in consecutive time-frames giv es the onset and offset times, and the corresponding DO A esti- mates from the localization output giv es the spatial location with respect to time. A cross-entropy loss is employed for detection output, while a mean square error loss on the spherical distance between refer - ence and estimated locations is employed for the localization out- put. The combined con v olutional recurrent neural network archi- tecture is trained using Adam optimizer and a weighted combina- tion of the two output losses. Specifically , the localization output is weighted × 50 more than the detection output. T able 1: Cross-validation setup Splits Folds T raining V alidation T esting Fold 1 3, 4 2 1 Fold 2 4, 1 3 2 Fold 3 1, 2 4 3 Fold 4 2, 3 1 4 4. EV ALU A TION 4.1. Evaluation Setup The dev elopment dataset consists of four cross-validation splits as shown in T able 1. Participants are required to report the perfor- mance of their method on the testing splits of the four folds. The performance metrics are calculated by accumulating the required statistics from all the folds [7], and not as the a verage of the metrics of the individual folds. For the ev aluation dataset, participants are allowed to decide the training procedure, i.e. the amount of training and validation files in the dev elopment dataset and the number of ensemble models. 4.2. Metrics The SELD task is ev aluated with individual metrics for SED and DO A estimation. For SED, we use the F-score and error rate (ER) calculated in one-second segments [8]. For DO A estimation we use two frame-wise metrics [9]: DOA error and frame recall. The DO A error is the av erage angular error in degrees between the predicted and reference DOAs. For a recording of length T time frames, let DOA t R be the list of all reference DO As at time-frame t and DO A t E be the list of all estimated DOAs. The DOA error is now defined as D OA er ror = 1 P T t =1 D t E T X t =1 H ( DOA t R , DO A t E ) , (6) where D t E is the number of DOAs in DO A t E at t -th frame, and H is the Hungarian algorithm for solving assignment prob- lem, i.e., matching the individual estimated DOAs with the re- spectiv e reference DO As. The Hungarian algorithm solves this by estimating the pair-wise costs between individual predicted and reference DO A using the spherical distance between them, σ = arccos(sin φ E sin φ R + cos φ E cos φ R cos( λ R − λ E )) , where the reference DOA is represented by the azimuth angle φ R ∈ [ − π , π ) and elev ation angle λ R ∈ [ − π / 2 , π/ 2] , and the estimated DO A is represented with ( φ E , λ E ) in the similar range as reference DO A. In order to account for time frames where the number of estimated and reference DOAs are unequal, we report a frame T able 2: Evaluation scores for cross-v alidation folds. FO A MIC Fold ER F DE FR ER F DE FR 1 0.25 85.0 30.4 86.6 0.32 81.9 32.0 84.5 2 0.39 77.0 25.9 85.0 0.37 79.0 30.5 83.1 3 0.30 83.1 27.9 86.6 0.29 83.4 30.9 85.4 4 0.42 74.7 30.2 83.3 0.42 76.2 29.8 83.1 recall type metric, which is calculated as, F rame r ecall = P T t =1 1 ( D t R = D t E ) /T , with D t R the number of DO As in DOA t R at t -th frame, 1 () the indicator function returning one if the ( D t R = D t E ) condition is met and zero otherwise. The submit- ted methods will be ranked indi vidually for all four metrics of SED and DOA estimation, and the final positions will be obtained using the cumulativ e minimum of the ranks. 5. RESUL TS The results obtained with the SELDnet for different folds of the de- velopment dataset are presented in T able 2. Although the folds are identical for the FOA and MIC datasets, the SELDnet is observ ed to perform better on fold 1 for FO A and fold 3 for MIC datasets. This suggests that the spectral and spatial information in the two formats are not identical and potentially methods can benefit from mutual information from the two datasets. The overall results with respect to different numbers of overlap- ping sound ev ents and different reverberant environments are pre- sented in T able 3. The general performance of SELDnet on FOA dataset is mar ginally better than MIC dataset. The SELDnet is seen to perform better when there is no polyphony across datasets. Fi- nally , the SELDnet trained with five en vironments is seen to per- form the best in the first en vironment. 6. CONCLUSION In this paper , we proposed the sound e vent localization and de- tection (SELD) task for the DCASE 2019 challenge to promote SELD research. An acoustically challenging multi-room reverber - ant dataset is provided for the task. This dataset is synthesized with isolated sound e vents that are spatially positioned using real- life impulse responses collected from fiv e-different rooms that have different acoustic properties. Additionally , in order to support re- search focused on specific audio-formats, the dataset pro vides four- channel Ambisonic and microphone array recordings of identical sound scenes. Further, the dataset provides a pre-defined four-fold cross-validation split for ev aluating the performance of competing methods. As the baseline results for the dataset, we report the per- formance of a benchmark SELD method based on con volutional recurrent neural network. T able 3: SELDnet performance on overlapping sound e vents and re verberant scenes. ID - identifier, DE - DO A Error, FR - Frame Recall Dev elopment dataset scores Evaluation dataset scores FO A MIC FO A MIC ID ER F DE FR ER F DE FR ER F DE FR ER F DE FR Overlap 1 0.32 82.2 23.1 93.0 0.35 81.2 25.9 92.3 2 0.35 78.6 31.6 77.8 0.35 79.1 33.6 75.8 Impulse response 1 0.30 81.6 28.3 85.3 0.33 80.2 30.4 83.9 2 0.38 78.6 28.5 86.7 0.36 80.2 30.7 86.2 3 0.33 80.0 28.7 84.3 0.35 79.9 30.7 82.5 4 0.37 79.3 28.3 84.9 0.35 80.4 30.3 83.7 5 0.34 80.0 29.0 85.7 0.36 79.5 31.9 83.4 T otal 0.34 79.9 28.5 85.4 0.35 80.0 30.8 84.0 7. REFERENCES [1] T . Butko, F . G. Pla, C. Segura, C. Nadeu, and J. Hernando, “T wo-source acoustic event detection and localization: Online implementation in a smart-room, ” in Eur opean Signal Process- ing Conference , 2011. [2] R. Chakraborty and C. Nadeu, “Sound-model-based acoustic source localization using distributed microphone arrays, ” in IEEE International Confer ence on Acoustics, Speech and Sig- nal Pr ocessing , 2014. [3] T . Hirvonen, “Classification of spatial audio location and con- tent using con volutional neural networks, ” in Audio Engineer- ing Society Convention 138 , 2015. [4] K. Lopatka, J. Kotus, and A. Czyzewsk, “Detection, classifica- tion and localization of acoustic e vents in the presence of back- ground noise for acoustic surveillance of hazardous situations, ” Multimedia T ools and Applications Journal , vol. 75, no. 17, 2016. [5] S. Adav anne, A. Politis, J. Nikunen, and T . V irtanen, “Sound ev ent localization and detection of o verlapping sources using con volutional recurrent neural networks, ” IEEE Journal of Se- lected T opics in Signal Pr ocessing , v ol. 13, no. 1, pp. 34–48, March 2019. [6] A. Politis and H. Gamper , “Comparing modeled and measurement-based spherical harmonic encoding filters for spherical microphone arrays, ” in IEEE W orkshop on Applica- tions of Signal Pr ocessing to Audio and Acoustics (W ASP AA) , 2017, pp. 224–228. [7] G. Forman and M. Scholz, “ Apples-to-apples in cross-validation studies: Pitfalls in classifier perfor- mance measurement, ” SIGKDD Explor . Newsl. , v ol. 12, no. 1, pp. 49–57, Nov ember 2010. [Online]. A vailable: http://doi.acm.org/10.1145/1882471.1882479 [8] A. Mesaros, T . Heittola, and T . V irtanen, “Metrics for poly- phonic sound e vent detection, ” in Applied Sciences , vol. 6, no. 6, 2016. [9] S. Adav anne, A. Politis, and T . V irtanen, “Direction of arriv al estimation for multiple sound sources using conv olutional re- current neural network, ” in European Signal Processing Con- fer ence , 2018.
Original Paper
Loading high-quality paper...
Comments & Academic Discussion
Loading comments...
Leave a Comment