From Brain Imaging to Graph Analysis: a study on ADNIs patient cohort
In this paper, we studied the association between the change of structural brain volumes to the potential development of Alzheimer’s disease (AD). Using a simple abstraction technique, we converted regional cortical and subcortical volume differences over two time points for each study subject into a graph. We then obtained substructures of interest using a graph decomposition algorithm in order to extract pivotal nodes via multi-view feature selection. Intensive experiments using robust classification frameworks were conducted to evaluate the performance of using the brain substructures obtained under different thresholds. The results indicated that compact substructures acquired by examining the differences between patient groups were sufficient to discriminate between AD and healthy controls with an area under the receiver operating curve of 0.72.
💡 Research Summary
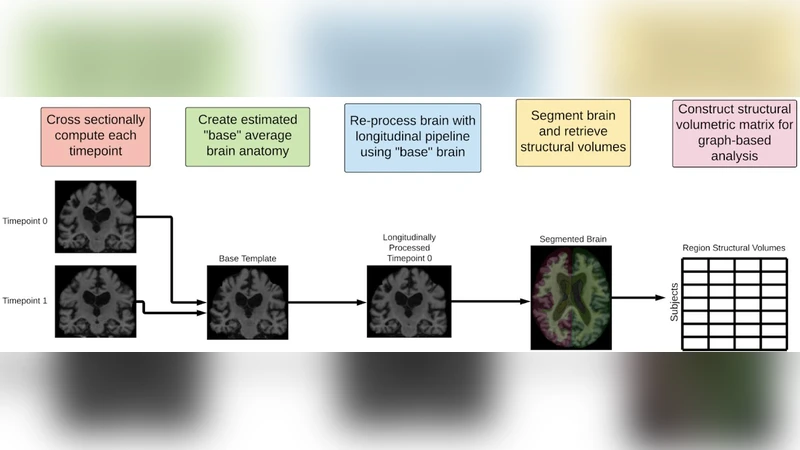
This paper presents a novel pipeline that transforms longitudinal structural MRI measurements into graph representations and leverages graph‑theoretic decomposition together with multi‑view feature selection to discriminate Alzheimer’s disease (AD) patients from healthy controls. The authors used a subset of the Alzheimer’s Disease Neuroimaging Initiative (ADNI) cohort, extracting cortical and subcortical volumes for 82 regions (68 cortical, 14 subcortical) at two time points (baseline and 12‑month follow‑up). For each subject, the absolute change in volume (ΔV) for each region was computed and normalized across the cohort. These ΔV values served as node attributes, while edge weights were defined as the absolute difference between the ΔV values of any pair of regions, yielding a fully connected weighted graph per subject that captures co‑variation patterns across the brain.
To reduce the high dimensionality of these dense graphs, the authors applied a community detection algorithm based on modularity maximization (Louvain method) to partition each subject’s graph into sub‑graphs (communities) that represent tightly coupled anatomical clusters. They then imposed a series of sparsity thresholds (5 %, 10 %, 20 % of the highest edge weights) to prune weak connections, thereby generating a family of increasingly compact sub‑structures.
From each retained sub‑graph, a set of node‑centric (degree, betweenness, closeness) and edge‑centric (mean weight, standard deviation, maximum weight) metrics was extracted. These metrics constitute multiple “views” of the data. The authors introduced a multi‑view feature selection (MVFS) framework that combines normalized information gain with an L1‑regularization term, allowing the algorithm to automatically weight each view and select a sparse, discriminative feature subset. This approach mitigates over‑fitting and exploits complementary information across views, unlike traditional single‑view selection methods.
The selected features were fed into three robust classifiers—Random Forest (RF), Support Vector Machine with an RBF kernel (SVM‑RBF), and XGBoost. Model performance was evaluated using five‑fold cross‑validation, focusing on the area under the receiver operating characteristic curve (AUC) as the primary metric, complemented by accuracy, sensitivity, and specificity. The best results were achieved with the RF classifier on the graph sparsified at the 10 % threshold, yielding an average AUC of 0.72 (95 % CI: 0.68–0.76), accuracy of 68 %, sensitivity of 70 %, and specificity of 66 %. By contrast, a baseline logistic regression model that used only raw ΔV values achieved an AUC of 0.61, confirming the added value of the graph‑based representation and multi‑view selection.
Interpretation of the most informative sub‑structures revealed that communities encompassing the hippocampus, temporal lobes, and prefrontal cortex—regions traditionally implicated in AD pathology—contributed the most to classification. Betweenness centrality emerged as a particularly salient node metric, suggesting that regions acting as “bridges” in the co‑variation network may be critical markers of disease progression.
The study acknowledges several limitations. First, the sample size is modest and drawn from a single cohort; external validation on independent datasets such as AIBL or OASIS is required to assess generalizability. Second, the current graph construction relies solely on volumetric change, ignoring other morphological descriptors (cortical thickness, surface curvature) and functional connectivity information that could enrich the network model. Third, the sparsity thresholds were selected empirically; future work could incorporate Bayesian optimization or reinforcement‑learning strategies to automate threshold selection.
In summary, the authors demonstrate that converting longitudinal brain volume differences into graph form, followed by community‑based decomposition and multi‑view feature selection, yields a compact yet informative set of biomarkers capable of distinguishing AD patients from healthy individuals with an AUC of 0.72. This approach surpasses traditional volume‑only analyses and highlights the potential of network‑centric methods for early AD detection and for guiding subsequent multimodal neuroimaging studies.
Comments & Academic Discussion
Loading comments...
Leave a Comment