Object Recognition under Multifarious Conditions: A Reliability Analysis and A Feature Similarity-based Performance Estimation
In this paper, we investigate the reliability of online recognition platforms, Amazon Rekognition and Microsoft Azure, with respect to changes in background, acquisition device, and object orientation. We focus on platforms that are commonly used by …
Authors: Dogancan Temel, Jinsol Lee, Ghassan AlRegib
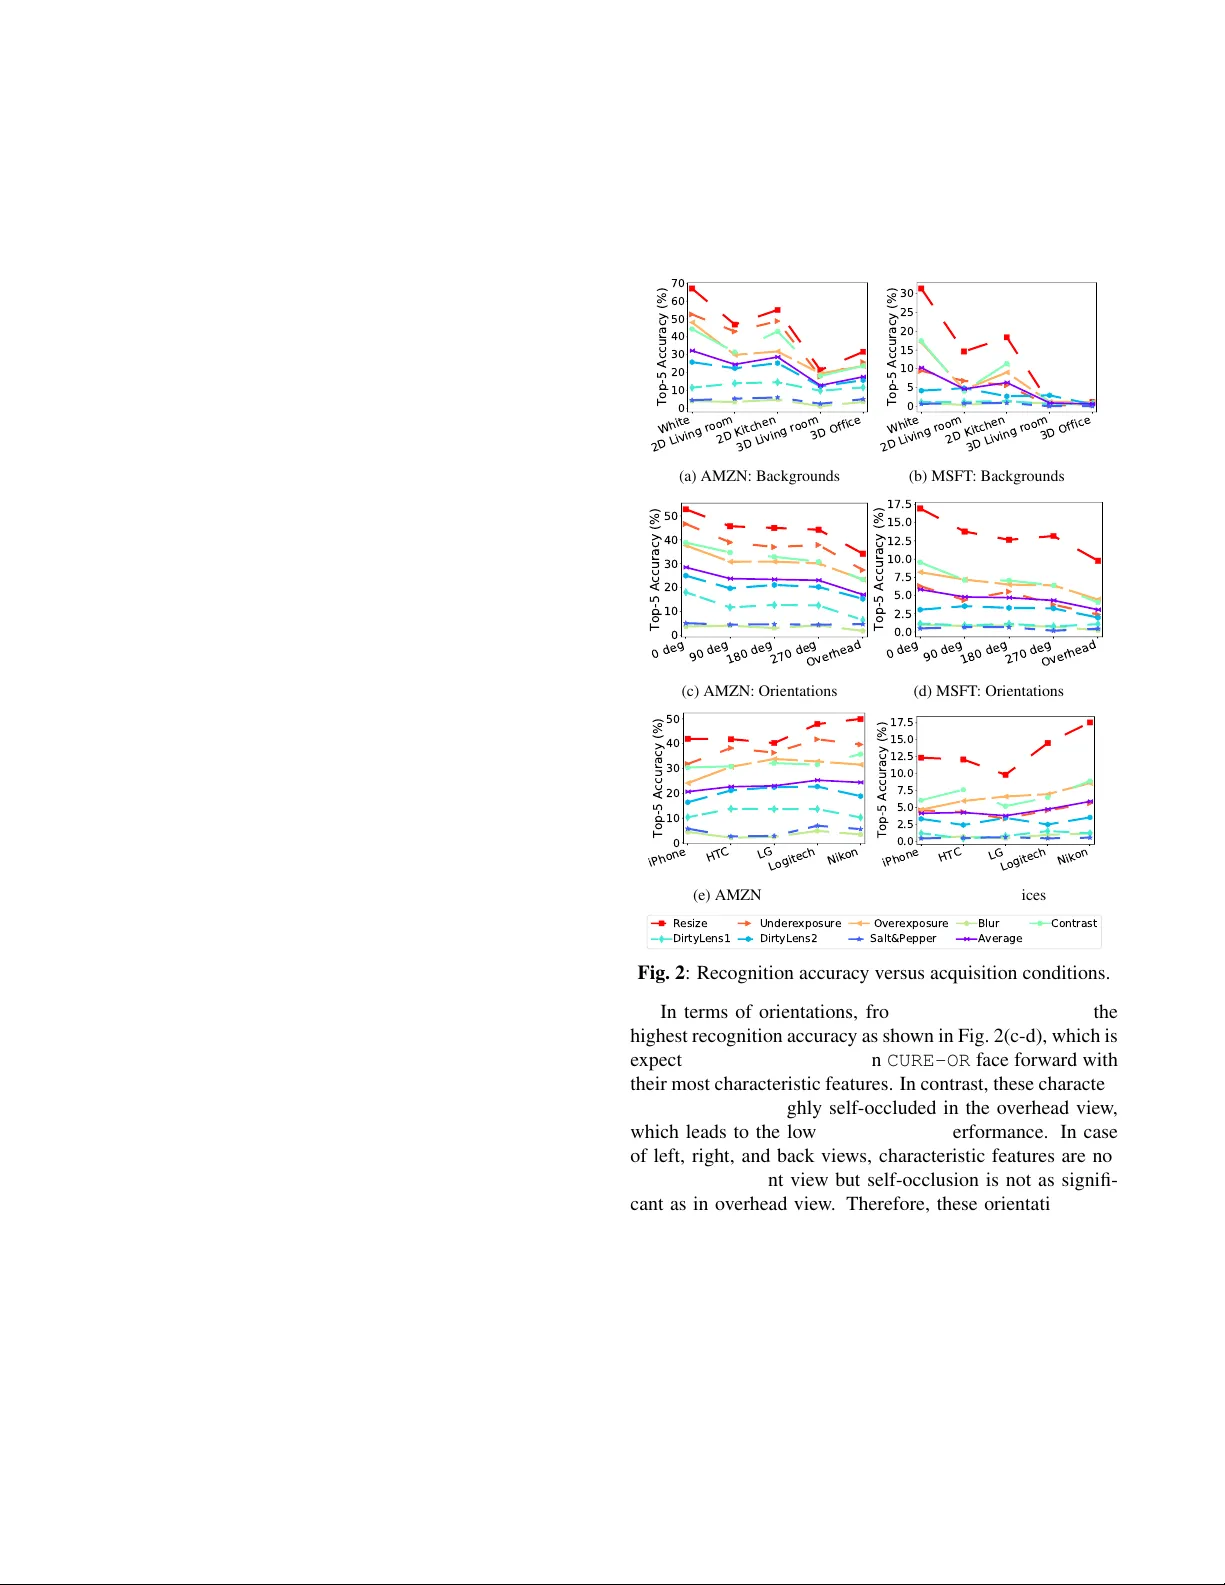
Citation D. T emel, J. Lee and G. AlRegib, ”Object Recognition Under Multifarious Conditions: A Reliability Analysis and A Feature Similarity-Based Performance Estimation, ” IEEE International Conference on Image Processing (ICIP), T aipei, T aiw an, 2019. Dataset https://ghassanalregib.com/cure- or/ Bib @INPR OCEEDINGS { T emel2019 ICIP , author= { D. T emel and J. Lee and G. AIRegib } , booktitle= { IEEE International Conference on Image Processing (ICIP) } , title= { Object Recognition Under Multifarious Conditions: A Reliability Analysis and A Feature Similarity- Based Performance Estimation } , year= { 2019 } , } Copyright c 2019 IEEE. Personal use of this material is permitted. Permission from IEEE must be obtained for all other uses, in any current or future media, including reprinting/republishing this material for advertising or promotional purposes, creating new collectiv e works, for resale or redistribution to servers or lists, or reuse of any copyrighted component of this w ork in other works. Contact alregib@gatech.edu https://ghassanalregib.com/ dcantemel@gmail.com http://cantemel.com/ OBJECT RECOGNITION UNDER MUL TIF ARIOUS CONDITIONS: A RELIABILITY ANAL YSIS AND A FEA TURE SIMILARITY -BASED PERFORMANCE ESTIMA TION Dogancan T emel* , Jinsol Lee* , and Ghassan AlRe gib Center for Signal and Information Processing, School of Electrical and Computer Engineering, Georgia Institute of T echnology , Atlanta, GA, 30332-0250 { cantemel, jinsol.lee, alregib } @gatech.edu ABSTRA CT In this paper , we in vestigate the reliability of online recogni- tion platforms, Amazon Rekognition and Microsoft Azure, with respect to changes in background, acquisition device, and object orientation. W e focus on platforms that are com- monly used by the public to better understand their real-world performances. T o assess the variation in recognition perfor- mance, we perform a controlled experiment by changing the acquisition conditions one at a time. W e use three smart- phones, one DSLR, and one webcam to capture side views and o verhead vie ws of objects in a living room, an of fice, and photo studio setups. Moreover , we introduce a frame work to estimate the recognition performance with respect to back- grounds and orientations. In this frame work, we utilize both handcrafted features based on color, texture, and shape char - acteristics and data-driven features obtained from deep neu- ral networks. Experimental results show that deep learning- based image representations can estimate the recognition per - formance variation with a Spearman’ s rank-order correlation of 0.94 under multifarious acquisition conditions. Index T erms — object dataset, controlled experiment with recognition platforms, performance estimation, deep learning, feature similarity 1. INTR ODUCTION In recent years, the performance of visual recognition and detection algorithms have considerably advanced with the progression of data-driven approaches and computational capabilities [1, 2]. These advancements enabled state-of-the- art methods to achiev e human-le vel performance in specific recognition tasks [3, 4]. Despite these significant achiev e- ments, it remains a challenge to utilize such technologies in real-world environments that diver ge from training con- ditions. T o identify the factors that can affect recognition performance, we need to perform controlled experiments as in [5 – 9]. Even though these studies shed a light on the vul- nerability of existing recognition approaches, in vestigated *Equal contribution. Dataset: https://ghassanalregib.com/cure- or/ conditions are either limited or unrealistic. Recently , we in- troduced the CURE-OR dataset and analyzed the recognition performance with respect to simulated challenging conditions [10]. Hendrycks and Dietterich [11] also studied the ef fect of similar conditions by postprocessing the images in ImageNet [1]. In [12–15], performance variation under simulated chal- lenging conditions were analyzed for traffic sign recognition and detection. Aforementioned studies overlook ed the ac- quisition conditions and in vestigated the effect of simulated conditions. In contrast to the literatur e [5 – 9, 11–13, 15] and our pr evious work [10], the main focus of this study is to analyze the effect of real-world acquisition conditions in- cluding device type, orientation and backgr ound. In Fig. 1, we show sample images obtained under dif ferent acquisition conditions. (a) White (b) 2D Living Room (c) 2D Kitchen (d) 3D Living Room (e) 3D Office (f) 0 ◦ (Front) (g) 90 ◦ (h) 180 ◦ (i) 270 ◦ (j) Overhead Fig. 1 : Object backgrounds and orientations in CURE-OR . If we consider ideal acquisition conditions as reference conditions that lead to the highest recognition rate, any vari- ation would decrease the recognition performance and affect visual representations. Based on this assumption, we hypothe- size that reco gnition performance variations can be estimated by variations in visual r epr esentations. Overall, the contribu- tions of this manuscript are fiv e folds. First, we in v estigate the effect of backgr ound on object recognition by perform- ing controlled experiments with different backgrounds. Sec- ond, we analyze the effect of acquisition devices by compar- ing the recognition accuracy of images captured with differ - ent devices. Third, we analyze the recognition performance with respect to different orientation configurations. Fourth, we introduce a framework to estimate the recognition per- formance variation under varying backgrounds and orienta- tions. Fifth, we benchmark the performance of handcrafted and data-driven features obtained from deep neural networks in the proposed framew ork. The outline of this paper is as fol- lows. In Section 2, we analyze the objectiv e recognition per- formance with respect to acquisition conditions. In Section 3, we describe the recognition performance estimation frame- work and benchmark hand-crafted and data-driven methods. Finally , we conclude our work in Section 4. 2. RECOGNITION UNDER MUL TIF ARIOUS CONDITIONS Based on scalability , user-friendliness, computation time, service fees, access to labels and confidence scores, we assessed off-the-shelf platforms and decided to utilize Mi- crosoft Azure Computer V ision (MSFT) and Amazon Rek og- nition (AMZN) platforms. As a test set, we use the recently introduced CURE-OR dataset that includes one million im- ages of 100 objects captured with different devices under various object orientations, backgrounds, and simulated chal- lenging conditions. Objects are classified into 6 categories: toys, personnel belongings, office supplies, household items, sport/entertainment items, and health/personal care items as described in [10]. W e identified 4 objects per category for each platform for testing, but because Azure only identified 3 objects correctly in one category , we excluded an object with the lowest number of correctly identified images from Amazon for fair comparison. Therefore, we used 23 objects while assessing the robustness of the recognition platforms. Original images (challenge-free) in each category were pro- cessed to simulate realistic challenging conditions including underexposure, overe xposure, blur, contrast, dirty lens, salt and pepper noise, and resizing as illustrated in [10]. W e calculated the top-5 accuracy for each challenge category to quantify recognition performance. Specifically , we calculated the ratio of correct classifications for each object in which ground truth label was among the highest fi ve predictions. W e report the recognition performance of online plat- forms with respect to varying acquisition conditions in Fig. 2. Each line represents a challenge type, except the purple line that shows the av erage of all challenge types. In terms of object backgrounds, white background leads to the highest recognition accuracy in both platforms as shown in Fig. 2(a- b), which is followed by 2D textured backgrounds of kitchen and living room, and then by 3D backgrounds of office and living room. Objects are recognized more accurately in front of the white backdrop because there is not any texture or color variation in the background that can resemble other objects. The most challenging scenarios correspond to the real-world office and li ving room because of complex background struc- ture. Recognition accuracy in front of 2D backdrops is higher than the real-world setups because foreground objects are more distinct when background is out of focus. White 2D Living room 2D Kitchen 3D Living room 3D Office 0 10 20 30 40 50 60 70 Top-5 Accuracy (%) (a) AMZN: Backgrounds White 2D Living room 2D Kitchen 3D Living room 3D Office 0 5 10 15 20 25 30 Top-5 Accuracy (%) (b) MSFT : Backgrounds 0 deg 90 deg 180 deg 270 deg Overhead 0 10 20 30 40 50 Top-5 Accuracy (%) (c) AMZN: Orientations 0 deg 90 deg 180 deg 270 deg Overhead 0.0 2.5 5.0 7.5 10.0 12.5 15.0 17.5 Top-5 Accuracy (%) (d) MSFT : Orientations iPhone HTC LG Logitech Nikon 0 10 20 30 40 50 Top-5 Accuracy (%) (e) AMZN: Devices iPhone HTC LG Logitech Nikon 0.0 2.5 5.0 7.5 10.0 12.5 15.0 17.5 Top-5 Accuracy (%) (f) MSFT : De vices Resize DirtyLens1 Underexposure DirtyLens2 Overexposure Salt&Pepper Blur Average Contrast Fig. 2 : Recognition accuracy versus acquisition conditions. In terms of orientations, front view (0 deg) leads to the highest recognition accurac y as sho wn in Fig. 2(c-d), which is expected because the objects in CURE-OR face forward with their most characteristic features. In contrast, these character - istic features are highly self-occluded in the ov erhead view , which leads to the lowest recognition performance. In case of left, right, and back views, characteristic features are not as clear as in front vie w but self-occlusion is not as signifi- cant as in overhead view . Therefore, these orientations lead to a medium recognition performance compared to front and ov erhead views. Recognition performances with respect to acquisition devices are reported in Fig. 2(e-f), which shows that performance variation based on de vice types is less sig- nificant than backgrounds and orientations. Howe ver , there is still a performance difference between images obtained from different devices. Overall, Nikon D80 and Logitech C920 lead to highest recognition performance in both platforms, which highlights the importance of image quality for recog- nition applications. T able 1 : Recognition accuracy estimation performance of image feature distances in terms of Spearman correlation. Condition Featur e T ype Featur e Distance Metric l 1 l 2 l 2 2 SAD SSAD Canberra Chebyshev Minko wski Bray-Curtis Cosine Amazon Rekognition (AMZN) Background Hand- crafted Color 0.14 0.30 0.29 0.10 0.29 0.88 0.01 0.30 0.14 0.20 Daisy 0.31 0.27 0.26 0.07 0.26 0.31 0.40 0.27 0.31 0.27 Edge 0.18 0.08 0.12 0.19 0.07 0.66 0.04 0.08 0.45 0.17 Gabor 0.77 0.76 0.76 0.35 0.76 0.58 0.71 0.76 0.77 0.71 HOG 0.13 0.17 0.16 0.08 0.16 0.01 0.12 0.17 0.13 0.13 Data- driven VGG11 0.85 0.85 0.85 0.10 0.85 0.93 0.84 0.85 0.85 0.85 VGG13 0.85 0.85 0.83 0.01 0.83 0.92 0.69 0.85 0.85 0.86 VGG16 0.88 0.84 0.84 0.08 0.84 0.94 0.79 0.84 0.88 0.85 Orientation Hand- crafted Color 0.28 0.41 0.41 0.54 0.41 0.04 0.48 0.41 0.28 0.16 Daisy 0.45 0.28 0.17 0.03 0.17 0.45 0.08 0.28 0.45 0.21 Edge 0.71 0.66 0.69 0.19 0.63 0.67 0.65 0.66 0.65 0.45 Gabor 0.05 0.06 0.09 0.39 0.09 0.24 0.02 0.06 0.05 0.06 HOG 0.19 0.16 0.19 0.51 0.19 0.30 0.09 0.16 0.19 0.15 Data- driven VGG11 0.86 0.92 0.91 0.34 0.91 0.69 0.94 0.92 0.86 0.89 VGG13 0.91 0.90 0.84 0.01 0.84 0.65 0.78 0.90 0.91 0.88 VGG16 0.88 0.92 0.84 0.48 0.84 0.72 0.87 0.92 0.88 0.87 Microsoft Azure (MSFT) Background Hand- crafted Color 0.12 0.13 0.13 0.14 0.13 0.91 0.02 0.13 0.12 0.21 Daisy 0.14 0.18 0.17 0.01 0.17 0.14 0.34 0.18 0.14 0.18 Edge 0.20 0.10 0.11 0.27 0.08 0.55 0.08 0.10 0.39 0.14 Gabor 0.85 0.84 0.84 0.29 0.84 0.59 0.80 0.84 0.85 0.82 HOG 0.30 0.32 0.31 0.17 0.31 0.11 0.18 0.32 0.30 0.10 Data- driven VGG11 0.94 0.94 0.94 0.13 0.94 0.83 0.90 0.94 0.94 0.93 VGG13 0.93 0.92 0.91 0.03 0.91 0.86 0.62 0.92 0.93 0.93 VGG16 0.91 0.93 0.93 0.15 0.93 0.87 0.89 0.93 0.91 0.93 Orientation Hand- crafted Color 0.28 0.45 0.47 0.02 0.47 0.04 0.46 0.45 0.28 0.27 Daisy 0.48 0.43 0.34 0.24 0.34 0.48 0.32 0.43 0.48 0.38 Edge 0.54 0.50 0.51 0.15 0.53 0.45 0.47 0.50 0.35 0.15 Gabor 0.25 0.21 0.18 0.24 0.18 0.10 0.23 0.21 0.25 0.37 HOG 0.11 0.06 0.11 0.36 0.11 0.22 0.13 0.06 0.11 0.38 Data- driven VGG11 0.38 0.46 0.50 0.03 0.50 0.34 0.42 0.46 0.38 0.43 VGG13 0.52 0.48 0.47 0.15 0.47 0.44 0.43 0.48 0.52 0.51 VGG16 0.43 0.46 0.48 0.71 0.48 0.46 0.53 0.46 0.43 0.44 3 × 1 0 3 6 × 1 0 3 log(1 / distance) 20 40 60 80 Top-5 Accuracy(%) White 2D1 2D2 3D1 3D2 (a) AMZN Background - VGG16 Canberra 1 0 3 1 0 2 log(1 / distance) 20 40 60 80 Top-5 Accuracy(%) White 2D1 2D2 3D1 3D2 (b) AMZN Background - Color Canberra 5 × 1 0 1 7 × 1 0 1 log(1 / distance) 50 60 70 80 Top-5 Accuracy(%) Front Side Top (c) AMZN Orientation - VGG11 Chebyshe v 1 0 1 3 × 1 0 1 log(1 / distance) 50 60 70 80 Top-5 Accuracy(%) Front Side Top (d) AMZN Orientation - Edge l1 1 0 1 3 × 1 0 1 log(1 / distance) 0 10 20 30 40 50 Top-5 Accuracy(%) White 2D1 2D2 3D1 3D2 (e) MSFT Background - VGG11 Minko wski 1 0 3 1 0 2 log(1 / distance) 0 10 20 30 40 50 Top-5 Accuracy(%) White 2D1 2D2 3D1 3D2 (f) MSFT Background - Color Canberra 2 × 1 0 7 4 × 1 0 7 log(1 / distance) 10 20 30 40 Top-5 Accuracy(%) Front Side Top (g) MSFT Orientation - VGG16 SAD 1 0 1 3 × 1 0 1 log(1 / distance) 10 20 30 40 Top-5 Accuracy(%) Front Side Top (h) MSFT Orientation - Edge l1 Fig. 3 : Scatter plots of top hand-crafted and data-driv en recognition accuracy estimation methods. 3. RECOGNITION PERFORMANCE ESTIMA TION UNDER MUL TIF ARIOUS CONDITIONS Based on the experiments reported in Section 2, the refer- ence configuration that leads to the highest recognition per- formance is front view , white background, and Nikon DSLR. W e conducted two experiments to estimate the recognition performance with respect to changes in background and ori- entation. W e utilized the 10 common objects of both plat- forms for direct comparison. In the backgr ound e xperiment , we grouped images captured with a particular device (5) in front of a specific background (5), which leads to 25 image groups with front and side vie ws of the objects. In the orien- tation experiment , we grouped images captured with a partic- ular device (5) from an orientation (3) among front, top, and side views, which leads to 15 image groups with images of the objects in front of white, living room, and kitchen back- drops. For each image group, we obtained an av erage recog- nition performance per recognition platform and an av erage feature distance between the images in the group and their ref- erence image. Finally , we analyzed the relationship between recognition accuracy and feature distance with correlations and scatter plots. W e extracted commonly used handcrafted and data-driv en features as follo ws: p Color: Histograms of color channels in RGB. p Daisy: Local image descriptor based on con volutions of gradients in specific directions with Gaussian filters [16]. p Edge: Histogram of vertical, horizontal, diagonal, and non-directional edges. p Gabor: Frequency and orientation information of im- ages extracted through Gabor filters. p HOG: Histogram of oriented gradients ov er local re gions. p VGG: Features obtained from con v olutional neural net- works that are based on stacked 3 × 3 conv olutional layers [17]. The VGG index indicates the number of weighted layers in which last three layers are fully connected layers. W e calculated the distance between features with l 1 norm, l 2 norm, l 2 2 norm, sum of absolute dif ferences (SAD), sum of squared absolute differences (SSAD), weighted l 1 norm (Canberra), l ∞ norm (Chebyshev), Minko wski distance, Bray-Curtis dissimilarity , and Cosine distance. W e report the recognition accuracy estimation performance in T able 1 in terms of Spearman correlation between top-5 recognition accuracy scores and feature distances. W e highlight the top data-driv en and hand-crafted methods with light blue for each recognition platform and experiment. In the backgr ound experiment , color characteristics of different backgrounds are distinct from each other as ob- served in Fig. 1. In terms of low lev el characteristic features including Daisy , Edge , and HOG , edges in the backgrounds can distinguish highly textured backgrounds from less tex- tured backgrounds. Howe ver , edges would not be sufficient to distinguish lowly textured backgrounds from each other . Moreov er , edges of the foreground objects can dominate the feature representations and mask the effect of changes in the backgrounds. T o distinguish dif ferences in backgrounds ov erlooked by edge characteristics, frequency and orienta- tion characteristics can be considered with Gabor features. Data-driv en methods including VGG utilize all three channels of images while extracting features, which can giv e them an inherent advantage with respect to solely color or structure based methods. Overall, data-driv en method VGG leads to the highest performance in the backgr ound experiment for both recognition platforms. In terms of hand-crafted features, color leads to the highest performance follo wed by Gabor whereas edge-based methods result in inferior performance. Distinguishing changes in orientation is more challenging compared to backgrounds because region of interest is lim- ited to a smaller area. Therefore, overall recognition accu- racy estimation performances are lo wer for orientations com- pared to backgrounds as reported in T able 1. Similar to the backgr ound experiment , VGG architectures lead to the highest performance estimation in the orientation experiment . How- ev er , hand-crafted methods are dominated by edge features instead of Gabor representations. W e show the scatter plots of top performing data-driven and hand-crafted methods in Fig. 3 in which x-axis corresponds to average distance be- tween image features and y-axis corresponds to top-5 accu- racy . Image groups corresponding to different configurations are more distinctly clustered in terms of background as ob- served in Fig. 3(a-b, e-f). In terms of orientation, VGG leads to a clear distinction of configurations for Amazon Rekognition as observed in Fig. 3(c) whereas image groups are ov erlap- ping in other e xperiments as sho wn in Fig. 3(d, g-h). Cluster - ing configurations is more challenging in the orientation ex- periment because it is not even possible to easily separate ori- entation configurations based on their recognition accuracy . 4. CONCLUSION In this paper , we analyzed the robustness of recognition plat- forms and reported that object background can affect recog- nition performance as much as orientation whereas tested device types hav e minor influence on recognition. W e also introduced a framew ork to estimate recognition performance variation and showed that color-based features capture back- ground variations, edge-based features capture orientation variations, and data-dri ven features capture both background and orientation variations in a controlled setting. Overall, recognition performance can significantly change depending on the acquisition conditions, which highlights the need for more robust platforms that we can confide in our daily lives. Estimating recognition performance with feature similarity- based metrics can be helpful to test the robustness of algo- rithms before deployment. Howe ver , the applicability of such estimation frameworks can drastically increase if we design no-reference approaches that can provide a recognition per- formance estimation without a reference image similar to the no-reference algorithms in image quality assessment field. 5. REFERENCES [1] J. Deng, W . Dong, R. Socher , L. J. Li, Kai Li, and Li Fei-Fei, “ImageNet: A large-scale hierarchical im- age database, ” in IEEE Confer ence on Computer V ision and P attern Recognition (CVPR) , June 2009, pp. 248– 255. [2] T .-Y . Lin, M. Maire, S. Belongie, J. Hays, P . Perona, D. Ramanan, P . Doll ´ ar , and C. L. Zitnick, “Microsoft COCO: Common objects in context, ” in Eur opean Con- fer ence on Computer V ision (ECCV) , D. Fleet, T . Pa- jdla, B. Schiele, and T . T uytelaars, Eds., Cham, 2014, pp. 740–755, Springer International Publishing. [3] K. He, X. Zhang, S. Ren, and J. Sun, “Delving deep into rectifiers: Surpassing human-level performance on imagenet classification, ” in IEEE International Con- fer ence on Computer V ision (ICCV) , W ashington, DC, USA, 2015, pp. 1026–1034, IEEE Computer Society . [4] R. W u, S. Y an, Y . Shan, Q. Dang, and G. Sun, “Deep Image: Scaling up Image Recognition, ” in arXiv:1501.02876 , 2015. [5] S. Dodge and L. Karam, “Understanding how im- age quality affects deep neural networks, ” in Interna- tional Confer ence on Quality of Multimedia Experience (QoMEX) , June 2016, pp. 1–6. [6] Y . Zhou, S. Song, and N. Cheung, “On classification of distorted images with deep conv olutional neural net- works, ” in IEEE International Confer ence on Acoustics, Speech and Signal Processing (ICASSP) , March 2017, pp. 1213–1217. [7] H. Hosseini, B. Xiao, and R. Poovendran, “Google’ s cloud vision api is not robust to noise, ” in 16th IEEE International Confer ence on Machine Learning and Ap- plications (ICMLA) , Dec 2017, pp. 101–105. [8] J. Lu, H. Sibai, E. Fabry , and D Forsyth, “No need to worry about adversarial examples in object detection in autonomous vehicles, ” in IEEE Confer ence on Com- puter V ision and P attern Recognition (CVPR) W ork- shop , 2017. [9] N. Das, M. Shanbhogue, S.-T . Chen, F . Hohman, S. Li, L. Chen, M. E. Kouna vis, and D. H. Chau, “SHIELD: Fast, practical defense and vaccination for deep learn- ing using jpeg compression, ” in ACM SIGKDD Inter- national Confer ence on Knowledge Discovery & Data Mining (KDD) , Ne w Y ork, NY , USA, 2018, KDD ’18, pp. 196–204, A CM. [10] D. T emel, J. Lee, and G. AlRegib, “CURE-OR: Challenging Unreal and Real Environments for Object Recognition, ” in IEEE International Confer ence on Ma- chine Learning and Applications (ICMLA) , 2018. [11] D. Hendrycks and T . G. Dietterich, “Benchmarking Neural Network Robustness to Common Corruptions and Surface V ariations, ” in International Confer ence on Learning Repr esentations (ICLR) , 2019. [12] D. T emel, G. Kwon, M. Prabhushankar , and G. AlRegib, “CURE-TSR: Challenging Unreal and Real Environ- ments for T raffic Sign Recognition, ” in Neural Informa- tion Pr ocessing Systems (NeurIPS), Machine Learning for Intelligent T ransportation Systems W orkshop , 2017. [13] D. T emel and G. AlRegib, “T raf fic signs in the wild: Highlights from the ieee video and image processing cup 2017 student competition [SP competitions], ” IEEE Sig. Pr oc. Mag. , vol. 35, no. 2, pp. 154–161, March 2018. [14] M. Prabhushankar , G. Kwon, D. T emel, and G. AIRegib, “Semantically interpretable and con- trollable filter sets, ” in IEEE International Conference on Image Pr ocessing (ICIP) , Oct 2018, pp. 1053–1057. [15] D. T emel, T . Alshawi, M-H. Chen, and G. AlRegib, “Challenging en vironments for traffic sign detection: Reliability assessment under inclement conditions, ” arXiv:1902.06857 , 2019. [16] E. T ola, V . Lepetit, and P . Fua, “Daisy: An efficient dense descriptor applied to wide-baseline stereo, ” IEEE T ransactions on P attern Analysis and Machine Intelli- gence (P AMI) , vol. 32, no. 5, pp. 815–830, May 2010. [17] K. Simonyan and A. Zisserman, “V ery deep con volu- tional networks for large-scale image recognition, ” in arXiv:1409.1556 , 2014.
Original Paper
Loading high-quality paper...
Comments & Academic Discussion
Loading comments...
Leave a Comment