Analysis of Daily Streamflow Complexity by Kolmogorov Measures and Lyapunov Exponent
Analysis of daily streamflow variability in space and time is important for water resources planning, development, and management. The natural variability of streamflow is being complicated by anthropogenic influences and climate change, which may introduce additional complexity into the phenomenological records. To address this question for daily discharge data recorded during the period 1989-2016 at twelve gauging stations on Brazos River in Texas (USA), we use a set of novel quantitative tools: Kolmogorov complexity (KC) with its derivative associated measures to assess complexity, and Lyapunov time (LT) to assess predictability. We find that all daily discharge series exhibit long memory with an increasing downflow tendency, while the randomness of the series at individual sites cannot be definitively concluded. All Kolmogorov complexity measures have relatively small values with the exception of the USGS (United States Geological Survey) 08088610 station at Graford, Texas, which exhibits the highest values of these complexity measures. This finding may be attributed to the elevated effect of human activities at Graford, and proportionally lesser effect at other stations. In addition, complexity tends to decrease downflow, meaning that larger catchments are generally less influenced by anthropogenic activity. The correction on randomness of Lyapunov time (quantifying predictability) is found to be inversely proportional to the Kolmogorov complexity, which strengthens our conclusion regarding the effect of anthropogenic activities, considering that KC and LT are distinct measures, based on rather different techniques.
💡 Research Summary
The paper investigates the complexity and predictability of daily streamflow records from twelve USGS gauging stations on the Brazos River, Texas, covering the period 1989‑2016. Recognizing that traditional linear statistics are insufficient to capture the combined effects of natural variability, anthropogenic interventions (e.g., dams, water withdrawals) and climate change, the authors employ two fundamentally different tools from nonlinear dynamics: Kolmogorov complexity (KC) and the Lyapunov exponent (LE).
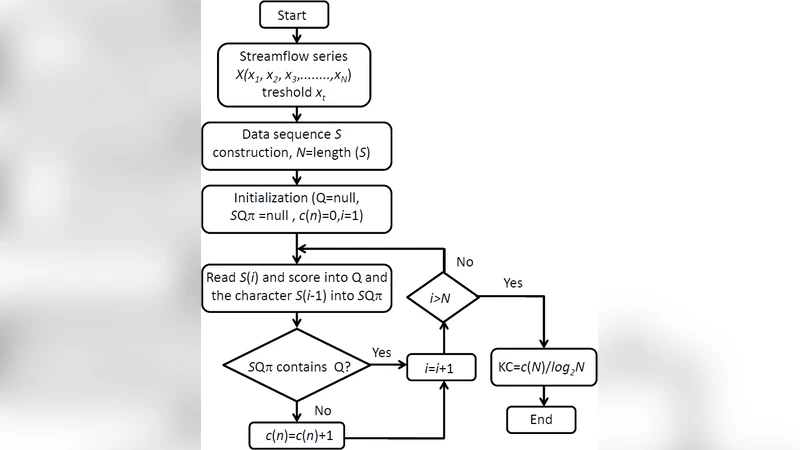
KC is estimated using the Lempel‑Ziv algorithm (LZA). The raw discharge series are first binarised (0/1) based on a threshold (typically the series mean) and then compressed; the length of the compressed binary string provides a normalized information‑theoretic measure of randomness. Because plain KC cannot distinguish amplitude variations from coding artefacts, the authors derive four auxiliary metrics: (i) the KC spectrum, obtained by repeatedly binarising the series with 500 different thresholds, (ii) the maximum value of this spectrum (KCM), (iii) the mean of the spectrum (MKC), and (iv) a running KC (RKC) computed over a moving three‑year window (1095 days). These extensions allow the authors to explore scale‑dependent complexity and to capture local temporal changes that a single KC value would miss.
LE is calculated with the Rosenstein algorithm. After reconstructing the phase space (optimal embedding dimension and delay selected via false‑nearest‑neighbors and mutual information), the algorithm tracks the average divergence of nearest‑neighbour trajectories and extracts the largest exponent. Positive LE indicates exponential separation of initially close states, i.e., deterministic chaos. The inverse of LE, the Lyapunov time (LT), quantifies the horizon over which accurate forecasts are feasible; shorter LT implies lower predictability.
The data set comprises daily discharge values for 28 years (≈10 220 observations) from the twelve stations. Basic statistics (mean, median, min, max, inter‑quartile range) are reported, followed by the computed KC‑related metrics, LE, and LT for each site. The main findings are:
- All series exhibit long‑memory behaviour, consistent with persistent autocorrelation (similar to a Hurst exponent >0.5).
- KC values are generally low, indicating modest randomness, but the Graford station (USGS 08088610) shows markedly higher KCM and MKC. This station lies downstream of the Moris Shepard hydro‑electric plant and intensive water‑withdrawal infrastructure, suggesting that human regulation injects additional algorithmic complexity.
- A clear downstream trend emerges: average KC, KCM, and MKC decrease with increasing catchment size, implying that larger basins dilute anthropogenic signals.
- LE is positive for all stations, confirming the presence of deterministic chaos in the discharge dynamics. Graford again stands out with the largest LE and the shortest LT, reinforcing the notion that anthropogenic forcing not only raises complexity but also shortens the predictability window.
- KC and LT are inversely correlated across the network; higher algorithmic complexity coincides with a reduced Lyapunov time. This relationship, observed despite the distinct theoretical foundations of KC (information theory) and LE (dynamical systems), strengthens the argument that human activities simultaneously increase disorder and diminish forecast skill.
Methodological limitations are acknowledged. LZA‑based KC requires sufficiently long, gap‑free records; the authors do not detail how missing values were treated, which could affect KC estimates. The sensitivity of LE to embedding parameters and to measurement noise is not explored, raising the possibility of over‑estimation in noisy series. Future work is suggested to include bootstrap or Monte‑Carlo validation, alternative binarisation schemes, and comparative analyses with stochastic models.
In conclusion, the study presents a novel integrated framework that couples Kolmogorov complexity and Lyapunov analysis to quantify both the intrinsic randomness and the chaotic predictability of streamflow time series. By demonstrating that anthropogenic influences elevate KC while compressing LT, the paper provides quantitative evidence useful for water‑resource managers, dam operators, and policymakers confronting the dual challenges of human water use and climate variability. Extensions to other basins, multivariate climate‑hydrology coupling, and incorporation into machine‑learning forecasting pipelines are proposed as promising avenues for further research.
Comments & Academic Discussion
Loading comments...
Leave a Comment