Hieroglyph: Hierarchical Glia Graph Skeletonization and Matching
Automatic 3D reconstruction of glia morphology is a powerful tool necessary for investigating the role of microglia in neurological disorders in the central nervous system. Current glia skeleton reconstruction techniques fail to capture an accurate t…
Authors: Tiffany T. Ly, Tamal Batabyal, Jeremy Thompson
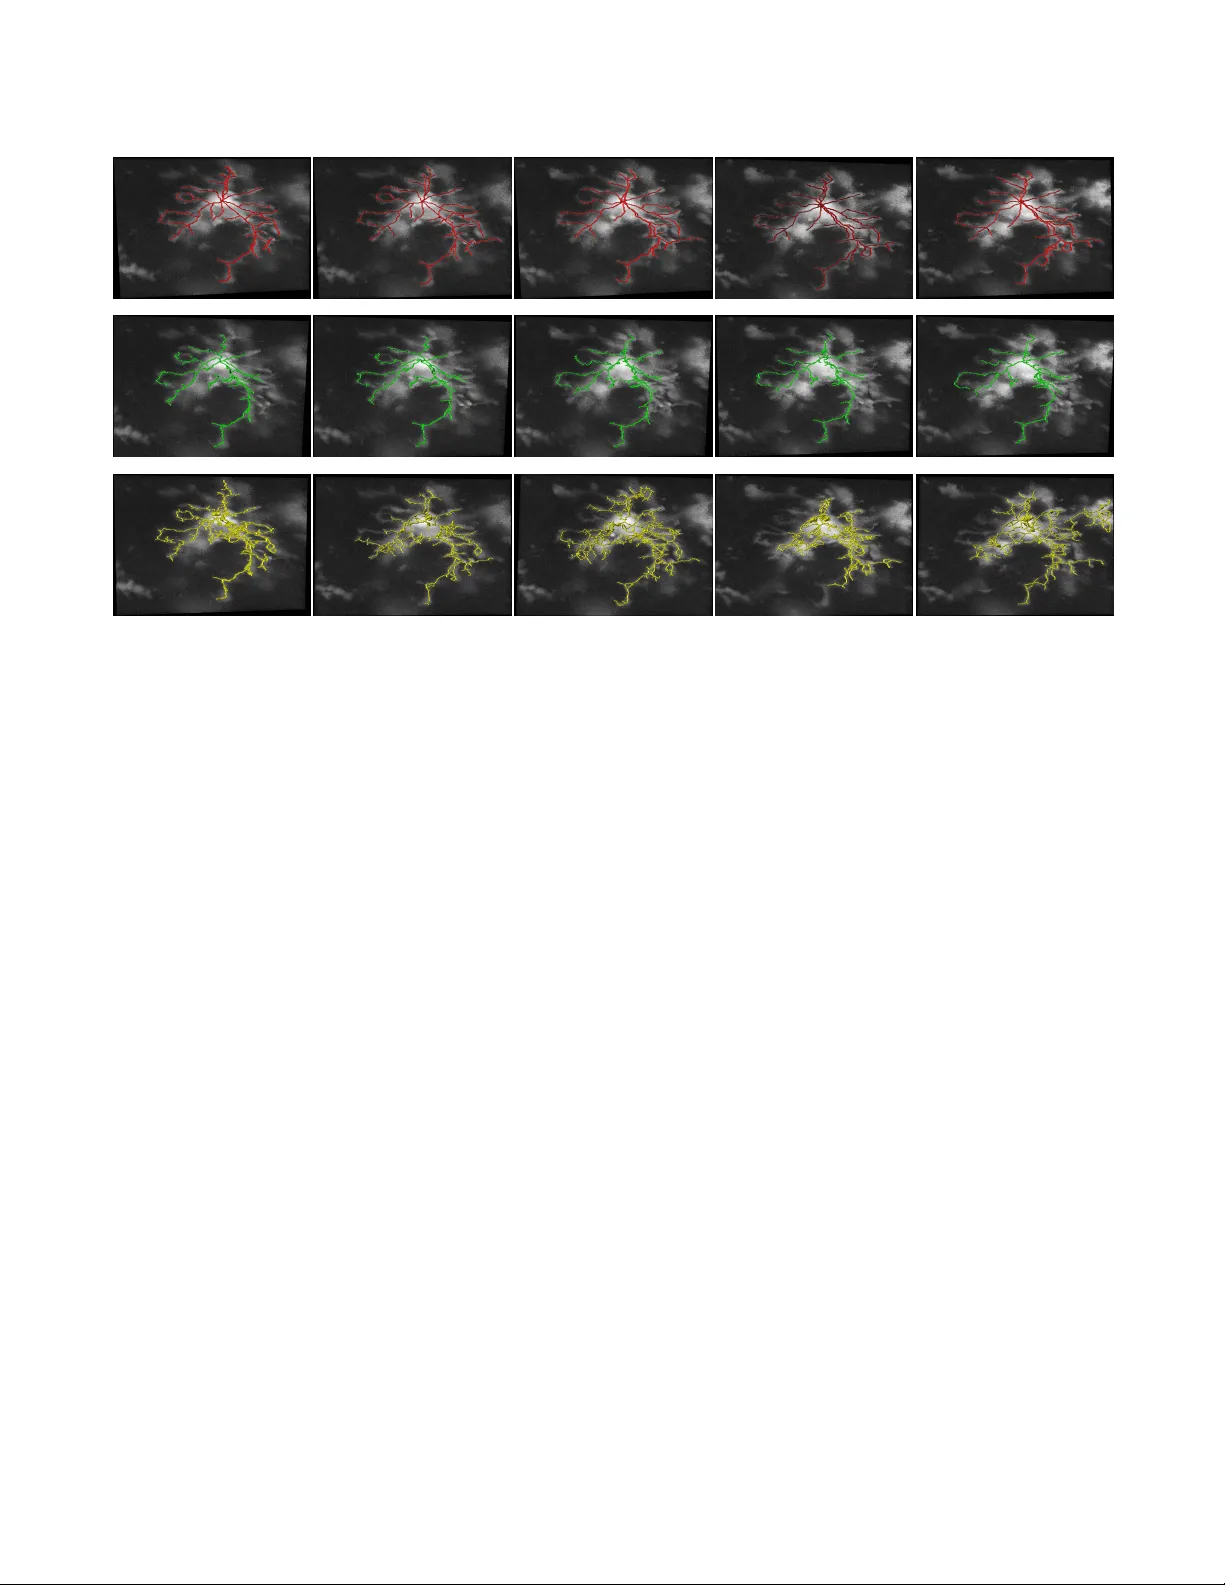
HIER OGL YPH: HIERARCHICAL GLIA GRAPH SKELETONIZA TION AND MA TCHING T iffany T . L y † , T amal Batabyal † , J er emy Thompson ‡ , T ajie Harris ‡ , Daniel S. W eller † , and Scott T . Acton † † C.L. Bro wn Department of Electrical & Computer Engineering ‡ Center for Brain Immunology and Glia, Department of Neuroscience, Uni versity of V ir ginia Charlottesville, V ir ginia USA ABSTRA CT Automatic 3D reconstruction of glia morphology is a po w- erful tool necessary for in vestigating the role of microglia in neurological disorders in the central nervous system. Cur- rent glia sk eleton reconstruction techniques fail to capture an accurate tracing of the processes over time, useful for the study of the microglia motility and morphology in the brain during healthy and diseased states. W e propose Hier oglyph , a fully automatic temporal 3D skeleton reconstruction algo- rithm for glia imaged via 3D multiphoton microscop y . Hier o- glyph yielded a 21% performance increase compared to state of the art automatic skeleton reconstruction methods and out- performs the state of the art in dif ferent measures of consis- tency on datasets of 3D images of microglia. The results from this method provide a 3D graph and digital reconstruction of glia useful for a myriad of morphological analyses that could impact studies in brain immunology and disease. Index T erms — 3D skeleton, graph theory , reconstruction 1. INTR ODUCTION Microglia are the tissue resident immune cells of the brain parenchyma and play an activ e role in brain homeostasis. The advancements made in the recent studies of microglia hav e shifted our understanding of the impact of microglia not only in de velopment, b ut also its role in injury , diseases, and ag- ing [1–4]. Microglia processes (thin ’le gs’ that extend from the cell body) are constantly in motion for surveillance un- der homeostasis, which is predicted to allow for microglia to sense and respond rapidly to their en vironment [5 – 8]. During brain injury and disease this continual mov ement is altered as microglia retract their processes and take on a more amoeboid morphology . Howe ver , little is kno wn about ho w the decrease in microglia processes activity and their motility af fect their ability to perform surveillance functions in the brain. The complexity of glia morphology makes it dif ficult to automate the analysis of glia motility . Existing studies ha ve manually traced glial images or used heuristic image pro- cessing methods to measure process length, e xtension and retraction ov er time [9–11]. Researchers hav e de veloped au- tomatic image analysis methods in volving the reconstruction Fig. 1 . Hierarchy of a glial cell shown via color from violet to red (left) and 3D skeleton of the cell (right). of skeletons of the microglia processes [12, 13]. In [12], the skeletonization was semi-automatic in that the user went through many preprocessing tasks in ImageJ before achieving a 2D skeleton. Howe ver , 2D skeletonization loses informa- tion since the sk eletons may ov erlap in the z direction, as shown in our e xperimental results. ProMoIJ achie ves an automatic reconstruction of a 3D skeleton of glia, which is then used to analyze microglia motility [13]. Howe ver , the skeletonization is not accomplished for the entire cell, rather each process of the glial cell is manually selected by the user . Furthermore, the user must define a set of parameters to heuristically preprocess the image and create a skeleton. This reconstruction of the processes ov er time are manually as- sisted. In this paper , we describe Hiero glyph – a hierarchical glia graph skeletonization and matching system. Morphological reconstruction is also an important tech- nique for the analysis of neuron morphology . Y et e ven in NeuroMorpho.org, the largest curated inv entory of publicly accessible 3D neuronal reconstructions, less than 5% of the reconstructions are traced in a semi-automatic fashion, while the remainder are manually traced [14]. State-of-the-art meth- ods for automatic sk eletonization include medial axis thin- ning, which inv olves iterati vely eroding the boundary of the object until only a one-voxel-thick limb remains. The dif fi- culty in achieving an accurate skeleton still remains, as the existing methods are dependent on the object shape or the image intensity v ariations. Non-smooth and irregular struc- ture can lead to spurious edges, false branches, discontinu- ities, loops and other anatomical or structural inaccuracies in the skeleton reconstruction. Such methods typically require a prior segmentation of the object of interest, which makes the resulting skeleton extremely dependent on the segmentation. The inaccuracies of the prior information can lead to incon- sistent and erroneous skeletonization. In this paper , we propose, Hier oglyph , a hierarchical algo- rithm for an automatic 3D reconstruction of consistent skele- tons over time using glial images. First, we provide an au- tomatic tracing method of a glial cell that achiev es an accu- rate 3D skeleton without loops or discontinuities. Second, we use the graph representation of the prior skeleton infor- mation to achiev e consistent 3D skeletons of a microglia o ver time. Third, our 3D temporal reconstructions are represented in digital and graph format that can be easily manipulated by statistical and graphical morphology analysis. 2. METHODS Hier oglyph produces a consistent temporal digital reconstruc- tion of a glia skeleton by using prior information from pre vi- ous 3D acquisition. The skeleton from a previous acquisition is ev olved by representing the cell as a graph where the glia process lengths are stored as edge information and each bi- furcation is stored as a node. In Section 2.1, we describe the use of the graph representation of the glia to achieve a skele- ton tracing using a shortest path algorithm. In Section 2.2, Hier oglyph ev olves the previous skeleton to match the image in the next time frame. Each generated skeleton is employed to create another consistent 3D skeleton for the following glia image in the time series. Fig. 2 . Overall methodology . A) The shortest path is take from the end node to the soma to get the first skeleton. B-C) a skeleton is morphed to another in an hierarchical manner D) the resulting skeleton. (B-C) is repeated for the remaining images in the time series. 2.1. 3D skeleton: shortest path in a graph Let us consider a set of 3D time series images where the seg- mentation of the image at time t =1 is represented as an ad- jacency matrix of an undirected, weighted, rooted tree graph, Adj(G) . The graph consists of vertices and edges, G=(V ,E) , where the vertices are initialized at ev ery fore ground pix el in the segmented image and size of V equals the number of foreground vox el in the segmented image. The edges are weighted by the spatial Euclidean distance between the vox- els, e = 1 , √ 2 , or √ 3 [15, 16]. The adjacency matrix is filled with the weights of the edges between all the fore ground v ox- els. The size of Adj(G) is N × N where N is the number foreground pix els, or the number of vertices. From a biological standpoint, we know that our recon- structed graph is a simple graph which should not contain an y loops or discontinuities from the processes to the soma of the glia. Thus, to construct our tracing of the cell, we use Di- jkstra’ s algorithm [17] to find the shortest path between the terminal nodes of the processes to the soma of the glia. The terminal nodes are extracted from the se gmentation of the 3D glia, and the soma verte x is the center of mass of the 3D soma segment. The algorithm starts at terminal node and finds the shortest route within the giv en adjacency matrix of the graph to the soma, or root node. The route of the voxels between the soma and the terminal nodes result in a 3D skeleton trac- ing of the glia. The benefit of the graph r epr esentation is the rich information pr ovided that includes the hier ar chy of the pr ocesses, the bifur cation points, and the endpoints. These properties are exploited in the creation a consistent skeleton for the subsequent glia image in a time series. 2.2. Consistent 3D skeletons fr om temporal information Acquiring glial sk eletons solely from segmentation can result in inconsistencies between acquisitions in time and is compu- tationally burdensome. A single glia cell over time e xtends and retracts the processes while keeping the same number of branches that emerge from the soma. Thus the morphology of a glial cell between subsequent acquisitions is consistent. W e propose a method that uses prior temporal information combined with intensity information from the current image. Hier oglyph seeks to dri ve the skeleton from a previous time frame to the vessel-like information in the original image of the current time stack. The latter information is gathered by using the Hessian- based vessel enhancement technique to distinguish tubular structures in an image. This technique utilizes a multiscale function according to three direction of the orthonormal eigen vectors, e i ( x ) , where x is the pixel position within the image domain [19, 20]. These directional eigen vec- tors are attained by computing the Hessian matrix of a Gaussian smoothed 3D image and then ordering the eigen- vectors by the increasing magnitudes of the eigen v alues | λ 1 | ≤ | λ 2 | ≤ | λ 3 | >> 0 . A vessel-enhanced image is obtained with a low | λ 1 | value and high | λ 2 | and | λ 3 | magni- tudes. W e call the vessel enhanced image I v . The initial sk eleton from the previous time frame, S t − 1 is broken into hierarchies, where the root node is equal to 0 and the hierarchy increases towards the terminal branches. Every bifurcation of a process separates the process into another hi- erarchy H , where H = h 1 , h 2 , ...h i is a set of hierarchies, length i . Every segment belongs to a cluster h i within the set. The algorithm morphs the skeleton, one segment at a time, starting from the lo west hierarchy until it achie ves the max- imum response with the vessel enhanced image. This is re- Ground truth Hieroglyph Skel2Graph [18] time t =1 minute time t =2 minute time t =6 minute time t =10 minute time t =13 minute Fig. 3 . Segmentation results of 3D microglia images. peated for all segments of the skeleton in H . The final skele- ton at time t is given by S t = max i X h =1 S t =1 ( h ∗ ) × I v (1) I v = ( x x > 0 , − x av g x ≤ 0 . (2) where h ∗ is the morphed segment from the previous skeleton and x is the voxel v alue in I v . The morphing of the segments are changes in the 26 cardinal directions. The morphed seg- ments are bounded by the following conditions: 1) The first hierarchy must start at the root node. 2) Segments may not ov erlap with each other (no loops). 3) The bifurcation points are regularized so the y do not drastically move. The zero intensity v alues in I v are set to the negativ e v alue of the average pixel intensity to penalize morphing beyond vessels in the Hessian map. Once a ne w se gment is created, the tree is rerouted resulting in an updated graph representa- tion of the skeleton so that the routes and bifurcation nodes are updated. 3. EXPERIMENT AL RESUL TS AND AN AL YSIS 3.1. Imaging and fluorescence technique The dataset consists of 3D images of microglia from living mice using multiphoton microscopy . T o label microglia in the mouse brain, we used mice with an inducible Cre recombi- nase under the control of the CX3CR1 promoter crossed to the Ai6 fluorescent reporter mouse (Jackson Laboratories, Bar Harbor , ME) to generate CX3CR1creER T2/+ X Ai6ZsGreen [21, 22]. At post-natal day (P23) 23, mice were giv en 10uL/g body weight of a 20mg/mL T amoxifen (Sigma) solution in corn oil to induce recombination of the floxed stop codon leading to ZsGreen expression in microglia. All procedures adhered to guidelines of the Institutional Animal Care and Use Committee (A CUC) at the Univ ersity of V irginia. Mi- croglia of adult mice (7-10 weeks old) were imaged using a Leica TCS SP8 multiphoton microscopy system equipped with a Coherent Chameleon Ti:Sapphire laser and a 25x 0.95 N A immersion lens. ZsGreen was excited with a wa velength of 880 nm. 3.2. Dataset The 3D movies of microglia were imaged over 13 minutes with z-stacks taken at one minute intervals, containing single or multiple microglia per field of view . Some of the images were cropped from a larger field of view containing about 10 different cells and two images were imaged from a zoomed in view of one individual cell. The images ranged from a horizontal pixel width of .01 µ m and a vertical pixel width of .01 µ m to horizontal pixel width of .2 µ m and a vertical pixel width of .2 µ m. In the 3D images, there is variation in the intensity contrast throughout the cell, non-structural noise, and fluorescence bleeding through z-stack due to the lengthy imaging technique which makes it difficult to visu- alize and process. The images were preprocessed using his- togram equalization, which increased the intensity throughout the cell but further increased noise in the background. In our experiments, the segmentation at time t = 1 was attained using the coupled tubularity flow field and blob flow field (T uff-Bf f) algorithm [23]. 3.3. Perf ormance Evaluation W e use a dataset consisting of 3D images of microglia over a time of 13 minutes, as described in Section 3.2 . W e compare our reconstruction of temporal skeleton results with an auto- matic skeleton reconstruction method called Skel2Graph3D, which requires a 3D se gmentation of the original image at each time and was used to reconstruct osteocyte cells [18]. This was done as a comparison, because osteocytes are sim- ilar in morphology to microglia. Their 3D skeletonization function is based on a medial axis thinning algorithm [24, 25], but the Skel2Graph3D algorithm iteratively prunes the skele- ton and con verts it into graph representation. The ground truth was attained using the Simple Neurite T racer in ImageJ, which is a semi-automatic tracing software [26]. W e compare the accuracy of the Hier oglyph results and the state-of-the- art comparisons with the ground truth. W e note that even the ground truth may hav e user error due to background noise and intensity inhomogeneity throughout the object of interest. From Figure 3, Hier oglyph has a consistent structure o ver time. The algorithm maintains consistency by its working principle. But the spatiotemporal localization of the consis- tent skeletons are obtained within a mar gin of error . Our tem- poral results are based on the result of the prior image but we can see that the skeleton ov er time changes as the cell changes. W e use a hierarchical weighting method to com- pare the accuracy scores. The branches in each hierarchy are counted and the true and false count is attained by compar- ing with the ground truth and the accuracy T P T P + F P + F N is at- tained for each hierarchy . The final accuracy is found by giv- ing a higher weight to the hierarchies closest to the soma, or the primary branches. The weight is established with the fac- torial of the maximum number of hierarchies times the accu- racy at each hierarchy given by A total = H g t max ! P i n =0 A H n where H g t is the number of hierarchies in the ground truth and i is the total number of hierarchies in the test image. This final accurac y for Hier oglyph for the first time stack is 55% for Hier oglyph , and 34% for Skel2Graph. Since the accuracy of the skeleton over time is dependent on the accuracy of the first skeleton, we consider additional measurements for com- parison. W e measure the number of bifurcation points and number of terminal nodes as well as the distance between the results and the ground truth, as sho wn in Figure 4. The number of bifurcation points and terminal points in Hier oglyph results remain consistent with the number of bifurcation points in the skeletons from the ground truth. The Skel2Graph has a sig- nificantly greater number of bifurcation points and endpoints due to the loops. The distance between the bifurcation points and endpoints of the ground truth’ s and that of Hier oglyph and Sk el2Graph are calculated. The measurements show how structurally similar the resulting skeletons are compared to Fig. 4 . Structural measurements compared to the ground truth. the ground truth skeleton. Figure 5 shows that a 3D skeleton rotated to make processes extending in the z-direction more visible. Some processes described may not be visible or be accurately distinguished in a 2D image. This proves the ne- cessity of a 3D skeleton for morphological and motility anal- ysis. Fig. 5 . A skeletonization of a glial cell in one orientation (left) and a 3D rotation of the same (right). The rotated view reveal branches not shown in the original vie w motivating 3D analysis. 4. CONCLUSION In this paper , we proposed an automatic temporal 3D skele- tonization method for glia images. W e are able to use the a priori information from preceding skeletons to derive subse- quent ones. The method is hierarchical since the skeletoniza- tion and graph matching are performed in se gments starting at the soma and e xtending to the endpoints of the processes. Hier oglyph attained consistent skeleton structures o ver time. While our method performed better than the state of the art, it could be further improved to account for the addition and deletion of glia processes o ver time. Hiero glyph does provide rich information for the analysis of glia motility in homeosta- sis and also in impaired states. 5. REFERENCES [1] M. Colonna and O. Butovsky , “Microglia function in the cen- tral nervous system during health and neurode generation, ” An- nual Revie w of Immunology , vol. 35, pp. 441–468, 2017. [2] D. P . Schafer and B. Stevens, “Microglia function in central nervous system de velopment and plasticity , ” Cold Spring Har - bor P erspectives in Biology , v ol. 7, no. 10, p. a020545, 2015. [3] P . L. Poliani, Y . W ang, E. Fontana, M. L. Robinette, Y . Y aman- ishi, S. Gilfillan, and M. Colonna, “Trem2 sustains microglial expansion during aging and response to demyelination, ” The Journal of clinical in vestigation , v ol. 125, no. 5, pp. 2161– 2170, 2015. [4] J. C. Cronk, A. J. Filiano, A. Louveau, I. Marin, R. Marsh, E. Ji, D. H. Goldman, I. Smirnov , N. Geraci, S. Acton et al. , “Peripherally derived macrophages can engraft the brain inde- pendent of irradiation and maintain an identity distinct from microglia, ” Journal of Experimental Medicine , vol. 215, no. 6, pp. 1627–1647, 2018. [5] H. W ake, A. J. Moorhouse, S. Jinno, S. Kohsaka, and J. Nabekura, “Resting microglia directly monitor the functional state of synapses in viv o and determine the fate of ischemic terminals, ” J ournal of Neur oscience , vol. 29, no. 13, pp. 3974– 3980, 2009. [6] M.- ` E. Tremblay , R. L. Lowery , and A. K. Majewska, “Mi- croglial interactions with synapses are modulated by visual ex- perience, ” PLoS Biology , vol. 8, no. 11, p. e1000527, 2010. [7] D. Dav alos, J. K. Ryu, M. Merlini, K. M. Baeten, N. Le Moan, M. A. Petersen, T . J. Deerinck, D. S. Smirnoff, C. Be- dard, H. Hakozaki et al. , “Fibrinogen-induced perivascular microglial clustering is required for the development of ax- onal damage in neuroinflammation, ” Nature Communications , vol. 3, p. 1227, 2012. [8] C. Madry , V . Kyrargyri, I. L. Arancibia-C ´ arcamo, R. Joliv et, S. Kohsaka, R. M. Bryan, and D. Attwell, “Microglial rami- fication, surveillance, and interleukin-1 β release are regulated by the two-pore domain k+ channel thik-1, ” Neur on , 2017. [9] A. Nimmerjahn, F . Kirchhoff, and F . Helmchen, “Resting microglial cells are highly dynamic surveillants of brain parenchyma in vivo, ” Science , v ol. 308, no. 5726, pp. 1314– 1318, 2005. [10] L.-J. W u and M. Zhuo, “Resting microglial motility is inde- pendent of synaptic plasticity in mammalian brain, ” J ournal of neur ophysiology , v ol. 99, no. 4, pp. 2026–2032, 2008. [11] D. Davalos, J. Grutzendler, G. Y ang, J. V . Kim, Y . Zuo, S. Jung, D. R. Littman, M. L. Dustin, and W .-B. Gan, “ Atp mediates rapid microglial response to local brain injury in viv o, ” Natur e Neur oscience , vol. 8, no. 6, p. 752, 2005. [12] K. Y oung and H. Morrison, “Quantifying microglia morphol- ogy from photomicrographs of immunohistochemistry pre- pared tissue using imagej, ” Journal of visualized experiments: JoVE , no. 136, 2018. [13] I. Paris, J. C. Sav age, L. Escobar , O. Abiega, S. Gagnon, C.- W . Hui, M.- ` E. Tremblay , A. Sierra, and J. V alero, “Promoij: A new tool for automatic three-dimensional analysis of mi- croglial process motility , ” Glia , vol. 66, no. 4, pp. 828–845, 2018. [14] D. E. Donohue and G. A. Ascoli, “ Automated reconstruction of neuronal morphology: an overvie w , ” Brain r esearc h re views , vol. 67, no. 1-2, pp. 94–102, 2011. [15] S. Mukherjee, S. Basu, B. Condron, and S. T . Acton, “T ree2tree2: Neuron tracing in 3d, ” in Biomedical Imaging (ISBI), 2013 IEEE 10th International Symposium on . IEEE, 2013, pp. 448–451. [16] H. Peng, Z. Ruan, D. Atasoy , and S. Sternson, “ Automatic re- construction of 3d neuron structures using a graph-augmented deformable model, ” Bioinformatics , v ol. 26, no. 12, pp. i38– i46, 2010. [17] E. W . Dijkstra, “ A note on two problems in connexion with graphs, ” Numerisc he mathematik , v ol. 1, no. 1, pp. 269–271, 1959. [18] P . K ollmannsberger , M. K erschnitzki, F . Repp, W . W agermaier , R. W einkamer , and P . Fratzl, “The small world of osteocytes: connectomics of the lacuno-canalicular network in bone, ” Ne w Journal of Physics , v ol. 19, no. 7, p. 073019, 2017. [19] A. F . Frangi, W . J. Niessen, K. L. V incken, and M. A. V ierge ver , “Multiscale vessel enhancement filtering, ” in In- ternational Confer ence on Medical Image Computing and Computer-Assisted Intervention . Springer , 1998, pp. 130– 137. [20] Y . Sato, S. Nakajima, N. Shiraga, H. Atsumi, S. Y oshida, T . K oller , G. Gerig, and R. Kikinis, “Three-dimensional multi- scale line filter for segmentation and visualization of curvi- linear structures in medical images, ” Medical image analysis , vol. 2, no. 2, pp. 143–168, 1998. [21] S. Y ona, K.-W . Kim, Y . W olf, A. Mildner , D. V arol, M. Brek er , D. Strauss-A yali, S. V iukov , M. Guilliams, A. Misharin et al. , “Fate mapping re veals origins and dynamics of monocytes and tissue macrophages under homeostasis, ” Immunity , vol. 38, no. 1, pp. 79–91, 2013. [22] L. Madisen, T . A. Zwingman, S. M. Sunkin, S. W . Oh, H. A. Zariwala, H. Gu, L. L. Ng, R. D. Palmiter , M. J. Hawrylycz, A. R. Jones et al. , “ A robust and high-throughput cre report- ing and characterization system for the whole mouse brain, ” Natur e Neur oscience , vol. 13, no. 1, p. 133, 2010. [23] T . L y , J. Thompson, T . Harris, and S. T . Acton, “The coupled tuff-bf f algorithm for automatic 3d segmentation of microglia, ” pp. 121–125, 2018. [24] T .-C. Lee, R. L. Kashyap, and C.-N. Chu, “Building skele- ton models via 3-d medial surface axis thinning algorithms, ” CVGIP: Graphical Models and Image Pr ocessing , v ol. 56, no. 6, pp. 462–478, 1994. [25] H. Homann, “Implementation of a 3d thinning algorithm, ” In- sight Journal , v ol. 421, 2007. [26] M. H. Longair , D. A. Baker, and J. D. Armstrong, “Simple neurite tracer: open source software for reconstruction, visu- alization and analysis of neuronal processes, ” Bioinformatics , vol. 27, no. 17, pp. 2453–2454, 2011.
Original Paper
Loading high-quality paper...
Comments & Academic Discussion
Loading comments...
Leave a Comment