📝 Original Info
- Title: Petascale Cloud Supercomputing for Terapixel Visualization of a Digital Twin
- ArXiv ID: 1902.04820
- Date: 2019-03-13
- Authors: Researchers from original ArXiv paper
📝 Abstract
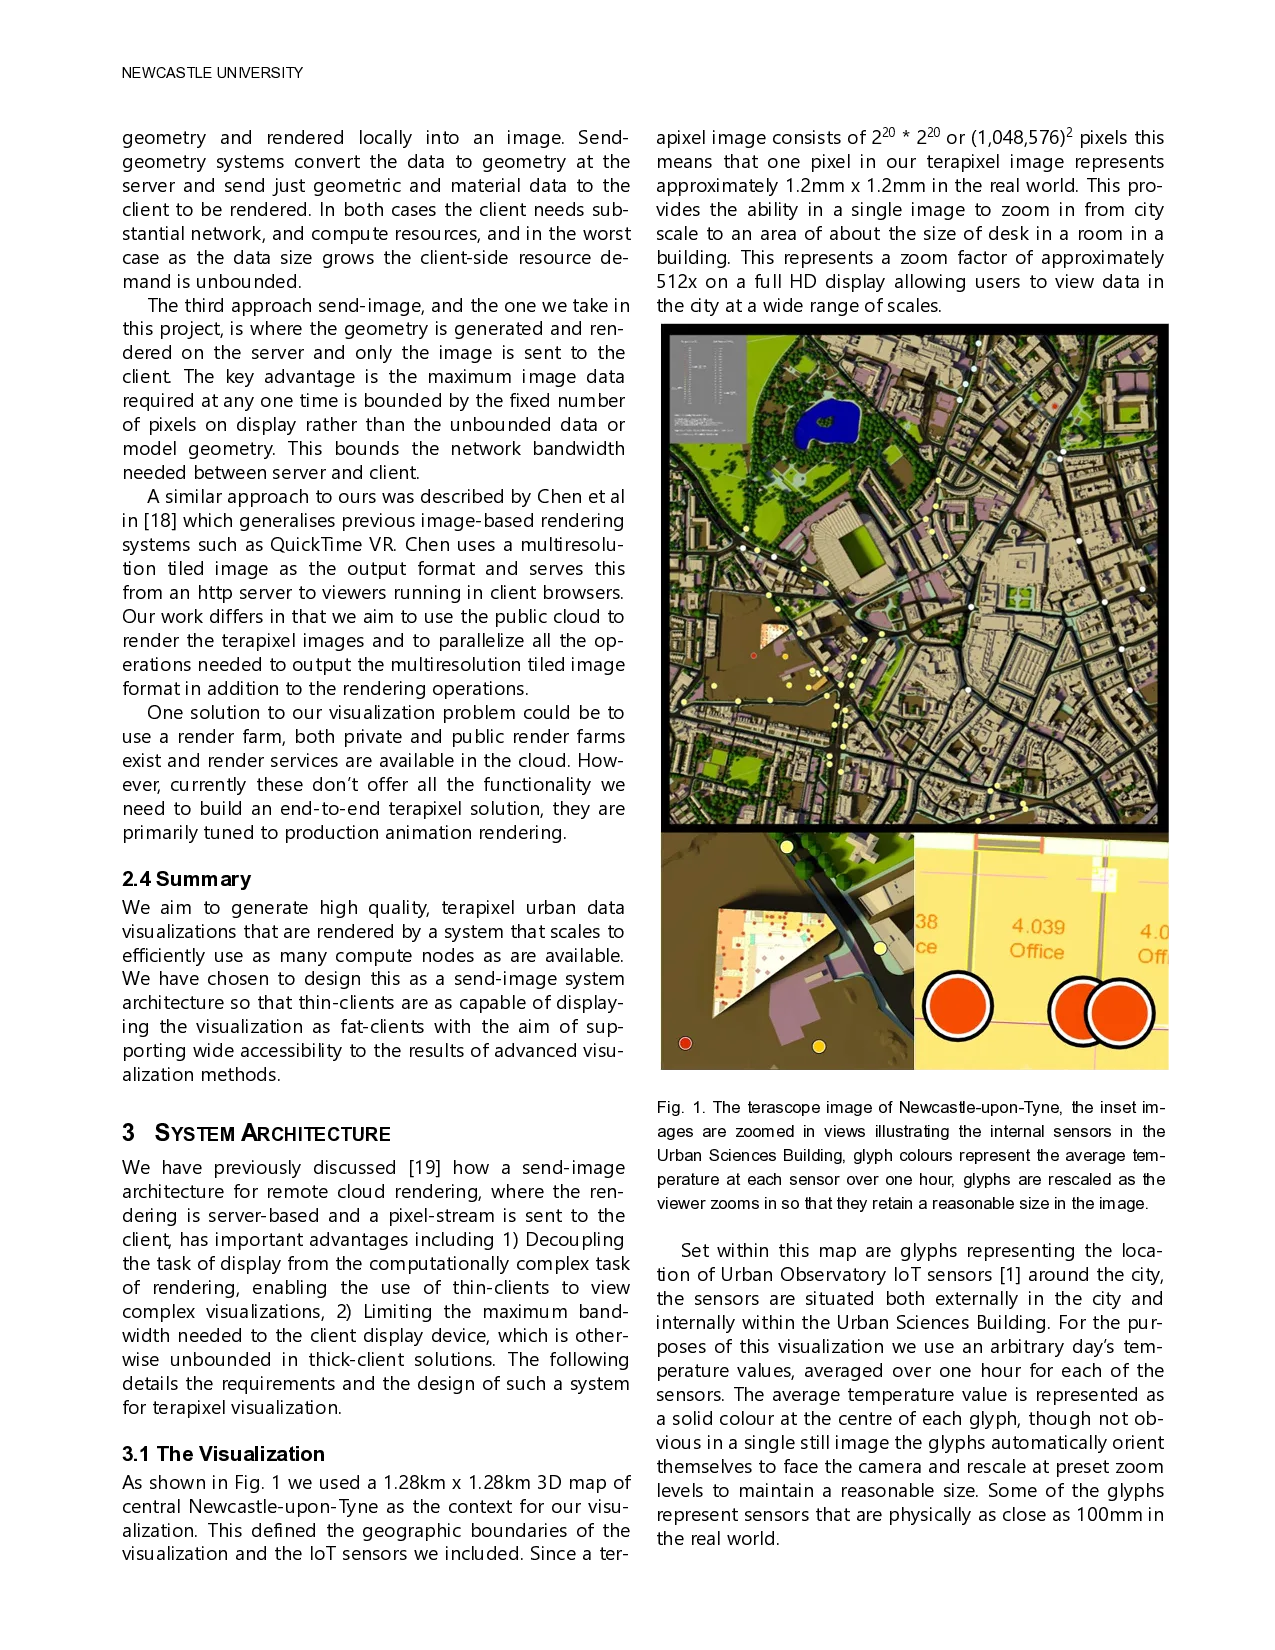
Background: Photo-realistic terapixel visualization is computationally intensive and to date there have been no such visualizations of urban digital twins, the few terapixel visualizations that exist have looked towards space rather than earth. Objective: our aims are: creating a scalable cloud supercomputer software architecture for visualization; a photo-realistic terapixel 3D visualization of urban IoT data supporting daily updates; a rigorous evaluation of cloud supercomputing for our application. Method: we migrated the Blender Cycles path tracer to the public cloud within a new software framework designed to scale to petaFLOP performance. Results: we demonstrate we can compute a terapixel visualization in under one hour, the system scaling at 98% efficiency to use 1024 public cloud GPU nodes delivering 14 petaFLOPS. The resulting terapixel image supports interactive browsing of the city and its data at a wide range of sensing scales. Conclusion: The GPU compute resource available in the cloud is greater than anything available on our national supercomputers providing access to globally competitive resources. The direct financial cost of access, compared to procuring and running these systems, was low. The indirect cost, in overcoming teething issues with cloud software development, should reduce significantly over time.
💡 Deep Analysis
Deep Dive into Petascale Cloud Supercomputing for Terapixel Visualization of a Digital Twin.
Background: Photo-realistic terapixel visualization is computationally intensive and to date there have been no such visualizations of urban digital twins, the few terapixel visualizations that exist have looked towards space rather than earth. Objective: our aims are: creating a scalable cloud supercomputer software architecture for visualization; a photo-realistic terapixel 3D visualization of urban IoT data supporting daily updates; a rigorous evaluation of cloud supercomputing for our application. Method: we migrated the Blender Cycles path tracer to the public cloud within a new software framework designed to scale to petaFLOP performance. Results: we demonstrate we can compute a terapixel visualization in under one hour, the system scaling at 98% efficiency to use 1024 public cloud GPU nodes delivering 14 petaFLOPS. The resulting terapixel image supports interactive browsing of the city and its data at a wide range of sensing scales. Conclusion: The GPU compute resource available
📄 Full Content
NEWCASTLE UNIVERSITY
Petascale Cloud Supercomputing for
Terapixel Visualization of a Digital Twin
Nicolas S. Holliman, Member IEEE Computer Society, Manu Antony,
James Charlton, Stephen Dowsland, Philip James and Mark Turner
Abstract— Background—Photo-realistic terapixel visualization is computationally intensive and to date there have been no
such visualizations of urban digital twins, the few terapixel visualizations that exist have looked towards space rather than earth.
Objective—our aims are: creating a scalable cloud supercomputer software architecture for visualization; a photo-realistic
terapixel 3D visualization of urban IoT data supporting daily updates; a rigorous evaluation of cloud supercomputing for our
application. Method—We migrated the Blender Cycles path tracer to the public cloud within a new software framework designed
to scale to petaFLOP performance. Results—we demonstrate we can compute a terapixel visualization in under one hour, the
system scaling at 98% efficiency to use 1024 public cloud GPU nodes delivering 14 petaFLOPS. The resulting terapixel image
supports interactive browsing of the city and its data at a wide range of sensing scales. Conclusion—The GPU compute
resource available in the cloud is greater than anything available on our national supercomputers providing access to globally
competitive resources. The direct financial cost of access, compared to procuring and running these systems, was low. The
indirect cost, in overcoming teething issues with cloud software development, should reduce significantly over time.
Index Terms—Data Visualization, Internet of Things, Scalability, Supercomputers
—————————— ——————————
1 INTRODUCTION
S we gather increasing amounts of data about our
urban environment it is important to present this in
informative, engaging and accessible ways so that the
widest possible set of stakeholders have the potential to
see the data. The Newcastle Urban Observatory [1] has
been collecting IoT sensed environmental data about the
city of Newcastle-upon-Tyne for over three years, gather-
ing more than nine hundred million data records to date.
As is common to many data platforms the rate of data
collection is significantly faster than the rate at which hu-
mans can comprehend and learn from the information the
data carries [2]. Therefore, we explore how we can present
descriptive statistics, such as hourly sensor averages, in a
realistic 3D visualization of the city and do so at a range of
geographic scales.
Terapixel images are images that contain over one tril-
lion pixels and, within the right toolset [3], provide an in-
tuitive, fluid user experience where the viewer can see an
overview of the whole image or zoom into incredible de-
tail. In this article we demonstrate that we can zoom in
from an overview of just over one square kilometre of the
city of Newcastle-upon-Tyne to see detail within a single
room in an office or a house with one pixel in the image
representing an area of 1.4 mm2 in the real world. Because
viewing a terapixel image depends only on image display
capabilities any web browser can display it, making tera-
pixel images accessible on a wide range of thin clients.
This opens access to high quality, high detail visualizations
without needing an expensive, in cost or energy use [6],
client-side 3D graphics engine. To the best of our
knowledge we present here the first terapixel visualization
of IoT data within a 3D urban environment.
To visualize the city and its data we have chosen an ad-
vanced path-tracing renderer that is more typically used
for cinematic and architectural rendering. We selected
Cycles, from the Blender toolset [4], because of its high
quality physically based lighting simulation calculations.
This has allowed us to achieve an elevated level of realism
in our rendering of the city and bringing with it graphical
options that are not available in visualization tools that
use standard hardware rendering libraries.
The combination of high-quality rendering and tera-
pixel imaging can be an attractive one for users and al-
lows us to explore new ways of visualizing urban IoT data
within its city context. However, while the end user experi-
ence is compelling there is a significant computational
cost to producing a high quality terapixel image. To ad-
dress this issue, we propose the use of supercomputer
scale systems in the cloud. The focus of this article is the
————————————————
N.S. Holliman is with the School of Computing, Newcastle University,
Newcastle-upon-Tyne, NE4 5TG. E-mail:
nick.holliman@newcastle.ac.uk
M. Antony is with the School of Computing, Newcastle University,
Newcastle-upon-Tyne, NE4 5TG. E-mail: m.antony@newcastle.ac.uk
J. Charlton is with the Department of Architecture and Built Environ-
ment, Northumbria University, Newcastle-upon-Tyne, NE1 8ST. E-
mail: j.charlton@northumbria.ac.uk
S. Dowsland is with the Sc
…(Full text truncated)…
📸 Image Gallery
Reference
This content is AI-processed based on ArXiv data.