Modelling the Political Context in Requirements Engineering. The System is made for Man, not Man for the System
This paper describes the authors point of view on reaching a stage at which it is necessary to understand customer organizations better to identify their problems and how to address them. To resolve this issue we need a mechanism to capture and model how that organization actually operates by mapping organizations against the system to be developed, by including power and politics in their “too human” and even emotional dimension. We then describe here a notation by which to recognize and document power, politics and the emotional aspects of software requirements-related decision-making in customer organizations. We conclude by outlining that our suggested graphical notation would maybe not solve the problem: but even if it just raises awareness, this would make us closer to solving the problem. Given the sensibility of the political issue, it is assumed that the generated diagram using the above mentioned notations is only for the requirements engineer and his/her team, thus remaining strictly private.
💡 Research Summary
The paper “Modelling the Political Context in Requirements Engineering. The System is made for Man, not Man for the System” argues that contemporary requirements engineering (RE) often treats customer organizations as mere sources of functional and non‑functional specifications, ignoring the complex human, political, and emotional dynamics that shape decision‑making. The authors contend that to deliver systems that truly serve people, RE practitioners must first understand how an organization actually operates, including its power structures, alliances, conflicts, and the emotional states of its stakeholders.
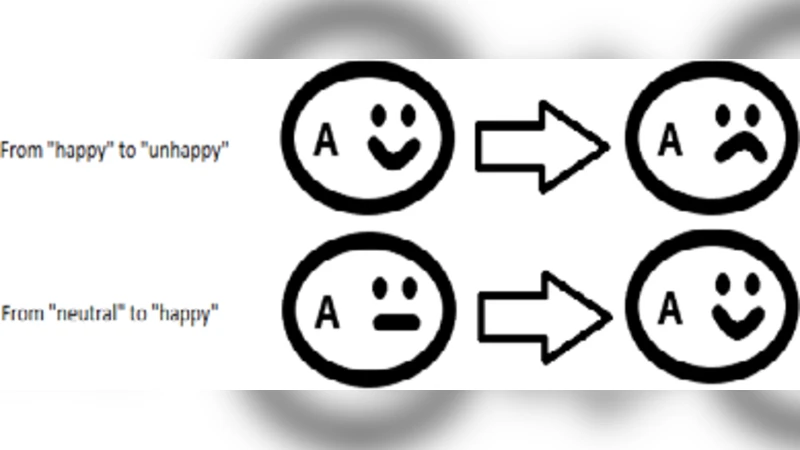
To address this gap, the authors propose a “organization‑system mapping” framework coupled with a novel graphical notation designed to capture and visualise three dimensions: (1) Power – represented by arrows of varying thickness and direction to indicate authority flow; (2) Politics – depicted through line styles (solid, dashed, dotted) and icons (e.g., handshake for alliances, crossed swords for rivalry); and (3) Emotions – shown with facial emojis and colour coding (green for stability, yellow for concern, red for crisis). Each requirement is linked to the specific stakeholder or power node that generated it, making the political and emotional provenance of the requirement explicit.
The notation follows three design principles:
- Simplicity – avoid over‑detailing the organization’s hierarchy; the diagram should be quickly readable.
- Confidentiality – the diagram is intended solely for the RE team and its immediate collaborators, never to be shared outside the project, thereby protecting sensitive internal politics.
- Visibility – the visual cues must make the influence of power, politics, and emotion on requirement decisions immediately apparent.
A case study from a large public‑sector information system project illustrates the approach. The project manager mapped a power clash between the budgeting department and the legal department. The diagram revealed that the budgeting unit’s requirements were being over‑prioritised due to its strong authority arrow, while the legal unit’s concerns were being marginalised, creating a hidden risk. By visualising this tension, the team renegotiated priorities, introduced additional communication sessions, and used emotion labels (e.g., “anxiety”, “frustration”) to address stakeholder resistance. The outcome was a reduction in schedule slip and lower change‑request costs.
The authors acknowledge several limitations. The notation is currently a manual, pen‑and‑paper artefact; no software tool or formal meta‑model is provided, raising concerns about scalability and maintenance. The paper lacks quantitative evaluation—no statistical evidence is offered to prove that the visualisation reduces requirement conflicts or improves project outcomes. Moreover, while confidentiality is stressed, the authors do not detail concrete access‑control mechanisms or governance policies for who may view or edit the diagram.
In conclusion, the proposed notation is not presented as a silver bullet but as a means to raise awareness among RE practitioners about the “too human” aspects of requirements elicitation. By making power, politics, and emotions visible, teams can anticipate hidden sources of conflict, plan mitigation strategies, and ultimately align the system more closely with the people it is meant to serve. Future research directions include developing tool support for automated diagram generation, conducting controlled experiments to measure the approach’s impact, and tailoring the notation to different organisational cultures while defining robust confidentiality frameworks.
Comments & Academic Discussion
Loading comments...
Leave a Comment