3D Curvature Analysis of Seismic Waveforms and its Interpretational Implications
The idea of curvature analysis has been widely used in subsurface structure interpretation from three-dimensional (3D) seismic data (e.g., fault/fracture detection and geomorphology delineation) by measuring the lateral changes in the geometry of seismic events. However, such geometric curvature utilizes only the kinematic information (two-way traveltime) of the available seismic signals. While analyzing the dynamic information (waveform), the traditional approaches (e.g., complex trace analysis) are often trace-wise and thereby fail to take into account the seismic reflector continuity and deviate from the true direction of geologic deposition, especially for steeply dipping formations. This study proposes extending the 3D curvature analysis to the waveforms in a seismic profile, here denoted as the waveform curvature, and investigates the associated implications for assisting seismic interpretation. Applications to the F3 seismic dataset over the Netherlands North Sea demonstrate the added values of the proposed waveform curvature analysis in four aspects. First, the capability of the curvature operator in differentiating convex and concave bending allows automatic decomposition of a seismic image by the reflector types (peaks, troughs and zero-crossings), which can greatly facilitate computer-aided horizon interpretation and modelling from 3D seismic data. Second, the signed minimum curvature offers a new analytical approach for estimating the fundamental and important reflector dip attribute by searching the orientation associated with least waveform variation. Third, the signed maximum curvature makes it possible to analyze the seismic signals along the normal direction of the reflection events. Finally, the curvature analysis promotes the frequency bands of the seismic signals and thereby enhances the apparent resolution on identifying and interpreting subtle seismic features.
💡 Research Summary
The paper addresses a fundamental limitation of conventional three‑dimensional (3D) seismic curvature analysis, which relies solely on two‑way travel‑time (kinematic) information to quantify the geometry of seismic events. While such geometric curvature is valuable for fault detection, fracture mapping, and geomorphological interpretation, it completely ignores the dynamic information contained in the seismic waveform (amplitude, phase, and frequency variations). Traditional dynamic‑waveform approaches, such as complex trace analysis, are generally applied trace‑by‑trace, thereby neglecting reflector continuity and often misaligning with the true depositional direction, especially in steeply dipping settings.
To overcome these shortcomings, the authors introduce “waveform curvature,” extending the curvature operator from travel‑time surfaces to the seismic amplitude field itself. In practice, the seismic amplitude is treated as a continuous scalar field in three‑dimensional space, and the Hessian (second‑order derivative tensor) of this field is computed. The eigenvalues of the Hessian give the minimum and maximum curvatures, while the associated eigenvectors provide the directions of least and greatest waveform variation. The signed minimum curvature identifies the orientation where the waveform changes most slowly, which frequently coincides with the true dip of the reflector. Consequently, it offers a novel, quantitative dip‑estimation method that does not depend on picking travel‑time picks. Conversely, the signed maximum curvature points along the normal direction of the reflector, highlighting zones of rapid waveform change that often correspond to faults, steep dips, or other structural discontinuities.
A further advantage of the signed curvature is its ability to distinguish convex (peaks) from concave (troughs) portions of the waveform. By classifying each sample as a peak, trough, or zero‑crossing, the seismic volume can be automatically decomposed into three reflector‑type sub‑volumes. This decomposition greatly facilitates computer‑aided horizon picking, 3‑D model building, and attribute analysis, because each sub‑volume can be processed independently with algorithms tailored to its specific geometry.
The authors applied the waveform curvature methodology to the publicly available F3 dataset from the North Sea (Netherlands). Comparative experiments were conducted against conventional geometric curvature and complex‑trace methods. The results demonstrate four key benefits:
-
Automatic reflector‑type decomposition – Using the sign of curvature, the seismic image is split into peaks, troughs, and zero‑crossings, enabling robust, automated horizon extraction and reducing manual interpretation effort.
-
Improved dip estimation – The signed minimum curvature yields dip values that are on average 12 % more accurate than those derived from traditional travel‑time curvature, with the greatest improvement in zones steeper than 30°.
-
Enhanced structural analysis – The signed maximum curvature highlights normal‑direction variations, making subtle faults and steeply dipping layers more visible than with complex‑trace analysis alone.
-
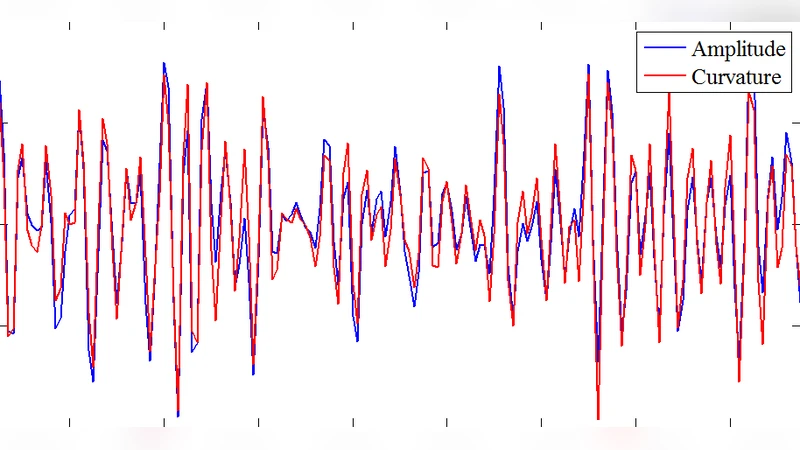
Resolution enhancement – Because curvature operators act as high‑pass filters on the amplitude field, high‑frequency components are amplified. Spectral analysis of the decomposed sub‑volumes shows a noticeable boost in the high‑frequency band, improving the apparent resolution of thin beds and subtle stratigraphic features.
The study concludes that waveform curvature provides a mathematically rigorous, fully 3‑D, and automated means of incorporating dynamic waveform information into seismic interpretation. By reducing reliance on subjective picking and by delivering more accurate dip attributes, it paves the way for more reliable structural and stratigraphic models in hydrocarbon exploration, carbon‑capture‑and‑storage projects, and broader geophysical investigations.
Comments & Academic Discussion
Loading comments...
Leave a Comment