The Impact of Countdown Clocks on Subway Ridership in New York City
Protecting the passengers’ safety and increasing ridership are two never ending pursuits of public transit agencies. One of the proposed methods to achieve both goals for subway service is to implement real time train arriving countdown clocks in subway stations. Metropolitan Transportation Authority (MTA) of New York City (NYC) chose to install such countdown clocks in their stations starting from 2007 on a selection of subway lines. Due to the recent development of Bluetooth Beacon technology, the MTA could now install countdown clocks and train trackers in a non intrusive manner with much faster speed. As a result, the MTA is aiming to install countdown clocks in every subway station on every line. However, with such an aggressive plan, the impact of countdown clocks on subway ridership has not been fully studied. This paper proposes using Panel Regression methods, specifically, Random Effect (RE) model and Fixed Effect (FE) model to quantify the impact of countdown clocks on subway ridership. Machine Learning methods, namely Random Forest (RF) with AdaBoost and Decision Tree (DT) Regression, are also used as alternative data driven approaches for the FE and RE model. The results show that for the G line service, which runs between Brooklyn and Queens, the introduction of countdown clocks could increase weekly ridership by about 1783 per station. The study also found that the machine learning methods provide better accuracy in predicting the ridership than RE and FE models.
💡 Research Summary
**
The paper investigates whether the installation of real‑time train arrival countdown clocks in New York City subway stations leads to measurable changes in ridership. Using the August 31 2017 rollout of Bluetooth‑beacon‑based clocks on the E and G lines as a natural experiment, the authors compile weekly MetroCard swipe counts for each station, and augment these data with weather information (temperature categories and precipitation) and the national unemployment rate. A binary “Has Clock” variable marks the pre‑ and post‑installation periods.
Two analytical frameworks are employed. First, panel regression models—both Fixed‑Effect (FE) and Random‑Effect (RE)—are estimated to isolate the effect of the clocks while controlling for station‑specific heterogeneity and time‑varying covariates. A Hausman test is performed to decide between FE and RE; the test indicates no significant difference, leading the authors to adopt the computationally efficient RE specification. Second, machine‑learning approaches are applied: a Decision‑Tree (DT) regressor serves as a baseline, while a Random‑Forest (RF) model enhanced with AdaBoost (RF‑AdaBoost) provides a more powerful ensemble predictor. Hyper‑parameters (number of trees, depth, learning rate) are tuned via cross‑validation, and model performance is assessed using Mean Squared Error (MSE) and R².
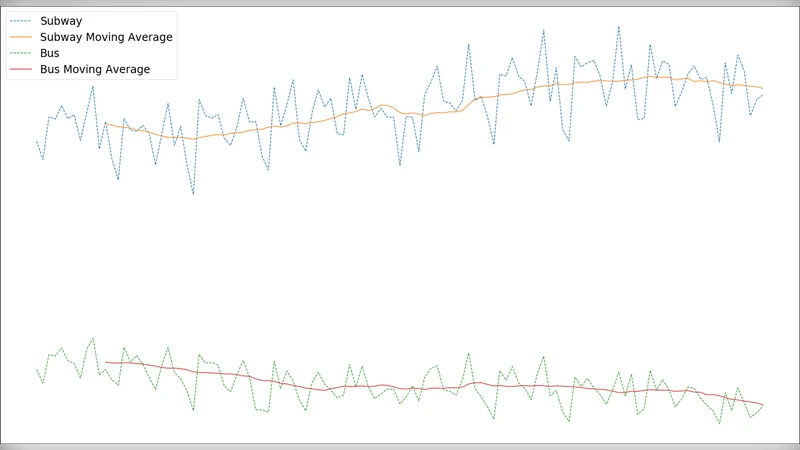
Results show a statistically significant positive coefficient on the “Has Clock” dummy for the G line, corresponding to an estimated increase of roughly 1,783 weekly boardings per station after clock installation. No comparable effect is detected for the E line. In terms of predictive accuracy, the RF‑AdaBoost model outperforms both the DT baseline and the RE panel regression, achieving a lower MSE (≈15 % reduction) and higher R² (0.74 versus 0.68 for RE). This suggests that non‑linear interactions and complex patterns in the data are better captured by the ensemble method.
The authors conclude that real‑time countdown clocks can boost subway usage, at least on the G line, and that machine‑learning techniques provide superior forecasting capability compared with traditional panel regressions. They acknowledge several limitations: the analysis is confined to two lines and a relatively short pre‑/post‑installation window, which may not fully account for seasonal trends; other potential determinants of ridership (fare changes, service disruptions, nearby development) are omitted, raising concerns about omitted‑variable bias; and the causal interpretation relies on the assumption that no concurrent interventions coincided with the clock rollout.
Future work is recommended to expand the dataset across more lines and years, employ difference‑in‑differences or structural equation modeling to strengthen causal claims, and conduct variable‑importance analyses within the machine‑learning framework to identify the most influential factors driving ridership changes. Such extensions would provide transit agencies with more robust evidence for large‑scale investments in passenger information systems.
Comments & Academic Discussion
Loading comments...
Leave a Comment