Detecting overlapping community structure: Estonian network of payments
Revealing the community structure exhibited by real networks is a fundamental phase towards a comprehensive understanding of complex systems beyond the local organization of their components. Community detection techniques help on providing insights into understanding the local organization of the components of networks. In this study we identify and investigate the overlapping community structure of an interesting and unique case of study: the Estonian network of payments. In order to perform the study, we use the Clique Percolation Method and explore statistical distribution functions of the communities, where in most cases we found scale-free properties. In this network the nodes represent Estonian companies and the links represent payments done between the companies. Our study adds to the literature of complex networks by presenting the first overlapping community detection analysis of a country’s network of payments.
💡 Research Summary
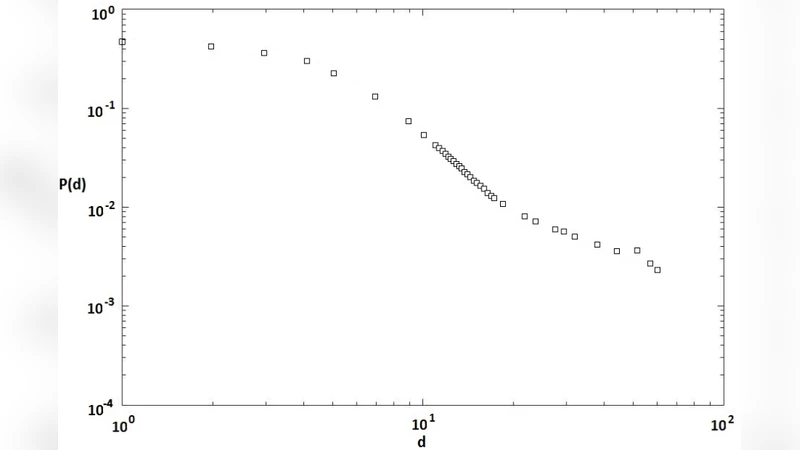
This paper investigates the overlapping community structure of Estonia’s inter‑company payment network using the Clique Percolation Method (CPM). The authors obtain a unique dataset from Swedbank, comprising 16,613 companies and 3.4 million domestic electronic payments recorded between October 2013 and December 2014. By treating each company as a node and establishing an undirected link whenever at least one payment occurs between two firms, they construct a large‑scale economic graph. Basic topological analysis shows that the network is a small‑world system (average shortest path ≈ 7.3, diameter = 29) with a low average clustering coefficient (0.19) and disassortative mixing: high‑degree nodes tend to connect to low‑degree nodes. The degree distribution follows a power‑law with exponent γ≈2.46, confirming scale‑free behavior.
The literature review situates the work within a broad spectrum of economic network studies, highlighting previous applications of community detection to shareholder, investment, and foreign‑exchange networks. The authors argue that most traditional community‑detection algorithms enforce a single‑membership constraint, which is unrealistic for economic systems where firms often belong to multiple functional groups (e.g., supply chains, regional clusters, industry sectors). Consequently, they adopt CPM, which defines a community as a chain of adjacent k‑cliques that share at least k‑1 nodes. CPM naturally captures overlapping structures because a node can belong to several k‑cliques simultaneously.
Parameter selection is a critical step in CPM. The authors explore k values from 3 to 10. As k increases, the number of detected communities declines sharply while the average community size grows, reflecting the well‑known trade‑off between granularity and cohesion. They identify k = 4 as the optimal balance: it yields 25 overlapping communities without producing a single giant component (which would appear for k ≤ 3) and avoids overly fragmented partitions (which emerge for k ≥ 5). Visualizations of the overlapping community graph illustrate both large and small clusters, with node size proportional to community membership and edge thickness indicating the number of shared companies between communities.
The results reveal that most communities exhibit scale‑free size distributions, mirroring the underlying network’s degree distribution. The presence of overlapping communities suggests that many Estonian firms simultaneously participate in multiple economic sub‑networks, reflecting diversified supplier‑customer relationships, regional affiliations, or sectoral ties. The authors discuss several practical implications for the banking sector. First, community membership can enhance targeted marketing: firms within the same community can be grouped for product offers, and the diffusion of adoption can be monitored through intra‑community contagion effects. Second, community labels can serve as informative features in churn prediction models (logistic regression, random forests, neural networks), potentially improving predictive accuracy. Third, overlapping community information can feed product‑affinity and recommender systems, supporting cross‑selling strategies. Finally, the structure can aid in constructing more nuanced customer segmentation schemes, where a firm’s multi‑community affiliations capture its complex economic role.
The paper concludes by emphasizing the novelty of applying overlapping community detection to a national payment network and confirming that the Estonian payments graph exhibits classic complex‑network hallmarks (small‑world, scale‑free, low clustering, disassortativity). Limitations include the exclusive reliance on Swedbank data (covering roughly 80 % of domestic transactions but not the entire economy) and the use of an unweighted graph, which discards transaction volume information. Future work is proposed to incorporate edge weights (transaction amounts), to study temporal evolution of communities, and to compare Estonia’s payment network with those of other countries or sectors, thereby deepening our understanding of dynamic economic networks.
Comments & Academic Discussion
Loading comments...
Leave a Comment