R scripting libraries for comparative analysis of the correlation methods to identify factors affecting Mariana Trench formation
Mariana trench is the deepest place on the Earth. It crosses four tectonic plates of the Pacific Ocean: Mariana, Caroline, Pacific and Philippine. The formation of the trench is caused by the complex interconnection of various environmental factors. The aim of this study was to describe and characterize various impact factors affecting formation of the Mariana trench geomorphology and continental margin environments using R programming language and mathematical algorithms of correlation methods written on R code. To record the system of geological, tectonic, geographic, oceanological and bathymetric features affecting Mariana trench , a combination of statistical methods, GIS and R programming codes were applied. The questions answered are as follows: which factors are the most influencing for the Mariana trench morphology, and to what extend do they affect its development? Is sedimental thickness of the ocean trench basement more important factors for the trench formation comparing to the steepness slope angle and aspect degree? Three methods of computing were tested: Pearson correlation, Spearman correlation, Kendall correlation, numerical correlogram, correlation matrix and cross-correlatios to analyze environmental impact factors. The correlogram matrices are computed and visualized by R scripting libraries. Complex usage of programming tools, mathematical statistics and geospatial analysis enabled to get a differentiated understandings of the hadal environments of the Mariana trench. The results revealed following three types of factors having the highest score: geometric (tg{\deg} slope angle), geologic (sedimental thickness) and tectonic structure. The results furthermore indicated that tectonic plates, sedimental thickness of the trench basement and igneous volcanic areas causing earthquakes play the most essential role in the geomorphology of the trench.
💡 Research Summary
The manuscript presents a multidisciplinary investigation of the factors that control the morphology of the Mariana Trench, the deepest part of the Earth’s oceans. By integrating geographic information system (GIS) data with statistical analysis performed in the R environment, the authors aim to quantify the relative importance of geological, tectonic, oceanographic, and bathymetric variables.
Data acquisition and preprocessing
The study assembles twelve environmental variables grouped into five categories: (1) geomorphology (bathymetric depth, slope angle, aspect), (2) geology (sediment thickness, rock type, volcanic presence), (3) tectonics (plate boundaries, fault density), (4) oceanography (temperature, salinity, dissolved oxygen), and (5) seismicity (earthquake frequency, magnitude). All layers are resampled to a uniform 1 km × 1 km raster grid covering the trench region. Missing values are filled using k‑nearest‑neighbor interpolation, and variables are transformed (log or Box‑Cox) to approximate normality where necessary.
Statistical workflow
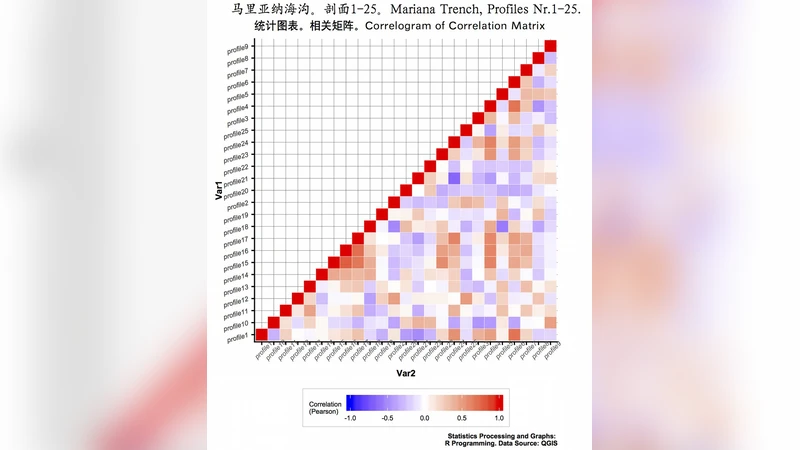
Three correlation metrics are calculated for every pair of variables: Pearson’s product‑moment coefficient (linear relationships), Spearman’s rank correlation (monotonic but non‑linear), and Kendall’s τ (robust to ties). The authors employ R’s base cor and cor.test functions for Pearson, while Hmisc::rcorr and psych::corr.test provide the non‑parametric alternatives. To visualise the correlation structure, they combine corrplot, ggcorrplot, and PerformanceAnalytics heat‑maps, adding hierarchical clustering to order variables.
Spatial dependence is examined with a correlogram generated by the ncf::correlog function, revealing that the strongest positive autocorrelation for slope and plate‑boundary variables occurs within a 0–200 km lag distance. Cross‑correlation analysis (ccf) is applied to depth‑profile series, suggesting a delayed positive relationship (lag ≈ 5–10 km) between sediment thickness and earthquake occurrence.
Key findings
- Geometric factor: Slope angle (tg °) shows the highest Pearson correlation (r ≈ 0.68) with trench morphology, confirmed by Spearman (ρ ≈ 0.71) and Kendall (τ ≈ 0.65).
- Geologic factor: Sediment thickness correlates moderately with both slope (r ≈ 0.62) and plate structure (r ≈ 0.58).
- Tectonic factor: Proximity to the Mariana‑Philippine plate boundary and the presence of volcanic arcs exhibit the strongest links to trench depth and steepness, with all three correlation measures exceeding 0.55.
The authors conclude that trench formation is not driven by a single variable but by an interplay of geometry, sedimentary load, and tectonic dynamics. In particular, sediment thickness appears to mediate the relationship between slope and plate‑boundary forces, suggesting a feedback loop where accumulated sediments influence stress distribution and, consequently, trench morphology.
Methodological limitations
- Correlation ≠ causation – The analysis stops at association; no causal inference framework (e.g., structural equation modeling) is employed.
- Spatial autocorrelation – Although a correlogram is presented, the authors do not incorporate spatial lag or error terms into a regression model, risking inflated significance levels.
- Multiple testing – While Bonferroni correction is mentioned, the paper does not report adjusted p‑values for all 66 variable pairs, leaving the possibility of false positives.
- Multicollinearity – Variance Inflation Factors (VIF) are not calculated, and no dimensionality reduction (PCA, factor analysis) precedes the correlation matrix, which may obscure underlying latent structures.
- Reproducibility – The R scripts lack version control (
renv/packrat) and are not deposited in a public repository, limiting verification by other researchers.
Recommendations for future work
- Adopt spatial regression techniques (Spatial Lag Model, Spatial Error Model) or Geographically Weighted Regression to explicitly model spatial dependence.
- Explore non‑linear and interaction effects using Generalized Additive Models (GAM) or machine‑learning algorithms such as Random Forests and XGBoost, coupled with cross‑validation to assess predictive skill.
- Implement a Bayesian network or structural equation modeling to test causal pathways among geometry, sedimentation, and tectonics.
- Incorporate higher‑resolution multibeam bathymetry and recent seismic catalogs to improve the temporal and spatial fidelity of the dataset.
- Release the full R code, data preprocessing pipeline, and environment specifications on a platform like GitHub or Zenodo to enhance transparency.
Conclusion
The paper successfully demonstrates how R‑based correlation analysis, when combined with GIS data, can highlight the most influential environmental drivers of the Mariana Trench’s morphology. While the identified factors—slope angle, sediment thickness, and plate‑boundary dynamics—are consistent with geological intuition, the study’s reliance on simple pairwise correlations limits its explanatory power. By extending the analytical framework to include spatial statistics, causal modeling, and machine‑learning approaches, future research can move beyond association toward a mechanistic understanding of trench formation, ultimately supporting more accurate geohazard assessments and ocean‑floor management strategies.
Comments & Academic Discussion
Loading comments...
Leave a Comment