Topological Data Analysis of Single-cell Hi-C Contact Maps
In this article, we show how the recent statistical techniques developed in Topological Data Analysis for the Mapper algorithm can be extended and leveraged to formally define and statistically quantify the presence of topological structures coming from biological phenomena in datasets of CCC contact maps.
💡 Research Summary
The paper presents a novel analytical pipeline that combines recent advances in Topological Data Analysis (TDA) with statistical techniques to rigorously detect and quantify topological structures in single‑cell Hi‑C contact maps. After a concise introduction to chromosome conformation capture (CCC) technologies and the specific challenges of Hi‑C data (high dimensionality, sparsity, and systematic biases), the authors focus on the stratum‑adjusted correlation coefficient (SCC). SCC groups matrix entries by genomic distance, computes a weighted average of Pearson correlations within each stratum, and yields a single similarity score that can be used as a distance metric between contact maps.
Using SCC‑derived distances, the authors construct a Mapper simplicial complex. The Mapper requires a filter (or lens) function; here the authors employ a one‑dimensional embedding of the SCC distance matrix (e.g., the first principal component) as the filter. The image of the filter is covered by overlapping hypercubes, each pre‑image is clustered via single‑linkage with a scale parameter δ, and the nerve of the resulting cover produces the Mapper. The Mapper approximates the Reeb space of the underlying data, and the paper cites convergence results that guarantee this approximation under suitable choices of δ and cover resolution.
To endow the Mapper with statistical confidence, the authors turn to extended persistence diagrams. Each node of the Mapper is assigned a scalar function, and the diagram records birth–death pairs of topological features (connected components, cycles, etc.). The Bottleneck distance provides a metric between diagrams, enabling a bootstrap procedure: repeatedly resample the point cloud, recompute the Mapper and its diagram, and calculate the Bottleneck distance to the original diagram. The empirical distribution of these distances yields confidence intervals for each persistence point. Features whose confidence boxes do not intersect the diagonal are declared statistically significant, i.e., they persist in the limiting Reeb space with a prescribed confidence level.
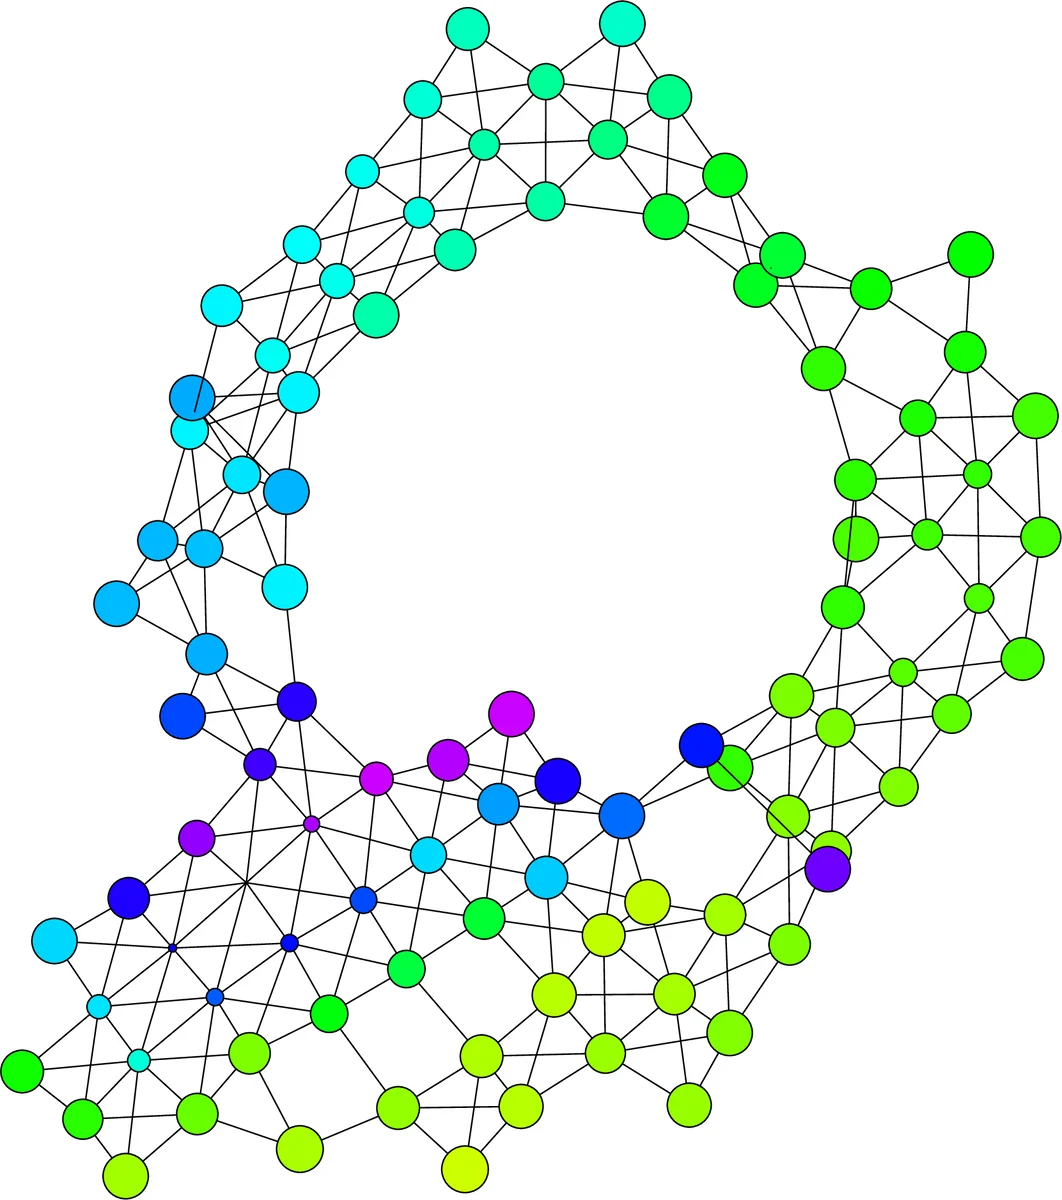
The methodology is applied to a recent single‑cell Hi‑C dataset (Nagano et al., 2017). After preprocessing the contact matrices, pairwise SCC distances are computed, and a one‑dimensional filter is derived. The resulting Mapper exhibits a clear one‑dimensional loop. Bootstrap analysis shows that the dominant persistence points of this loop lie well above the diagonal with >95 % confidence, confirming the presence of a circular topological signature. When cells are colored by their known cell‑cycle phase, the loop aligns with the progression G1 → S → G2/M → G1, providing a biologically meaningful validation of the topological signal.
In summary, the paper makes three key contributions: (1) introduction of SCC as an effective similarity measure for Hi‑C contact maps; (2) integration of Mapper and extended persistence diagrams to extract and visualize intrinsic topological features; (3) a bootstrap‑based statistical framework that yields rigorous confidence statements about those features. The approach is computationally tractable, statistically sound, and broadly applicable to other high‑dimensional genomic contact data, offering a powerful new lens for interpreting the three‑dimensional organization of the genome.
Comments & Academic Discussion
Loading comments...
Leave a Comment