Calibration of a Density-based Model of Urban Morphogenesis
We study a stochastic model of urban growth generating spatial distributions of population densities at an intermediate mesoscopic scale. The model is based on the antagonist interplay between the two opposite abstract processes of aggregation (preferential attachment) and diffusion (urban sprawl). Introducing indicators to quantify precisely urban form, the model is first statistically validated and intensively explored to understand its complex behavior across the parameter space. We then compute real morphological measures on local areas of size 50km covering all European Union, and show that the model can reproduce most of existing urban morphologies in Europe. It implies that the morphological dimension of urban growth processes at this scale are sufficiently captured by the two abstract processes of aggregation and diffusion.
💡 Research Summary
The paper presents a stochastic, density‑based model of urban morphogenesis that operates at a mesoscopic scale (≈50 km). The model abstracts urban growth into two antagonistic processes: aggregation, implemented as preferential attachment of new population units to already populated cells, and diffusion, representing urban sprawl through a fraction of the population moving to the eight nearest neighbours. The model’s parameters are: total population Pₘ (10⁴–10⁶), macro‑scale growth rate N_G (500–30 000), aggregation strength α (0.1–4), diffusion strength β (0–0.5) and the number of diffusion steps n_d (1–5). At each iteration the total population is increased by N_G, each new unit is assigned to a cell with probability proportional to (P_i/P)^α, and then a fraction β of the population is redistributed equally among the eight neighbours, repeated n_d times. The simulation stops when the total population reaches Pₘ.
To compare simulated patterns with reality, the authors define four morphological indicators based solely on population density: (1) rank‑size slope γ, obtained by fitting a power‑law to the sorted population distribution; (2) entropy E, measuring the uniformity of the distribution; (3) Moran’s I, a spatial autocorrelation index using inverse distance weights; and (4) mean inter‑individual distance (\bar d), a normalized average distance between all pairs of individuals. These indicators capture hierarchy, concentration, spatial clustering and overall dispersion.
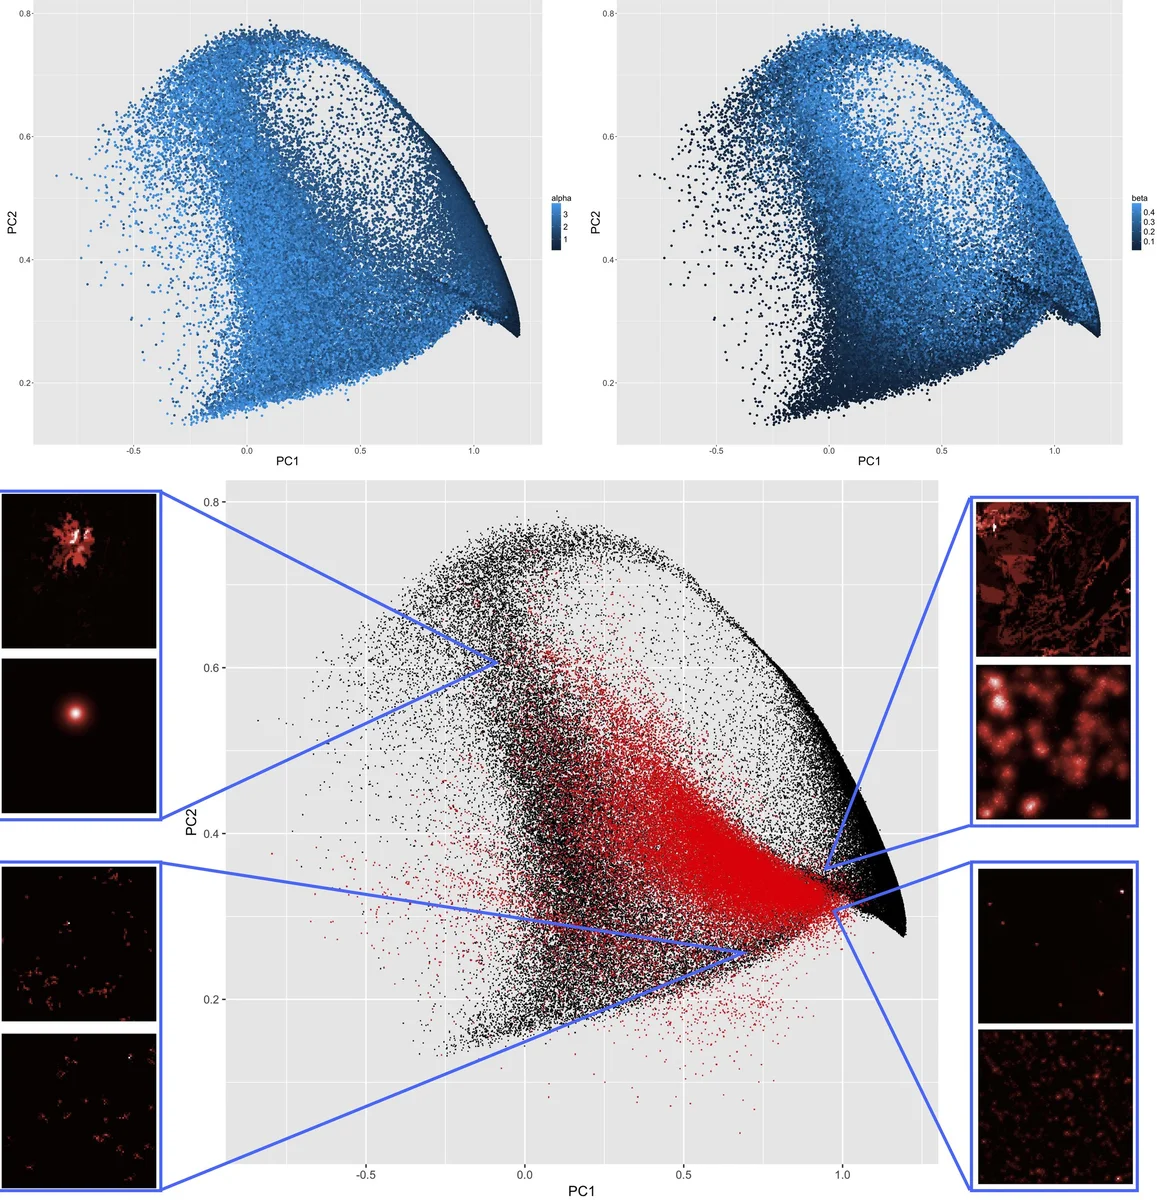
Real‑world data are taken from Eurostat’s 100 m resolution population raster for the entire European Union. The raster is aggregated to 500 m resolution and analysed in overlapping 50 km square windows shifted by 10 km, yielding a dense spatial field of the four indicators. Visualisation for France shows high Moran values and low entropy in metropolitan areas, while rural regions display lower hierarchy and more uniform distances. An unsupervised k‑means clustering (k = 5) combined with a principal component analysis reveals five distinct morphological regimes: metropolitan, mountainous, northern rural, southern rural, and a mixed central zone.
The model is implemented both in NetLogo (for interactive exploration) and in Scala (for high‑performance computing via OpenMole). A systematic exploration of the parameter space is performed on a sparse grid of 81 points, each replicated 100 times to assess stochastic variability and convergence. The results confirm that increasing α leads to higher Moran’s I and lower entropy (more compact, hierarchical cities), whereas larger β and n_d produce higher mean distances and flatter rank‑size slopes (more dispersed, sprawl‑like configurations). The ratio Pₘ/N_G emerges as a key determinant of the final density pattern, effectively controlling the overall intensity of aggregation versus diffusion.
Calibration is achieved by minimizing the Euclidean distance between the simulated indicator vector and the empirical vector for each observed window. The optimization identifies parameter sets that reproduce the five empirical clusters with high fidelity, demonstrating that the simple aggregation‑diffusion framework can generate the full spectrum of European urban forms. The authors argue that, at the mesoscopic scale, these two abstract processes are sufficient to capture the morphological dimension of urban growth, without explicitly modelling economic, transport or policy variables.
All code, simulation outputs, and the processed empirical indicator dataset are publicly released (GitHub and Dataverse links provided), ensuring reproducibility. The paper concludes by suggesting extensions such as integrating additional socio‑economic layers, testing policy interventions, and applying the framework to other continents or to temporal dynamics of urban change.
Comments & Academic Discussion
Loading comments...
Leave a Comment