Reinforcement Learning Based Speech Enhancement for Robust Speech Recognition
Conventional deep neural network (DNN)-based speech enhancement (SE) approaches aim to minimize the mean square error (MSE) between enhanced speech and clean reference. The MSE-optimized model may not directly improve the performance of an automatic …
Authors: Yih-Liang Shen, Chao-Yuan Huang, Syu-Siang Wang
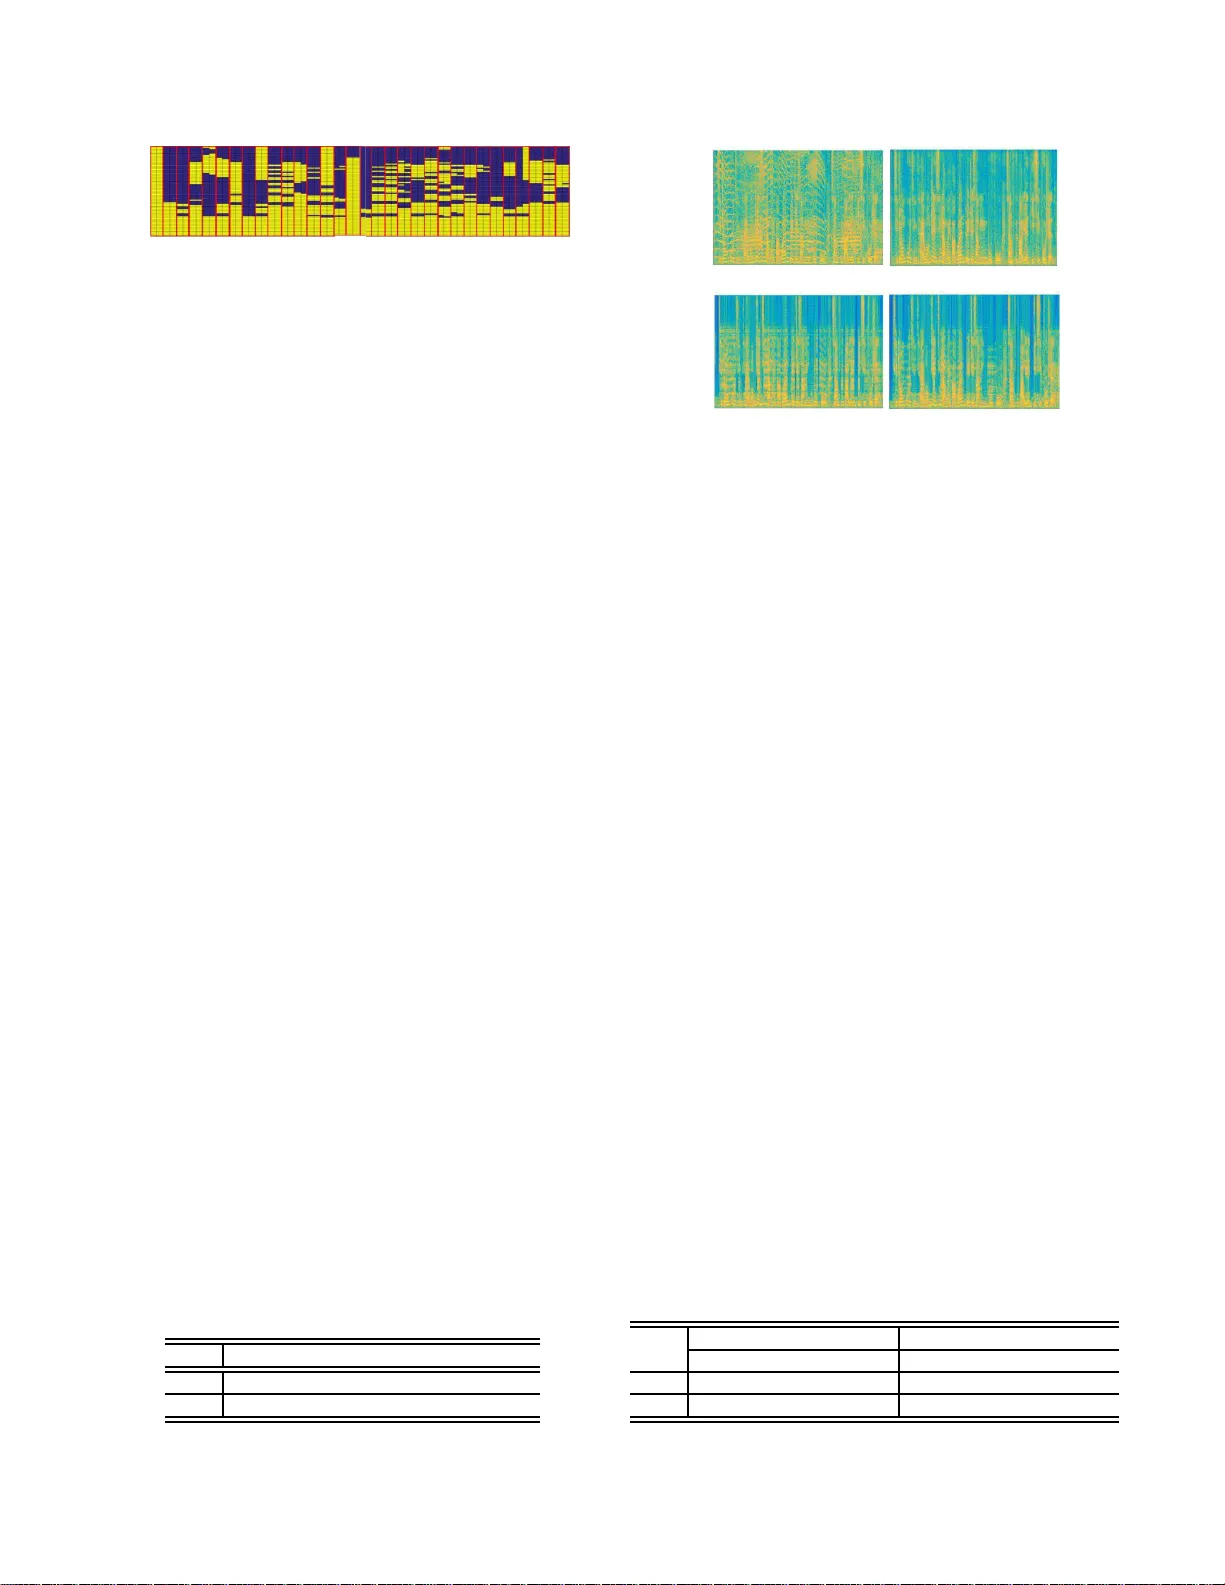
REINFORCEMENT LEARNING B ASED SPEECH ENHANCEMENT FOR R OBUST SPEE CH RECOGNITION Y ih-Liang Shen 1 , C hao-Y uan Huang 1 , Syu-Siang W ang 2 , Y u Tsao 3 , Hs i n-Min W ang 4 and T ai-Shih Chi 1 1 Department of Electrical and Computer Engineering, Nation al Chiao Tung Univ ersity , Hsinchu, R.O.C 2 Joint Research Center for AI T echnology and Al l V i sta Healthcare, MOST , T aipei, R.O.C 3 Research Center for Information T echnology Innovation, Academia Sinica, T aipei, R.O.C 4 Institute of Informatio n Science, Academia Sinica, T aipei, R.O.C ABSTRA CT Con ventional deep neural network (DNN)-based speech enhan ce- ment (SE) approaches aim to minimize the mean square error (MSE) between enhanced speech and clean reference. The MSE-optimized model may no t directly improv e the performance o f an automatic speech recognition (ASR) system. If t he target is to minimize the recognition error , the recognition results sh ould be u sed t o design the objectiv e function for optimizing the SE model. Ho wev er, the structure of an ASR system, which consists of multiple units, such as acoustic and language mo dels, is u sually comp lex and not dif- ferentiable. In this study , we proposed t o adopt the reinforcement learning algorithm to optimize the SE model based on the recog- nition results. W e ev aluated the propsoed SE system on t he Man- darin Chinese broadcast news corpus (MA TBN). Experimental re- sults demonstrate that the proposed method can effecti vely improv e the ASR results wit h a notable 12 . 40% and 19 . 23% error rate reduc- tions for signal to noise ratio at 0 dB and 5 dB conditions, respec- tiv ely . Index T erms — reinforcement learning, automatic speech recognition, speech enhancement, deep neural network, character error rate 1. INTRODUCTION The performance of automatic speech recognition (ASR) has signif- icantly improv ed i n recent years. Howe ver , a long-existing issue still remains: ASR suf fers sev ere performance degrad ation in noise en vi- ronments [1]. Many approaches hav e been proposed to address the noise i ssue. One category of these approaches i s speech enhance- ment (SE) [ 2, 3]. The goal of SE is to generate enhanced speech signals that closly match clean and undistorted speech signals, by removing the noise components from the noisy speech [4, 5, 6]. Tra- ditional SE approach es are designed based on some assumptions of speech and noise characteristics [7, 8]. Generally , these approaches can yield a satisfactory performance in terms of speech quality but may not be directly beneficial in the improveme nt of the ASR per- formance [9, 5]. Recently , deep-learning-based SE approaches have receive d in- creased attention and it has been confirmed that they yield better per- formances than traditional methods in many tasks [10, 11, 12]. Be- cause of the deep structure, the deep-learning-based models can ef- fectiv ely characterize the complex transformation of noisy speech to clean speech, or they can precisely estimate a mask to filter out noise componen ts from the noisy speech. T o train the deep-learning-based models, the mean square error (MSE)-criterion is usually used as the objecti ve function. Specifically , the model is trained t o minimize the MSE of the enhanced speech and clean references. Although it has been prov en that the MS E -based objectiv e function is effecti ve for noise reduction, it is not optimal for improving speech quality and intelligibility , or the ASR performance [13, 14, 15, 16]. Clearly , the ASR re sults should be the optimal objective function for SE. Howe ver , most of the commonly used ASR systems con- sist of multiple modules, such as the acoustic models and language models. Correspondingly , the input–output correlation is extremely complicated and may not be differentiable. Thus, it is difficult to directly use the recognition results to directly optimize the SE mod- els. Moreov er , it takes a considerable amount of resources to build an ASR system, and thus t he use of a well-established AS R sys- tem from a third party is thus fav orable. In this study , we propose to adopt the reinforcement learning (RL) algorithm to train an SE model to minimize the recognition errors. The main concept of the RL algorithm is to take an action in an en vironment i n order t o maximize some notion of a cumulativ e rew ard [17 ] . Different from supervised and unsupervised learning algorithms, the RL algorithm learns ho w to attain a (complex ) goal in an iterative manner . T o-this-date, the RL algorithms have been successfully applied to various tasks, such as robot control [18], di- alogue management [19], and computer game playing [20]. The RL algorithm has also been adopted i nto the speech signal processing filed. In [21], t he RL has been used to improve the AS R performance. Based on hypothesis selection by the users, t he sys- tem can improv e the recognition accuracy as compared to unsuper- vised adaptation. Meanwhile, t he RL has been used f or DNN-based source enhancement by optimizing objective sound quality assess- ment score [22] . The results sho w that by using the RL algorithm, both perceptual e valu ation of the speech quality (PE SQ) [23] and the short-time intelligibility measure (STOI) [24] scores can be im- prov ed as compared to the MSE -based training criterion [25]. In this study , we adopt t he same idea presented in [22] to es- tablish an RL-based SE system to optimize the ASR performance. Instead of estimating t he ratio masking as used in [22], t he pro- posed SE system determines the optimal binary mask to minimize the recognition errors. Notably , the ASR system is fixed in the pro- posed method. This is to simulate most realistic scenarios that a well-trained ASR system i s provided by a third party , and an SE i s built t o generate suitable inputs to the ASR system. W e ev aluated the proposed RL-based SE system on a Mandarin Chinese broad- cast news corpus (MA TBN) [26]. According to our experimental results, the proposed RL-based SE system effecti vely decreases the character error rate (CER) during the testing of the recognition in the presence of noise. The remainder of this paper i s organized as follo ws. Section 2 rev iew relativ e techniques. Section 3 introduces the proposed system. Section 4 presents t he experimental setup and results. Finally , section 5 provide s conclusion remarks. 2. RELA TED WORKS In the time domain, a noisy speech signal y is formulated by a com- bination of a clean speech signal s and an additi ve noise signal n . By performing short-time Fourier transform (STFT), log–po wer opera- tion, and mel–frequenc y-based filteri ng, the mel–frequenc y power spectrogram (MPS) of y can be expressed as: Y = S + N . (1) In this study , p frames of the STFT MPS feature vecto rs are concate- nated to form one chunk vector for Y , S and N . Accordin gly , we thus hav e: ˆ X c = [ X ⊤ cp , X ⊤ cp +1 , · · · , X ⊤ ( c +1) p − 1 ] ⊤ , X ∈ { Y , S , N } , (2) where c = { 0 , 1 , · · · , C } is a chunk inde x, and C is the total number of chunks vectors within X . Note that when p = 1 , the chunk vector is the STFT MPS feature vector . 2.1. Ideal Binary Mask-b ased SE System It has been reported that when the goal i s to improv e the ASR per- formance, ideal binary mask (IBM) is more suitable than ideal ratio mask (I RM) or directly mapping [ 27 ] t o be used to design t he S E system. T herefore, we implement an IBM-based S E system in this study . For the IBM-based SE system, the input ˆ Y was fi ltered by IBM to obtain the enhanced output ˆ S ′ : ˆ S ′ = ˆ Y . × ˆ B , (3) where “ . × ” r epresents an element-wise multiplier, and ˆ B is the IBM matrix, which is defined as: ˆ B = 1 { log ( ˆ S ) − log ( ˆ N ) } , (4) where 1 {·} is the unit step function applied t o each element of ˆ B . 2.2. DNN-based SE Model with the MSE Criterion For the DNN-based SE, a set of noisy-clean training pairs are pre- pared as the i nput and reference of a DNN model. For the noisy ˆ Y , F chunk vectors are then cascaded to include more context informa- tion: ˜ Y c = [ ˆ Y ⊤ c − F +1 , ˆ Y ⊤ c − F +2 , · · · , ˆ Y ⊤ c ] ⊤ . The mapping process of a feedforward DNN with L hidden layers is the formulated as, h 1 ( ˜ Y c ) = σ { W 1 log ( ˜ Y c ) + b 1 } , . . . h ℓ ( ˜ Y c ) = σ { W ℓ h ℓ − 1 ( ˜ Y c ) + b ℓ } , . . . h L ( ˜ Y c ) = σ { W L h L − 1 ( ˜ Y c ) + b L } , ˆ S ′′ c = σ 1 { W L +1 h L ( ˜ Y c ) + b L +1 } , (5) where W ℓ and b ℓ are t he weight matrices and bias vectors,respecti vely . Both σ {·} and σ {·} are activ ation functions, in which σ {·} is the sigmoid function while σ 1 {·} represents a l inear transformation. When t he MSE i s used as the cost function, the parameter set Θ t hat consists of all of W ℓ and b ℓ in Eq. (5) is estimated by , Θ ∗ = arg min Θ ( 1 C P C c =1 k log ( ˆ S c ) − log ( ˆ S ′′ c ) k 2 2 ) (6) k-means clustering DNN re-trained B ෩ Y G DNN pre-trained ASR IBM clustering Action estimation Target action determination Action update IBM-SE Fig. 1 . The block diagram of the proposed SE system, which in- cludes “ IBM clustering ”, “ Action estimation ”, and “ T ar get action determination ”. 3. PROPOSED METHOD Figure 1 i llustrates the proposed system, which consists of three modules: “ IBM clustering ”, “ Action estimation ”, and “ T ar get action determination ”. 3.1. IBM clusterin g module In t he IBM-based SE system, an IBM filter is computed for each feature vector . The IBM clustering module groups the entire set of IBM vectors ˆ B collected from the training data to A clusters based on the K-means algorithm. Each cluster is represented as ˆ g a with respect to the cluster index a . The ensemble of these clusters i s denoted as ˆ G . T hus, we hav e, ˆ G = [ ˆ g 1 , · · · , ˆ g a , · · · , ˆ g A ] . (7) Since the elements in each IBM vector acquire binary values, the Hamming distance [28] is used to compute the distance between the two vectors in this study . Meanwhile, we used 32 clusters ( A = 32) to group ˆ B based on the k-means algorithm. 3.2. Action estimation module T o effecti vely use the training data, we first pre-train the DNN model by placing ˜ Y c at the input and ˆ B c at the output. This pre-trained model was then re-tr ained wit h additional hidden layers to compute the A -dimensional action vector a ′′ c at c th chunk. Among the A elements in a ′′ c , the index with the maximum value was determined, a c = arg max a ∈ A [ a ′′ c ] a , (8) where [ · ] a represents t he a th element of the vector , and A = { 1 , 2 , · · · , A } . In addition, different from the spectral mapping in E q. (5), the softmax operation i s used in the final layer in the re-trained DNN. The cost function for the re-tr ai ning process is express ed as, Θ ∗ = arg min Θ ( 1 C P C c =1 k a c − a ′′ c ) k 2 2 ) , (9) where a c is the reference target, which is deriv ed from T ar get action determination module and is described in the next section. 3.3. T arget action determination module Figure 2 sho ws the flowchart of the T ar get action determination module. First, a ′′ c , which is estimated from the action estimati on module i s used to determine the cluster index a c in E q. ( 8). Then, the IBM selection function selects g a from ˆ G with respect to index G IBM selection SE Action update ASR Updated action vector Input action vector, a c ᇱᇱ ෩ Y IBM-SE Fig. 2 . T he flowch art of T ar get action determination module, which is used to update the input action vector . a = a c . Next t he SE function uses the selected g a to enhance the input ˜ Y c . After enhancing all C chunk vectors, both the input noisy and the IBM-enhanced STFT –MPS features are reconstructed back to t he time domain signals, and then provide t he AS R to calculate the utterance-based error rates (E Rs), z y and z s ′ , respectiv ely . Both z y and z s ′ are used in the T arg et action determination function, which is a two-stage operations, namely , the reward calculation and action update. 3.3.1. Rewar d calculation Rather than directly use z s ′ as the rew ard, we applied the rel ative v alue between z y and z s ′ in Eq. ( 10) t o avoid external factors, such as the v ariation of an ASR system and en vironmental noises. R = tanh { α ( z y − z s ′ ) } , (10) where α > 0 is a scalar factor , which is set to 10 in this study . For this equation, the positi ve R denotes a larger ER of z y than that of z s ′ , thus suggesting that the enhanced speech can provid e bet- ter recognition results. On the other hand, a negativ e R denotes a smaller z y than z s ′ , suggesting that the enhanced speech giv es worse recognition performance. In addition to the utterance-based reward s R , we also consider a chunk-based rew ard because the action for each chunk vector may act and contribute differently to z s ′ . That is, an effecti ve en- hancement can cause positiv e contribution on the ASR performance. Therefore, we defined a time-varied re ward r c as: ˆ E c = ( log ( ˆ S c ) − log ( ˆ S ′ c )) ⊤ ( log ( ˆ S c ) − log ( ˆ S ′ c )) , (11) ˜ E c = ˆ E c max 0 ≤ c ≤ C − 1 ( ˆ E c ) , (12) r c = ( (1 − ˜ E c ) R, R > 0 , ˜ E c R, R ≤ 0 . (13) From Eqs. (11)– (13), t he weighting factor ˜ E c , 0 ≤ ˜ E c ≤ 1 , at the c th chunk is t he normalized square error . When selecting a erroneous IBM vector , the normalized error ˜ E c in(12) is large, and accordingly r c is small, which penalizes this wrong action, as t o be introduced in the next sub-section. 3.3.2. Action update T o update the action vector , a ′′ c , we first determine two different ac- tion indices, a ˆ B c and a c . T o obtain a ˆ B c , we first follow E q. (4) to determine an IBM vector , which is then used to locate the closest cluster in ˆ G ; the located cluster index is a ˆ B c . On the other hand, the cluster index a c is determined by Eq. (8), as presented in the Acti on estimation module. DNN IBM-SE ASR Action estimation Target action determination Noisy speech ෩ X Recognition results Fig. 3 . The block diagram of testing part for the proposed algorithm. W ith the determined action indices a ˆ B c and a c , the i nput ac- tion vector a ′′ c is updated for the output a c based on the following equations: [ a c ] a c = r c + m a x a c ∈ A [ a ′′ c ] a c , R > 0 , [ a ′′ c ] a c , R = 0 , (14) and [ a c ] a ˆ B c = [ a ′′ c ] a ˆ B c − r c , R < 0 . (15) 3.4. T estin g proce dure After performing the training on DNN wit h the associated objecti ve function in Eq. (9), Fig. 3 illustrates t he block diagram of the testi ng process. From the figure, the well-t r ained DNN model is applied on a noisy STFT –MPS ˆ X , which is first extracted from the time-domain signal x . T he estimated IB M indices are then used in combination with Eq. (8) for each chunk to further enhance the input noisy and provid e ˆ S x in the output of the IBM–SE function. The wav eform s ′ x is reconstructed from ˆ S x , and is then applied to ASR to conduct the recognized process. 4. EXPE RIMENTS 4.1. Experimental setup W e conducted our experiments on the MA TBN task, which was an 198-hour Mandarin Chinese broadcast news corpus [ 26]. T he utter- ances in MA TBN were originally recorded at a 44.1 kHz sampling rate and were further down-sampled to 16 kHz. A 25-hour gender- balanced subset of t he speech utterances was used t o train aset of CD-DNN-HMM acoustic models. A set of trigram languag e models was trained on a collection of text ne ws documents published by the Central News Agency (CNA) between 2000 and 2001 (the Chinese Gigaw ord Corpus released by LDC) with the SRI Language Model- ing T oolkit [29]. The overall A S R system was implemented on the Kaldi [30] toolbox. Each speech wavefo rm was parameterized into a sequence of 40-dimensional filter-bank features. The DNN struc- ture for the acoustic models was consisted of six hidden layers, and each layer had 2048 nodes. The dimensions for the input and output layers were 440 ( 40 × (2 × 5 + 1) ) and 2596, respectiv ely [31]. The e valua ted results are reported as the averag e CER. T o train the RL– SE system, another 460 utterances were selected from the MA TBN corpus. The ov erall RL–SE and ASR systems were ev aluated using another 30 utterances fr om the MA TBN testing set. In this study , we used the baby-cry noise as the background noise. The baby-cry noise wav eform was divided into two parts, t he first part was arti fi- cially added t o the 460 training utterances with signal-to-noise ratio (SNR) lev el at 5 dB; the second part was artificially added to the 30 testing utterances at 0 and 5 dB SNR le vels. Notably , t he training and testing utterances were simulated using different segments of the noise source wave form, and thus the properties were slightly dif- ferent. Finally , we have prepared 460 noisy–clean pairs to tr ain the RL-based SE system. For all of t he training and testing data, the ap- plied f r ame size and the shift for STFT were 32 and 16 ms in length, respecti vely . The 64-dimensional MPS features were then extracted from all noisy and clean utterances. Next, we established two RL- based SE models, with two dif ferent parameters p for the chunk vec- tors: the systems with p = 1 and p = 2 are termed R LS E 1 and IBM index 1 10 20 30 20 40 60 (a ) No isy (c ) Clea n (b ) En h a n c e d Fre q u e n c y ( k H z ti m e ( ti m e ( Fig. 4 . Clustered IBMs were deri ved by the k-means algorithm. RLS E 2 , respectiv ely . Both R LS E 1 and RLS E 2 were composed of one hidden layer with 64 nodes, and 32 for the output nodes. The input dimensions of R LS E 1 was 704 ( 64 × 1 × 11 ), and that of RLS E 2 was 640 ( 64 × 2 × 5 ), in which the 11 and 5 are v alues of the parameter F , and is used f or providing the context information (as mentioned in Section 2.2). 4.2. Experimental results Figure. 4 shows all the 32 IBM vectors, each wi th 64-dimensions. The IBM i n Eq. (7 ) used in the RLS E 2 system. Bright yellow el- ements in the figure denote ones (i n terms of their binary values) and the blue elements denote zeros. From t he figure, we observe that low-dimen sional MPS features are dominated by speech com- ponents. One possible explanation is that the noise signals did not mask the human speech i n the low-freque ncy regions. In addition, the entire first column consisted of ones, thus suggesting that t he silence frames were also contained in t he baby-cry noise. W e then compared the av eraged CER results of the RLS E 1 and RLS E 2 systems, and the corresponding results are listed in T able 1. The unprocessed noisy speech was also recognized by an ASR system, and the corresponding results are denoted as “Noisy”. T o test the effecti veness of RL learning, we designed another set of experimen ts: the same 32 IBM vectors were used, while the one- nearest-neighbo r ( 1 nnS E ) method was used to determine the I BM vector for enhanceme nt. The enhanced speech was then recognized by the same ASR system; the corresponding results were denoted as 1 nnS E in T able 1. When the recognition was tested using the original clean t esting utterances, the CER was 11 . 50% . Ho wev er, as sho wn in T able 1, when there was noise inv olved in the background, the CER was dropped considerably to 56 . 14% and 81 . 40% , r espectively , for 5 dB and 0 dB SNR lev els. W e t hen noted that 1 nnS E could not provide any improvemen ts over Noisy , thus showing that the one-nearest- neighbor method could not select the optimal IBM vectors for SE to improv e the ASR performance. Furthermore, both RLS E 1 and RLS E 2 provid ed better recognition results than those of Noisy and 1 nnS E , and RLS E 2 outperformed R LS E 1 . The relati ve CER reductions of RLS E 2 ov er Noisy are 12 . 40% (from 56 . 14% to 49 . 18% ) at the 5 dB S NR lev el, and 19 . 23% ( from 81 . 40% to 65 . 75% ) for the 0 dB S NR level. The results in T able 1 clearly demonstrate the ef fectiv eness of RL-based SE for improving ASR performance in the presence of noise. T o visually analyze the effect of the derived RL-based SE sys- tem, we presented the spectrograms of one noisy utterance at the 5 T able 1 . The ave rage CERs of Noisy (the baseline), 1 nnS E , RLS E 1 , and RLS E 2 at 0 and 5 dB SNR conditions. SNR Noisy 1 nnS E RLS E 1 RLS E 2 5 dB 5 6.14 73.09 55.60 49.18 0 dB 8 1.40 85.79 77.20 65.75 Frequency ( kHz ) 8 4 (b) Clean (a) Noisy 0 time ( s ) 1 3 5 (d) RLSE 2 (c) RLSE 1 time ( s ) 1 3 5 1 3 5 1 3 5 Frequency ( kHz ) 8 4 0 Fig. 5 . The spectrograms of (a) Noisy speech, (b) clean speech, (c) enhanced speech by RLS E 1 , and (d) enhanced speech by RLS E 2 . dB S NR lev el (as shown in Fig. 5 (a)), as well as its clean and en- hanced versions by R LS E 1 and R LS E 2 (as sho wn in Fig. 5 (b), (c), and (d), respectiv ely). From the fi gure, noise components of noisy datasets were effecti vely remov ed by RLS E 1 and R LS E 2 , thus sho wing that despite the fact that the goal was to improve the ASR performance, the RL-based SE also performed denoising on the input speech. Recent studies hav e reported a positive correlation between ob- jectiv e intelligibili t y scores and ASR performance [27, 32]. In T able 2, we show the STOI and PE SQ scores of enhanced speech pro- cessed by RLS E 1 and RLS E 2 at SNR lev els of0 and 5 dB. T he results of the unprocessed noisy speech, sho wn as Noisy , are also listed for comparison. From this table, we sho w that both R LS E 1 and RLS E 2 elicit higher STOI scores than Noisy and RLS E 2 pro- vides again clear improve ments ov er RLS E 1 . From T ables 1 and 2, we can clearly note positiv e correlations between the STOI scores and ASR performances. As for the P E SQ scores, RLS E 2 outper- formed Noisy but R LS E 1 slightly underperformed Noisy . It can be noted that the correlation of the PESQ scores with ASR results is not as strong as that of the S TOI scores and t he ASR results. 5. CONCLUS ION In this study , we present an RL -based SE for robust speech recog- nition without r et r aining the ASR system. By using the recognition errors as the objectiv e function, the RL-based SE can effecti vely re- duce CERs by 12 . 40% and 19 . 23% at 5 and 0 dB SNR conditions, respecti vely . W e also noted that although the objective is to improv e ASR performance, the enhanced speech presented denoised prop- erties and was with improv ed STOI scores. This study serves as a pioneering work for building an SE system w i th the aim to directly improv e ASR performance. The designed scenario is practical in many r eal-world applications where an ASR engine is supplied by a t hird-party . In the future work, more noise types and SNR lev els will be considered to build the RL-based SE system. T able 2 . The S TOI and PE SQ scores of R LS E 1 , R LS E 2 , and Noisy at 0 and 5 dB S N R conditions. SNR STOI PESQ Noisy R LS E 1 RLS E 2 Noisy R LS E 1 RLS E 2 5 dB 0.82 0.82 0.86 1.85 1.67 1.96 0 dB 0.74 0.77 0.81 1.45 1.42 1.59 6. REFE RENCES [1] J. Li , L . Deng, R. Haeb-Umbach, and Y . Gong, R obus t Auto- matic Speech Recognition: A Bridge to Practical Applications . Academic Press, 2015. [2] B. Li, Y . Tsao, and K. C. Sim, “ An i n vestigation of spectral restoration algorithms for deep neural networks based noise ro- bust speech recognition., ” in Proc. INTER SPEECH , pp. 3002– 3006, 2013. [3] Z. -Q. W ang and D. W ang, “ A joint training framewo rk for ro- bust automatic speech recognition, ” IEEE/ACM Tr ansactions on Audio, Speech, and Languag e Proc essing , vol. 24, no. 4, pp. 796–806 , 2016. [4] A. Acero and R. M. St ern, “En vironmental robustness in au- tomatic speech recognition, ” in Proc. ICASSP , pp. 849–852, 1990. [5] H.-J. Hsi eh, B. Chen, and J.-w . Hung, “Employing median fil- tering to enhance the complex -valued acoustic spectrograms in modulation domain for noise-robust speech recognition, ” in Pr oc. ISCSLP , pp. 1–5, 2016. [6] H. Zhang, X. Zhang, and G. Gao, “T raining supervised speech separation system to i mprov e stoi and pesq directly , ” in Pro c. ICASSP , pp. 5374–537 8, 2018. [7] I. Cohen and B. Berdugo, “Noise estimation by minima con- trolled recursiv e averaging for robu st speech enhancement, ” IEEE signal pr ocessing letters , vol. 9, no. 1, pp. 12–15 , 2002. [8] R. McAulay and M. Malpass, “Spee ch enhancem ent using a soft-decision noise suppression filt er , ” IE E E T ransactions on Acoustics, Speech and Signal Pr ocessing , vol. 28, no. 2, pp. 137–145 , 1980. [9] J. Du, Q. W ang, T . Gao, Y . Xu, L.-R. Dai, and C .-H. Lee, “Ro- bust speech recognition with speech enhanced deep neural net- works, ” in Pr oc. INTE RSPEECH , pp. 616–6 20, 2014. [10] D. Baby , J. F . Gemmeke, T . V irtanen, et al. , “Exemplar -based speech enhancement for deep neural network based automatic speech recognition, ” in Pr oc. ICASSP , pp. 4485–44 89, 2015. [11] A. J. R. Simpson, “Probabilistic binary-mask cocktail-party source separation in a con volution al deep neural netwo rk, ” CoRR , vo l. abs/1503.06962, 2015. [12] D. W ang and J. Chen, “Supervised speech separation based on deep learning: An ov erview , ” IEEE/ACM T ransactions on Audio, Speech, and Langua ge Processing , vo l. 26, no. 10, pp. 1702–17 26, 2018. [13] Y . Xu, J. Du, L.-R. Dai, and C. -H. Lee, “ A regression ap- proach to speech enhancement based on deep neural networks , ” IEEE/ACM Tr ansactions on Audio, Speech and Langua ge Pr o- cessing (T ASLP) , vol. 23, no. 1, pp. 7–19, 2015. [14] X. L u, Y . Tsao, S. Matsuda, and C. Hori, “Speech enhance- ment based on deep denoising autoencoder ., ” in Pro c. INTER- SPEECH , pp. 436–440 , 2013. [15] Z. Meng, J. Li, Y . Gong, et al. , “ Adversarial feature-mapping for speech enhanc ement, ” arXiv pr eprint arXiv:1809.02251 , 2018. [16] Z. Meng, J. Li, Y . Gong, et al. , “Cycle-consistent speech en- hancement, ” arXiv pr eprint arXiv:1809.02 253 , 2018. [17] R. S. Sutton, A. G. B arto, and R. J. W illiams, “Reinforcement learning is direct adapti ve optimal control, ” IEEE Contr ol Sys- tems , vol. 12, no. 2, pp. 19–22, 1992. [18] N. K ohl and P . Stone, “P oli cy gradient reinforcement learn- ing for fast quadrupedal locomotion, ” in Proc. ICRA , vol. 3, pp. 2619–26 24, 2004. [19] S. Singh, D. Litman, M. K earns, and M. W alker , “Optimiz- ing dialogue management with reinforcement learning: Exper- iments wi th the njfun system, ” J ournal of Artificial Intelligence Resear ch , vol. 16, pp. 105–133, 2002. [20] V . Mnih, K. Kavukcu oglu, D. Sil ver , A. A. Rusu, J. V eness, M. G. B ellemare, A. Graves, M. Riedmiller, A. K. Fi djeland, G. Ostrovski, et al. , “Human-le vel control through deep rein- forcement learning, ” N ature , vol. 518, no. 7540, pp. 529–3 33, 2015. [21] T . Kala and T . Shinozaki, “Reinforcement learning of speech recognition system based on policy gradient and hypothesis se- lection, ” in Pr oc. ICASSP , pp. 5759–57 63, 2018. [22] Y . Ko izumi, K. Niwa, Y . Hioka, K. K obayashi, and Y . Haneda, “Dnn-based source enhancement self-optimized by reinforce- ment learning using sound quality measurements, ” in Proc. ICASSP , pp. 81–85, 2017. [23] A. W . Rix, J. G. Beerends, M. P . Hollier , and A. P . Hek- stra, “Perceptual e va luation of speech quality (PESQ)-a new method for speech quality assessment of telephone networks and codecs, ” in Pr oc. ICASSP , pp. 749–752, 2001. [24] C. H. T aal, R. C. Hendriks, R. H eusdens, and J. Jensen, “ An algorithm for intell i gibility prediction of t i me–frequenc y weighted noisy speech, ” IE EE T ransactions on Audio, Speec h, and Langua ge P r ocessing , vol. 19, no. 7, pp. 2125–213 6, 2011. [25] Y . K oizumi, K. Ni wa, Y . Hioka, K. Koab ayashi, and Y . Haneda, “Dnn-based source enhancement to increase objective sound quality assessment score, ” IEEE /ACM Tr ansactions on Audio, Speec h, and Languag e Proc essing , vol. 26, no. 10, pp. 1780– 1792, 2018. [26] H.-M. W ang, B. Chen, J.-W . Kuo, and S. -S. Cheng, “Matbn: A mandarin chinese broadcast ne ws corpus, ” International Jo ur- nal of Computational L inguistics & Chinese L angua ge Pr o- cessing , vol. 10, no. 2, pp. 219–236 , 2005. [27] A. H. Moore, P . P . Parada, and P . A. Naylor , “Speech enhance- ment for robu st automatic speech recognition: Ev aluation us- ing a baseline system and instrumental measures, ” Computer Speec h & Langua ge , vol. 46, pp. 574–584, 2017. [28] M. Norouzi, D. J. Fleet, and R. R. Salakhutdino v , “Hamming distance metric learning, ” in Pro c. NIPs , pp. 1061–1069, 2012. [29] S. Katz, “Estimation of probabilities from sparse data for the language model componen t of a speech recognizer , ” IEEE transac tions on acoustics, speech, and signal pr ocessing , vol. 35, no. 3, pp. 400–401 , 1987. [30] D. Pove y , A. Ghoshal, G. Boulianne, L. Burget, O. Glembek, N. Goel, M. Hannemann, P . Motlicek, Y . Qian, P . S chwarz, et al. , “T he kaldi speech recognition t oolkit, ” in P r oc. ASRU , 2011. [31] S.- S . W ang, P . Lin, Y . Tsao, J.-W . Hung, and B . Su, “Sup- pression by selecting wav elets for feature compression in dis- tributed speech recognition, ” IEE E/ACM T ransactions on Au- dio, Speech and L angua ge Proce ssing , vol. 26, no. 3, pp. 564– 579, 2018. [32] S. Xia, H. Li , and X. Zhang, “Using optimal ratio mask as training target for supervised speech separation, ” i n Pr oc. AP- SIP A , pp. 163–166, 2017.
Original Paper
Loading high-quality paper...
Comments & Academic Discussion
Loading comments...
Leave a Comment