Integrating Recurrence Dynamics for Speech Emotion Recognition
We investigate the performance of features that can capture nonlinear recurrence dynamics embedded in the speech signal for the task of Speech Emotion Recognition (SER). Reconstruction of the phase space of each speech frame and the computation of it…
Authors: Efthymios Tzinis, Georgios Paraskevopoulos, Christos Baziotis
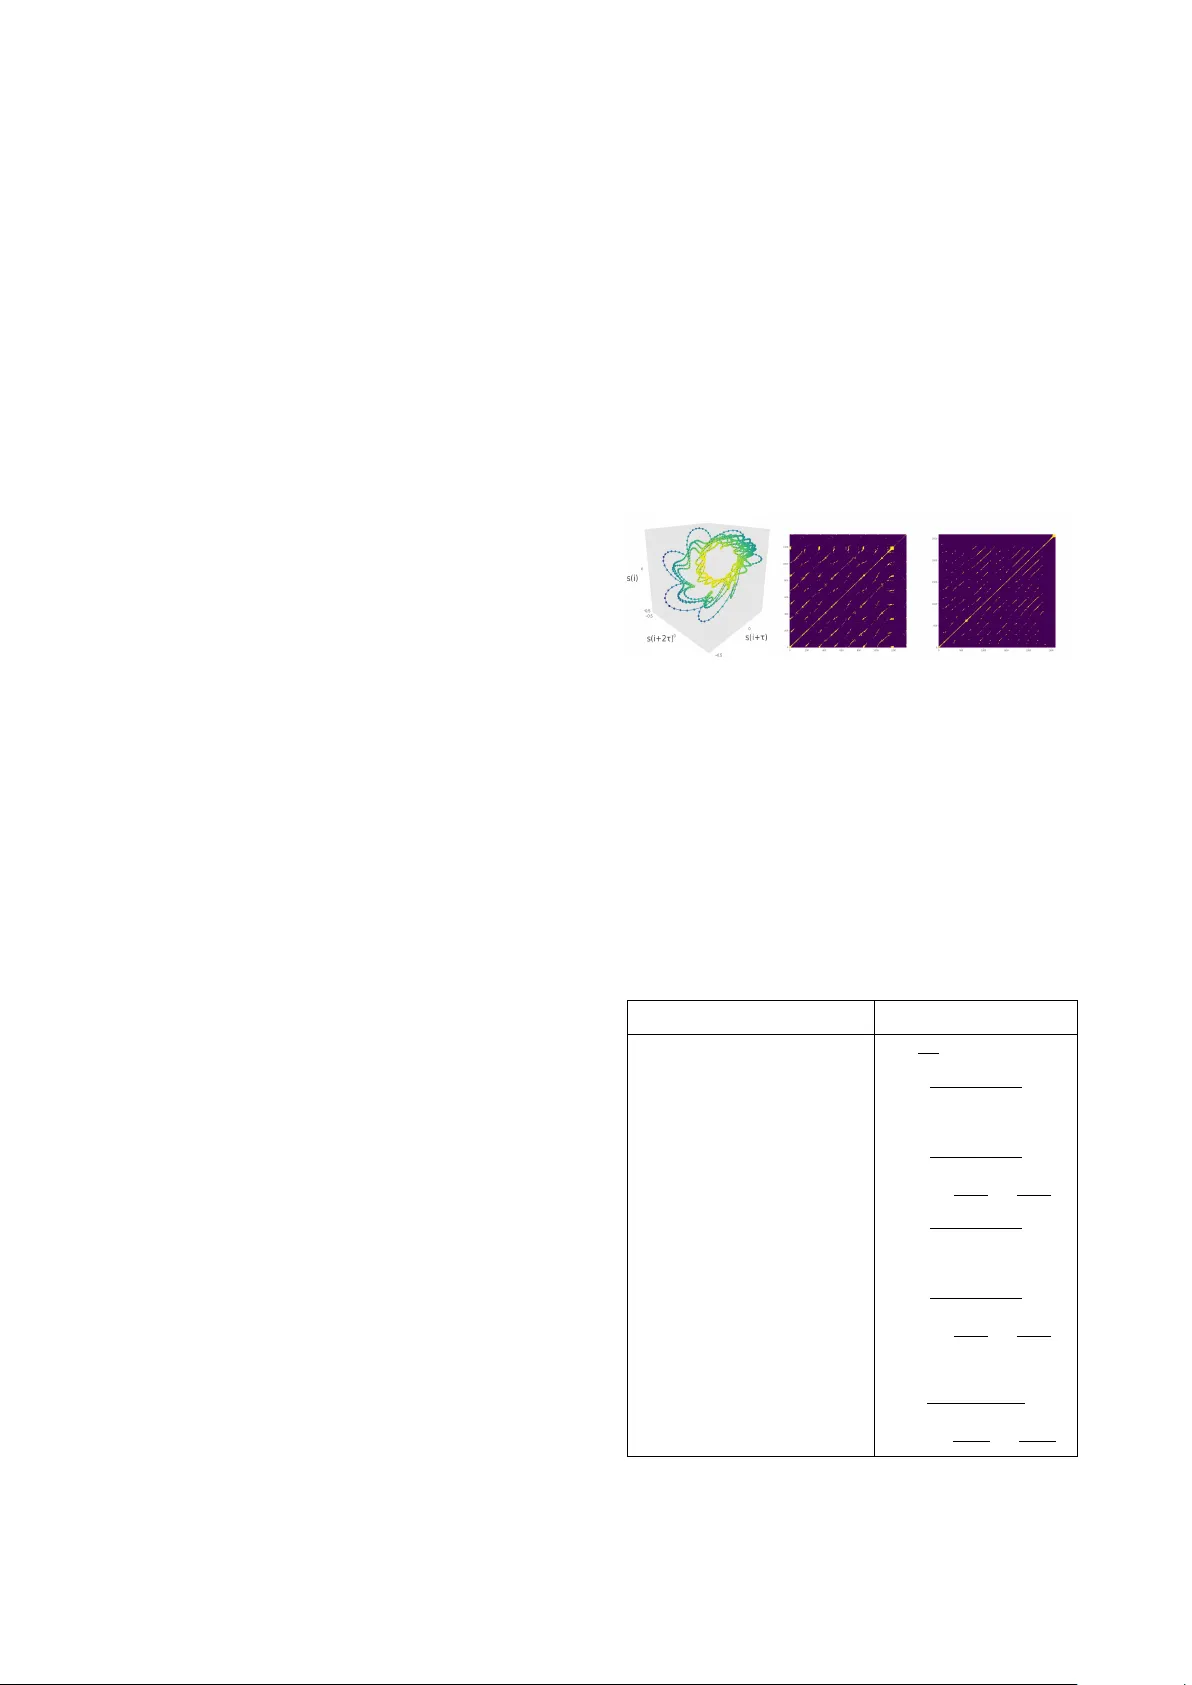
Integrating Recurr ence Dynamics f or Speech Emotion Recognition Efthymios Tzinis 1 , 2 , † , Geor gios P arask evopoulos 1 , 2 , † , Christos Baziotis 1 , Alexandr os P otamianos 1 , 2 1 School of Electrical & Computer Engineering, National T echnical Uni v ersity of Athens, Greece 2 Behavioral Signal T echnologies, Los Angeles, CA, USA † Both authors contributed equally to this w ork etzinis@gmail.com, geopar@central.ntua.gr, cbaziotis@mail.ntua.gr, potam@central.ntua.gr Abstract W e in vestig ate the performance of features that can capture non- linear recurrence dynamics embedded in the speech signal for the task of Speech Emotion Recognition (SER). Reconstruc- tion of the phase space of each speech frame and the compu- tation of its respecti ve Recurrence Plot (RP) rev eals complex structures which can be measured by performing Recurrence Quantification Analysis (RQA). These measures are aggregated by using statistical functionals ov er segment and utterance pe- riods. W e report SER results for the proposed feature set on three databases using dif ferent classification methods. When fusing the proposed features with traditional feature sets, e.g., [1], we show an improvement in unweighted accuracy of up to 5.7% and 10.7% on Speaker -Dependent (SD) and Speaker- Independent (SI) SER tasks, respecti vely , over the baseline [1]. Follo wing a segment-based approach we demonstrate state-of- the-art performance on IEMOCAP using a Bidirectional Recur - rent Neural Network. Index T erms : speech emotion recognition, recurrence quantifi- cation analysis, nonlinear dynamics, recurrence plots 1. Introduction Automatic Speech Emotion Recognition (SER) is ke y for b uild- ing intelligent human-machine interfaces that can adapt to the affecti v e state of the user , especially in cases like call centers where no other information modality is av ailable [2]. Extracting features capable of capturing the emotional state of the speaker is a challenging task for SER. Prosodic, spec- tral and voice quality Low Le v el Descriptors (LLDs), extracted from speech frames, ha ve been extensi vely used for SER [3]. Proposed SER approaches mainly differ on the aggre gation and temporal modeling of the input sequence of LLDs. In utterance-based approaches, statistical functionals are applied ov er all LLD values of the included frames [1]. These utterance- lev el statistical representations have been successfully used for SER using Support V ector Machines (SVMs) [4], Con v olu- tional Neural Networks (CNNs) [5] and Deep Belief Networks (DBNs) in a multi-task learning setup [6]. Moreover , segment- based approaches ha ve showcased that computation of statis- tical functionals ov er LLDs in appropriate timescales yields a significant performance improvement for SER systems [7], [8]. Specifically , in [8] statistical representations are extracted from ov erlapping segments, each one corresponding to a couple of words. The resulting sequence of segments representations is fed as input to a Long Short Time Memory (LSTM) unit for SER classification. Direct SER approaches are usually based on raw LLDs ex- tracted from emotional utterances. CNNs [9] and Bidirectional- LSTMs (BLSTMs) [10] ov er spectrogram representations re- ported state-of-the-art performances on Interacti ve Emotional Dyadic Motion Capture (IEMOCAP) database [11]. LSTMs with attention mechanisms have also been proposed in order to accommodate an acti ve selection of the most emotionally salient frames [12], [13]. T o this end, Sparse Auto-Encoders (SAE) for learning salient features from spectrograms of emo- tional utterances hav e also been studied [14]. Despite the great progress that has been made in SER, the aforementioned LLDs are extracted under the assumption of a linear source-filter model of speech generation. Howe ver , vo- cal fold oscillations and v ocal tract fluid dynamics often e xhibit highly nonlinear dynamical properties which might not be aptly captured by con ventional LLDs [15]. Nonlinear analysis of a speech signal through the reconstruction of its corresponding Phase Space (PS) lies in embedding the signal in a higher di- mensional space where its dynamics are unfolded [16]. Recur - rent patterns of these orbits are indicati ve attributes of system’ s behavior and can be analyzed using Recurrence Plots (RPs) [17]. Recurrence Quantification Analysis (RQA) provides com- plexity measures for an RP which are capable of identifying a system’ s transitions between chaotic and order regimes [18]. A variety of nonlinear features like: T eager Energy Operator [19], modulation features from instantaneous amplitude and phase [20] as well as geometrical measures from PS orbits [21] hav e been reported to yield significant improvement on SER when combined with con ventional feature sets. Howev er, RQA anal- ysis has not yet been employed for SER. In [22] RQA mea- sures have been sho wn to be statistically significant for the dis- crimination of emotions but an actual SER experimental setup is missing. In this paper, we extract RQA measures from speech- frames and evaluate them for SER. W e test the efficac y of the proposed RQA feature set under both utterance and segment- based approaches by calculating statistical functionals ov er the respectiv e time lengths. SVMs and Logistic Regression (LR) classifiers are used for the utterance-based approach as well as an Attention-BLSTM (A-BLSTM) for the respectiv e segment- based approach. The performance of the proposed RQA fea- ture set, as well as the fusion of the RQA features with con ven- tional feature sets [1], is reported on three databases and com- pared with state-of-the-art results for Speaker-Dependent (SD), Speaker -Independent (SI) and Lea ve One Session Out (LOSO) SER experiments. 2. F eature Extraction 2.1. Baseline Featur e Set (IS10 Set) W e use the IS10 feature set [1], in which 1582 features are ex- tracted corresponding to statistical functionals applied on vari- ous LLDs. The extraction is performed for both segment and utterance based approaches using the openSMILE toolkit [23]. 2.2. Proposed Nonlinear F eature Set (RQA Set) The RQA feature set for a giv en speech segment or utterance is extracted as described next. First, we break the given speech signal into frames and for each one we reconstruct its PS as shown in Section 2.2.1. For each PS orbit, its respectiv e RP is computed as explained in Section 2.2.2. In order to quantify the complex structures of the RP , a list of RQA measures (described in Section 2.2.3) is extracted; resulting in a 12 -dimensional representation of the input speech frame. Representations for speech-segments and utterances containing multiple frames are obtained by applying a set of 18 statistical functionals (listed in Section 2.2.4) over 12 -dimensional frame-attrib utes and their deltas. Thus, a 432 -dimensional feature vector is obtained. 2.2.1. Phase Space Reconstruction Giv en a speech frame with N samples { s ( i ) } N i =1 we reconstruct its corresponding PS trajectory by computing m time-delayed versions of the original speech frame by multiples of time lag τ and creating the vectors lying in R m as shown ne xt: x ( i ) = [ s ( i ) , s ( i + τ ) , ..., s ( i + ( m − 1) τ )] (1) where m is the embedding dimension of the reconstructed PS and τ is the time lag. If the embedding theorem holds and the aforementioned parameters are set appropriately , then the orbit defined by the points { x ( i ) } N i =1 would truthfully preserve in- variant quantities of the true underlying dynamics which are as- sumed to be unknown [24]. In accordance with [16], parameters τ and m for each speech frame are estimated individually by us- ing A verage Mutual Information (AMI) [25] and False Nearest Neighbors (FNN) [26], respectiv ely . 2.2.2. Recurr ence Plot Giv en a PS trajectory { x ( i ) } N i =1 we analyze the recurrence properties of these states by calculating the pairwise distances and thresholding these values in order to compute the corre- sponding RP [17]. RPs are binary square matrices and are de- fined element-wise as shown ne xt: R i,j ( , q ) = Θ( − || x ( i ) − x ( j ) || q ) (2) where Θ( · ) is the Heaviside step function, is the thresholding value, || · || q is the norm used to define the distance between trajectory points (for q = 1 , q = 2 or q = ∞ we compute Manhattan, Euclidean or Supremum norm, respectiv ely). Thus, matrix R consists of ones in areas where the states of the orbit are close and zero else where. The measure of proximity is de- fined by threshold for which multiple selection criteria hav e been studied [27]. W e consider three criteria depending on: 1) a fixed ad-hoc threshold v alue, 2) a fix ed Recurrence Rate (RR) as defined in T able 1 (e.g., For RR = 0 . 15 we set according to a fixed probability of the pairwise distances of PS’ s points P ( || x ( i ) − x ( j ) || q < ) = 0 . 15 , 1 ≤ i, j, ≤ N ), and 3) a fixed ratio of the standard de viation σ of points { x ( i ) } N i =1 , e.g., = 5 σ [28]. For fixed values of and q we denote as R i,j the respectiv e entry of the RP matrix for simplicity of notation. An L -length diagonal line (of ones) is defined by: (1 − R i − 1 ,j − 1 )(1 − R i + L +1 ,j + L +1 ) k = L Y k =1 R i + k,j + k = 1 (3) An L -length vertical line is described by: (1 − R i,j − 1 )(1 − R i,j + L +1 ) k = L Y k =1 R i,j + k = 1 (4) An L -length white vertical line (of zeros) is defined as: R i,j − 1 R i,j + L +1 k = L Y k =1 (1 − R i,j + k ) = 1 (5) W e also denote with P d ( l ) , P v ( l ) and P w ( l ) the histogram dis- tributions of lengths of diagonal, vertical and white vertical lines, respectiv ely . Hence, the total number of these lines are correspondingly N d = P l ≥ d m P d ( l ) , N v = P l ≥ v m P v ( l ) and N w = P l ≥ w m P w ( l ) , where d m = 2 , v m = 2 and w m = 1 define the minimum lengths for each type of line [18]. Emerging small-scale structures based on lines of ones or zeros reflect the dynamic behavior of the system. F or instance, diagonal lines indicate both similar ev olution of states for dif- ferent parts of PS’ s orbit and deterministic chaotic dynamics of the system [18]. This is also depicted in Figure 1. (a) (b) (c) Figure 1: (a) Reconstructed PS ( m = 3 , τ = 7 ) and (b) RP ( = 0 . 15 , Manhattan norm) of 30 ms frame corr esponding to vowel /e/. (c) RP of Lor enz96 system displaying chaotic behavior [29] 2.2.3. Recurr ence Quantification Analysis (RQA) For each N × N RP we extract 12 RQA measures using the pyunicorn framew ork [30]. Following the notation established in Section 2.2.2 we provide an ov erview of these measures in T able 1; they are comprehensi vely studied in [18], [31]. T able 1: Recurrence Quantification Analysis Measur es Name Formulation Recurrence Rate 1 N 2 P N i,j =1 R i,j Determinism P N l = d m lP d ( l ) P N l =1 lP d ( l ) Max Diagonal Length max ( { l i } N d i =1 ) A verage Diagonal Length P N l = d m lP d ( l ) P N l = d m P d ( l ) Diagonal Entropy P N l = d m P d ( l ) N d ln ( N d P d ( l ) ) Laminarity P N l = v m lP v ( l ) P N l =1 lP v ( l ) Max V ertical Length max ( { v i } N v i =1 ) T rapping Time P N l = v m lP v ( l ) P N l = v m P v ( l ) V ertical Entropy P N l = v m P v ( l ) N v ln ( N v P v ( l ) ) Max White V ertical Length max ( { w i } N w i =1 ) A verage White V ertical Length P N l = w m lP w ( l ) P N l = w m P w ( l ) White V ertical Entropy P N l = w m P w ( l ) N w ln ( N w P w ( l ) ) 2.2.4. Statistical Functionals After the extraction of frame-wise features and their associated deltas we apply 18 statistical functionals: min, max, mean, me- dian, variance, ske wness, kurtosis, range, 1 st , 5 th , 25 th , 50 th , 75 th , 95 th , 99 th percentile and 3 quartile ranges. 2.3. Fused Featur e Set (RQA + IS10 Set) For any emotional speech segment or utterance we extract both feature sets IS10 and RQA as described previously and concate- nate them. The final feature vector has 2014 dimensions. 3. Classification Methods W e in vestigate both utterance-based and segment-based SER as outlined below: Utterance-based method: For each utterance we obtain its sta- tistical representation by extracting the corresponding feature set as described in Section 2. For emotion classification we em- ploy an SVM with Radial Base Function (RBF) k ernel and one- versus-rest LR classifier . Cost coefficient C lies in the inter- val [0 . 001 , 30] for both SVM and LR models which is the only hyper-parameter to be tuned. Both models are implemented us- ing the scikit-learn framew ork [32]. Segment-based method: W e break each utterance into seg- ments of 1 . 0 s length and 0 . 5 s stride in accordance with [8]. For each speech segment we extract the feature sets described in Section 2 and as a result each utterance is now represented by a sequence of statistical vectors corresponding to different time steps. This sequence is fed as an input to a Long Short T ime Memory (LSTM) unit for emotion classification. SER can be formulated as a many-to-one sequence learning where the expected output of each sequence of segment features is an emotional label deriv ed from the activ ations of the last hidden layer [12]. W e employ an A-BLSTM architecture [13] where the decision for the emotional label is deri ved from a weighted aggregation of all timesteps. W e implement this architecture in pytorch [33]. In addition, the grid space of hyper -parameters consists of: number of layers { 1 , 2 } , number of hidden nodes { 128 , 256 } , input noise [0 . 3 , 0 . 8] , dropout rate [0 . 3 , 0 . 8] and learning rate [0 . 0002 , 0 . 002] . 4. Experiments and Results The following databases are used in our e xperiments: SA VEE: Surrey Audio-V isual Expressed Emotion (SA VEE) Database [34] is composed of emotional speech voiced by 4 male actors. SA VEE includes 480 utterances ( 120 utterances per actor) of 7 emotions i.e., 60 anger, 60 disgust, 60 fear, 60 happiness, 60 sadness, 60 surprise and 120 neutral. Emo-DB: Berlin Database of Emotional Speech (Emo-DB) [35] contains 535 emotional sentences in German, voiced by 10 actors ( 5 male and 5 female). Specifically , 7 emotions are included i.e., 127 anger , 45 disgust, 70 fear, 71 joy , 60 sadness, 81 boredom and 70 neutral. IEMOCAP: IEMOCAP database [11] contains 12 hours of video data of scripted and improvised dialog recorded from 10 actors. Utterances are organized in 5 sessions of dyadic interac- tions between 2 actors. F or our experiments we consider 5531 utterances including 4 emotions (1103 angry , 1636 happ y , 1708 neutral and 1084 sad), where we merge excitement and happi- ness class into the latter one [5], [6], [9], [10]. W e evaluate our proposed feature set under three different SER tasks described next. W e also compare our results with the most relev ant experimental setups reported in the literature. For all tasks, we report: W eighted Accuracy (W A) which is the percentage of correct classification decisions and Unweighted Accuracy (U A) which is calculated as the a verage of recall per- centage for each emotional class. After an e xtensive study of the RQA configuration parame- ters described in Section 2.2.2, we conclude that best results on SER tasks are obtained using a frame duration of 20 ms for e x- tracting RPs. In addition, the best performing parameters for the RP configuration seem to be a Manhattan norm with a threshold setting depending on a fixed recurrence rate lying in [0 . 1 , 0 . 2] . 4.1. Speaker Dependent (SD) W e ev aluate RQA features on SA VEE and Emo-DB following the utterance-based approach described in Section 3. In this setup we apply per-speaker z -normalization (PS-N) and split randomly utterances in train and test sets. Accuracies using 5 - fold cross-v alidation are summarized on T able 2 for the best performing classifier hyper-parameter v alues. The fused set achieves significant performance impro ve- ment over the baseline IS10 feature set for both datasets. On SA VEE, W A is improv ed by 3 . 1% ( 77 . 1% → 80 . 2% ) and U A by 3 . 4% ( 74 . 5% → 77 . 9% ). W e also achieve an improvement of 4 . 9% ( 88 . 4% → 93 . 3% ) and 5 . 7% ( 87 . 2% → 92 . 9% ) for W A and UA, respectively on Emo-DB. The feature set used in [36] is e xtracted over cepstral, spectral and prosodic LLDs simi- lar to the ones used in IS10 [1]. Noticeably , the y achie ve similar performance to ours when we use only IS10 but our fused set with LR outperforms on both Emo-DB ( 5% in U A and 4 . 6% in W A) and SA VEE ( 4 . 5% in U A and 3 . 9% in W A). The proposed combination of features and LR also surpasses a Con volutional SAE approach [14] in terms of W A by 5% on Emo-DB and 4 . 8% on SA VEE. Presumably , RQA measures contain informa- tion closely related to speaker -specific emotional dynamics not captured by con ventional features. T able 2: SD results on SA VEE and Emo-DB. (ESR) Ensemble Softmax Re gression Features Model SA VEE Emo-DB W A U A W A U A IS10 SVM 77.1 74.5 88.4 87.2 LR 74.4 71.8 87.4 86.3 RQA SVM 66.0 63.0 81.8 80.4 LR 64.4 61.1 81.9 79.9 RQA+IS10 SVM 77.3 75.5 90.1 88.9 LR 80.2 77.9 93.3 92.9 [14] Spectrogram SAE 75.4 - 88.3 - [36] LLDs Stats ESR 76.3 73.4 88.7 87.9 4.2. Speaker Independent (SI) Again, we follow the utterance-based approach described in Section 3 on both SA VEE and Emo-DB datasets but we do not make any assumptions for the identity of the user during train- ing. W e use leave-one-speak er-out cross v alidation, where one speaker is kept for testing and the rest for training. The mean and standard deviation are calculated only on training data and used for z -normalization on all data. From no w on we refer to this normalization as Per Fold-Normalization (PF-N). T able 3 presents accuracies a veraged o ver all folds for the best perform- ing classifier hyper-parameter v alues. In comparison with the baseline IS10 feature set, the fused feature set obtains an absolute improv ement of 5 . 5% and 8 . 2% on SA VEE as well as 2 . 4% and 3 . 2% on Emo-DB in terms of W A and U A, respectiv ely . Furthermore, our fused set achiev es higher performance on SA VEE ( 3 . 5% in W A and 4 . 5% in U A) and slightly lower in Emo-DB compared to [36]. In [37] W eighted Spectral Features based on Hu Moments (WSFHM) are fused with IS10 on utterance-level which is similar to our approach. In direct comparison using the same model (SVM) we surpass the reported performance in terms of W A by 2 . 5% and 0 . 4% on SA VEE and Emo-DB, respectively . In addition, both RQA and IS10 sets achie ve quite lo w performance on SA VEE. Howe ver , their combination yields an impressive per - formance improvement of 5 . 5% ( 48 . 5% → 54 . 0% ) in W A and 10 . 7% ( 43 . 1% → 53 . 8% ) in UA ov er IS10 when we use LR. Our results suggest that RQA measures preserve in variant as- pects of nonlinear dynamics occurring in emotional speech and are shared across different speak ers. T able 3: SI r esults on SA VEE and Emo-DB. (ESR) Ensemble Softmax Re gression Features Model SA VEE Emo-DB W A U A W A U A IS10 SVM 47.5 45.6 79.7 74.3 LR 48.5 43.1 76.1 71.9 RQA SVM 45.6 41.1 70.9 64.2 LR 47.7 42.3 71.1 67.1 RQA+IS10 SVM 52.5 50.6 82.1 76.9 LR 54.0 53.8 80.1 77.5 [36] LLDs Stats ESR 51.5 49.3 82.4 78.7 [37] WSFHM+IS10 SVM 50.0 - 81.7 - 4.3. Leav e One Session Out (LOSO) In this task, we assume that the test-speaker identity is unknown but we are able to train our model considering other speakers who are recorded in similar conditions. W e evaluate on both utterance and segment-based methods (described in Section 3) on IEMOCAP . Giv en our assumption, we treat each of the 5 sessions as a speaker group [11]. W e use LOSO in order to create train and test folds. In each fold, we use 4 sessions for training and the remaining 1 for testing. For the testing ses- sion we use one speaker as testing set and the other for tuning the hyper-parameters of our models. W e repeat the ev aluation by reversing the roles of the two speakers. In the final assess- ment, we report the average performance obtained in terms of W A and UA obtained from all speakers [5], [6], [10]. In or- der to be easily comparable with the literature we follow three different normalization schemes. W e use the aforementioned PS-N and PF-N schemes as well as Global z -normalization (G- N). In G-N we calculate the global mean and standard devia- tion from all the av ailable samples in the dataset and perform z -normalization over them. Results on IEMOCAP for the three different normalization schemes are demonstrated on T able 4. A consistent performance improv ement is shown for all combinations of normalization techniques and employed mod- els when the fused set is used instead of IS10. Specifically , for SVM the fused set yields a relativ e improvement varying from 0 . 3% to 1 . 0% in W A and from 0 . 2% to 0 . 9% in U A under all normalization strategies. The same applies for LR (in W A from 0 . 8% to 1 . 0% and in U A from 0 . 3% to 1 . 0% ) as well as for A-BLSTM (in W A from 0 . 1% to 0 . 7% and in UA from 0 . 2% to 0 . 7% ). In accordance with our intuition [8], a segment-based approach using A-BLSTM surpasses all utterance-based ones in W A from 3 . 4% to 8 . 4% and in UA from 3 . 8% to 6 . 8% for all normalization schemes, when the fused set is used. In [5] low le vel Mel Filterbank (MFB) features are fed di- rectly to a CNN. In [10] a stacked autoencoder is used to ex- tract feature representations from spectrograms of glottal flow signals and then a BLSTM is used for classification. W e surpass both reported results by 0 . 2% in U A for [5] and by a mar gin of 8 . 7% in W A and 8 . 5% in U A for [10], respectively ev en with simple models. Compared to a multi-task DBN trained for both discrete emotion classification and for valence-acti vation in [6], we report 2 . 0% higher W A and 3 . 1% higher U A. W e also report 4 . 6% higher UA and 1 . 9% lo wer W A compared to CNNs over spectrograms [9]. W e assume that this inconsistency in perfor- mance metrics occurs because a slightly different experimental setup is followed where the final session is excluded from test- ing [9]. T able 4: LOSO results on IEMOCAP . (GFS): Glottal Flow Spectr ogram, (SP): Spectr ogram. Features Model PS-N PF-N G-N W A U A W A U A W A U A IS10 SVM 58.3 60.9 58.9 60.1 59.2 60.5 LR 57.5 61.2 54.6 57.9 53.5 57.5 A-BLSTM 62.0 65.1 62.6 65.0 62.8 65.0 RQA SVM 52.9 54.6 53.1 53.8 53.1 53.7 LR 52.2 54.8 52.6 54.0 52.8 54.3 A-BLSTM 55.6 59.3 56.6 58.3 56.7 58.7 RQA SVM 59.3 61.8 59.2 60.4 59.5 60.7 + LR 58.3 62.0 55.6 58.7 54.5 58.7 IS10 A-BLSTM 62.7 65.8 63.0 65.2 62.9 65.5 [5] MFB CNN - 61.8 - - - - [6] IS10 DBN - - - - 60.9 62.4 [9] SP CNN - - - - 64.8 60.9 [10] GFS BLSTM - - 50.5 51.9 - - 5. Conclusions W e in vestigated the usage of nonlinear RQA measures extracted from RPs for SER. The effecti veness of these features has been tested under both utterance-based and segment-based ap- proaches across three emotion databases. The fusion of non- linear and conv entional feature sets yields significant perfor- mance improvement over traditional feature sets for all SER tasks; the performance improv ement is especially large when speaker identity is unkno wn. The fused data set improv es on the state-of-the-art for SER under most testing conditions, clas- sification methods and datasets. Recurrence analysis of speech signals is a promising direction for SER research. In the future, we plan to automatically extract features from RPs using con- volutional autoencoders in order to substitute RQA measures. 6. Acknowledgements This work has been partially supported by the BabyRobot project supported by EU H2020 (grant #687831). Special thanks to Nikolaos Athanasiou and Nikolaos Ellinas for their contributions on the e xperimental environment setup. 7. References [1] B. Schuller , S. Steidl, A. Batliner , F . Burkhardt, L. Devillers, C. M ¨ uller , and S. Narayanan, “The interspeech 2010 paralin- guistic challenge, ” in Pr oceedings of INTERSPEECH , 2010, pp. 2794–2797. [2] C. M. Lee and S. S. Narayanan, “T oward detecting emotions in spoken dialogs, ” IEEE T ransactions on speec h and audio pr ocess- ing , vol. 13, no. 2, pp. 293–303, 2005. [3] M. El A yadi, M. S. Kamel, and F . Karray , “Surv ey on speech emo- tion recognition: Features, classification schemes, and databases, ” P attern Recognition , vol. 44, no. 3, pp. 572–587, 2011. [4] E. Mower , M. J. Mataric, and S. Narayanan, “ A framework for automatic human emotion classification using emotion profiles, ” IEEE T ransactions on Audio, Speech, and Language Pr ocessing , vol. 19, no. 5, pp. 1057–1070, 2011. [5] Z. Aldeneh and E. M. Provost, “Using regional saliency for speech emotion recognition, ” in Pr oceedings of ICASSP , 2017, pp. 2741– 2745. [6] R. Xia and Y . Liu, “ A multi-task learning framework for emotion recognition using 2d continuous space, ” IEEE T ransactions on Af- fective Computing , vol. 8, no. 1, pp. 3–14, 2017. [7] B. Schuller and G. Rigoll, “T iming lev els in segment-based speech emotion recognition, ” in Proceedings of INTERSPEECH , 2006. [8] E. Tzinis and A. Potamianos, “Segment-based speech emotion recognition using recurrent neural networks, ” in Affective Com- puting and Intelligent Interaction (A CII) , 2017, pp. 190–195. [9] H. M. Fayek, M. Lech, and L. Cavedon, “Evaluating deep learning architectures for speech emotion recognition, ” Neural Networks , vol. 92, pp. 60–68, 2017. [10] S. Ghosh, E. Laksana, L.-P . Morency , and S. Scherer , “Represen- tation learning for speech emotion recognition. ” in Pr oceedings of INTERSPEECH , 2016, pp. 3603–3607. [11] C. Busso, M. Bulut, C.-C. Lee, A. Kazemzadeh, E. Mower , S. Kim, J. N. Chang, S. Lee, and S. S. Narayanan, “Iemocap: Interactiv e emotional dyadic motion capture database, ” Languag e r esources and evaluation , v ol. 42, no. 4, p. 335, 2008. [12] C.-W . Huang and S. S. Narayanan, “ Attention assisted discovery of sub-utterance structure in speech emotion recognition. ” in Pr o- ceedings of INTERSPEECH , 2016, pp. 1387–1391. [13] S. Mirsamadi, E. Barsoum, and C. Zhang, “ Automatic speech emotion recognition using recurrent neural networks with local attention, ” in Proceedings of ICASSP , 2017, pp. 2227–2231. [14] Q. Mao, M. Dong, Z. Huang, and Y . Zhan, “Learning salient fea- tures for speech emotion recognition using conv olutional neural networks, ” IEEE T ransactions on Multimedia , vol. 16, no. 8, pp. 2203–2213, 2014. [15] H. Herzel, “Bifurcations and chaos in v oice signals, ” Applied Me- chanics Revie ws , vol. 46, no. 7, pp. 399–413, 1993. [16] V . Pitsikalis and P . Maragos, “ Analysis and classification of speech signals by generalized fractal dimension features, ” Speech Communication , vol. 51, no. 12, pp. 1206–1223, 2009. [17] J.-P . Eckmann, S. O. Kamphorst, and D. Ruelle, “Recurrence plots of dynamical systems, ” EPL (Europhysics Letters) , vol. 4, no. 9, p. 973, 1987. [18] N. Marwan, M. C. Romano, M. Thiel, and J. Kurths, “Recurrence plots for the analysis of complex systems, ” Physics reports , vol. 438, no. 5-6, pp. 237–329, 2007. [19] R. Sun and E. Moore, “In vestigating glottal parameters and teager energy operators in emotion recognition, ” in Affective Computing and Intelligent Interaction , 2011, pp. 425–434. [20] T . Chaspari, D. Dimitriadis, and P . Maragos, “Emotion classifica- tion of speech using modulation features, ” in Pr oceedings of Sig- nal Pr ocessing Conference (EUSIPCO) , 2014, pp. 1552–1556. [21] A. Shahzadi, A. Ahmadyfard, A. Harimi, and K. Y aghmaie, “Speech emotion recognition using nonlinear dynamics features, ” T urkish Journal of Electrical Engineering & Computer Sciences , vol. 23, no. Sup. 1, pp. 2056–2073, 2015. [22] A. Lombardi, P . Guccione, and C. Guaragnella, “Exploring recur- rence properties of vo wels for analysis of emotions in speech, ” Sensors & T ransducers , v ol. 204, no. 9, p. 45, 2016. [23] F . Eyben, F . W eninger, F . Gross, and B. Schuller, “Recent devel- opments in opensmile, the munich open-source multimedia fea- ture extractor, ” in Pr oceedings of the 21st ACM International Con- fer ence on Multimedia , 2013, pp. 835–838. [24] T . Sauer , J. A. Y orke, and M. Casdagli, “Embedology , ” Journal of statistical Physics , vol. 65, no. 3-4, pp. 579–616, 1991. [25] A. M. Fraser and H. L. Swinney , “Independent coordinates for strange attractors from mutual information, ” Physical r eview A , vol. 33, no. 2, p. 1134, 1986. [26] M. B. Kennel, R. Brown, and H. D. I. Abarbanel, “Determin- ing embedding dimension for phase-space reconstruction using a geometrical construction, ” Phys. Rev . A , vol. 45, pp. 3403–3411, 1992. [27] S. Schinkel, O. Dimigen, and N. Marwan, “Selection of recur- rence threshold for signal detection, ” The eur opean physical jour - nal special topics , vol. 164, no. 1, pp. 45–53, 2008. [28] M. Thiel, M. C. Romano, J. Kurths, R. Meucci, E. Allaria, and F . T . Arecchi, “Influence of observational noise on the recurrence quantification analysis, ” Physica D: Nonlinear Phenomena , vol. 171, no. 3, pp. 138–152, 2002. [29] N. Marwan, J. Kurths, and S. Foerster , “ Analysing spatially ex- tended high-dimensional dynamics by recurrence plots, ” Physics Letters A , vol. 379, no. 10, pp. 894 – 900, 2015. [30] J. F . Donges, J. Heitzig, B. Beronov , M. Wiedermann, J. Runge, Q. Y . Feng, L. T upikina, V . Stolbov a, R. V . Donner , N. Mar- wan et al. , “Unified functional network and nonlinear time se- ries analysis for complex systems science: The pyunicorn pack- age, ” Chaos: An Inter disciplinary Journal of Nonlinear Science , vol. 25, no. 11, p. 113101, 2015. [31] C. L. W ebber Jr and J. P . Zbilut, “Recurrence quantification anal- ysis of nonlinear dynamical systems, ” T utorials in contemporary nonlinear methods for the behavioral sciences , pp. 26–94, 2005. [32] F . Pedregosa, G. V aroquaux, A. Gramfort, V . Michel, B. Thirion, O. Grisel, M. Blondel, P . Prettenhofer , R. W eiss, V . Dubourg, J. V anderplas, A. Passos, D. Cournapeau, M. Brucher, M. Perrot, and E. Duchesnay , “Scikit-learn: Machine learning in Python, ” Journal of Machine Learning Resear ch , vol. 12, pp. 2825–2830, 2011. [33] A. Paszke, S. Gross, S. Chintala, G. Chanan, E. Y ang, Z. DeV ito, Z. Lin, A. Desmaison, L. Antiga, and A. Lerer , “ Automatic dif fer- entiation in pytorch, ” 2017. [34] S. Haq and P . Jackson, “Speaker-dependent audio-visual emotion recognition, ” in Pr oceedings Int. Conf. on Auditory-V isual Speech Pr ocessing (A VSP’08), Norwich, UK , Sept. 2009. [35] F . Burkhardt, A. Paeschke, M. Rolfes, W . F . Sendlmeier , and B. W eiss, “ A database of german emotional speech, ” in Ninth Eu- r opean Confer ence on Speech Communication and T echnology , 2005. [36] Y . Sun and G. W en, “Ensemble softmax regression model for speech emotion recognition, ” Multimedia T ools and Applications , vol. 76, no. 6, pp. 8305–8328, 2017. [37] Y . Sun, G. W en, and J. W ang, “W eighted spectral features based on local hu moments for speech emotion recognition, ” Biomedical signal pr ocessing and control , v ol. 18, pp. 80–90, 2015.
Original Paper
Loading high-quality paper...
Comments & Academic Discussion
Loading comments...
Leave a Comment