Spectrogram-channels u-net: a source separation model viewing each channel as the spectrogram of each source
Sound source separation has attracted attention from Music Information Retrieval(MIR) researchers, since it is related to many MIR tasks such as automatic lyric transcription, singer identification, and voice conversion. In this paper, we propose an …
Authors: Jaehoon Oh, Duyeon Kim, Se-Young Yun
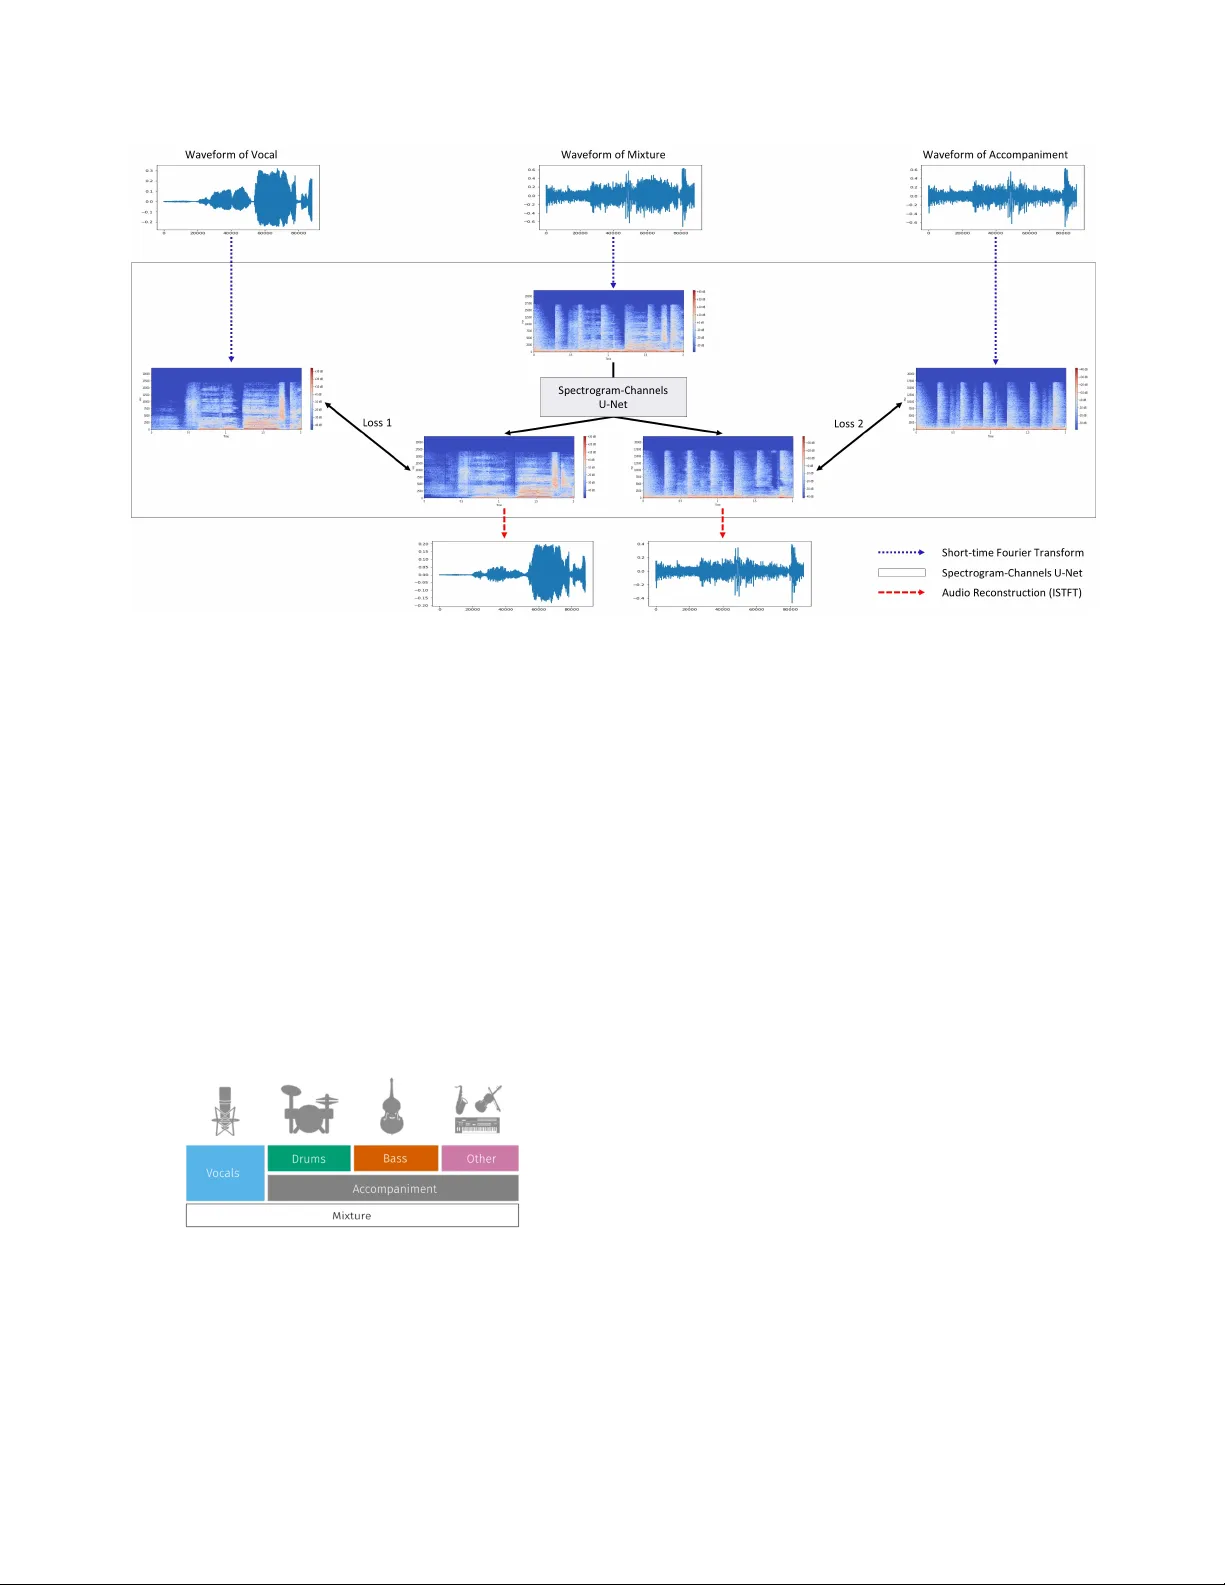
SPECTR OGRAM-CHANNELS U-NET : A SOURCE SEP ARA TION MODEL VIEWING EA CH CHANNEL AS THE SPECTROGRAM OF EA CH SOURCE J aehoon Oh ∗ , Duyeon Kim ∗ , Se-Y oung Y un ∗ Both authors contributed equally to this w ork. Graduate School of Kno wledge Service Engineering, KAIST { jhoon.oh,duyeon,yunseyoung } @kaist.ac.kr ABSTRA CT Sound source separation has attracted attention from Music Information Retrie v al(MIR) researchers, since it is related to many MIR tasks such as automatic lyric transcription, singer identification, and voice con version. In this paper, we pro- pose an intuiti ve spectrogram-based model for source sepa- ration by adapting U-Net. W e call it Spectr ogram-Channels U-Net , which means each channel of the output corresponds to the spectrogram of separated source itself. The proposed model can be used for not only singing voice separation but also multi-instrument separation by changing only the num- ber of output channels. In addition, we propose a loss function that balances v olumes between dif ferent sources. Finally , we yield performance that is state-of-the-art on both separation tasks. Index T erms — Source Separation, Singing V oice Sep- aration, Multi-instrument Separation, Spectrogram-Channels U-Net 1. INTRODUCTION Separating sources from a song is an important basic task in Music Information Retrie val(MIR) because man y tasks in MIR require a clean source. Howe v er , this is a difficult task because a song consists of man y sources. If one can separate vocal and its accompaniment clearly , it opens up a new hori- zon in terms of music applications; automatic lyric transcrip- tion, singer identification, v oice con version, music similarity , genre classification, and so on. In many previous studies, non-negativ e matrix factoriza- tion (NMF) was used for the source separation of the audio signal [1, 2, 3]. Bayesian modeling [4] and Principle Compo- nent Analysis (PCA) were also used [5]. In recent years, deep learning techniques have sho wn outstanding performance in various fields, so many studies hav e tried to adopt deep learning techniques for audio sig- nal source separation. Grais et al. [6] used both NMF and Deep Neural Networks(DNN) and showed better separation performance than just using NMF . Especially , Con volutional Neural Networks(CNN) sho wed fine performance in solv- ing image-based problems [7]. CNN can e xtract features well by using conv olutional filters and is ef ficient in aspect of memory because of weight sharing. Andreas Jansson et al. [8] showed that U-Net can yield good performance on sound domain by using a spectrogram as an input. U-Net [9], which is composed of a fully con v olutional encoder and decoder network and features skip connection from encoder to decoder , was originally introduced in the biomedical field. Besides CNN, there are other deep learning techniques studied in source separation. Huang et al. [10] used Recurrent Neural Networks(RNN) for singing voice separation. T aka- hashi et al. [11] used both CNN and RNN for audio source separation. Another approach is using Generati v e Adversarial Networks (GAN) [12] which is composed of a generator net- work that makes fake input and a discriminator network that determines whether the input is fake or real. Santiago et al. [13] made Speech Enhancement GAN(SEGAN), which is the end-to-end GAN model applied to a domain where models filter out voice from noise environment. And Singing V oice Separation GAN(SVSGAN) [14] is the GAN model generat- ing voice from music. In this paper , we propose an intuitiv e 2D con volution neu- ral network using spectrograms for sound source separation, Spectr ogr am-Channels U-Net , which is based on the model in [8] and uses 2-channels output for singing v oice separation or 4-channels output for multi-instrument separation. This is the main difference from the original U-Net model for sound sep- aration. The original model has a drawback in that the output is a mask, which is multiplied to a mixture spectrogram and can generate only a separated v ocal spectrogram. T o separate multi-instrument sources at the same time, additional models are needed. Our output remedies this since it is not a mask but a direct spectrogram, which enables us to separate multi- ple sources simultaneously . Secondly , we propose a weighted loss function to balance volumes between different sources since every source would have quite dif ferent volumes from each other . W e finally ev aluate our model using an objective measure and show reasonable performance on both tasks. Fig. 1 . Overall architecture for singing v oice separation 2. PROPOSED MODEL W e use the musdb18 dataset, which is a representati ve dataset for sound source separation. This includes isolated v ocals and accompaniment. Accompaniment is also pro vided as decom- posed drums, bass, and other sources. Figure 2 shows com- ponents of dataset [15]. There are 100 songs for training and 50 songs for testing. W e do not do any additional process- ing other than con verting stereo to mono. Input data is mix- ture for both separation tasks. For singing voice separation, target data are vocals and accompaniment. While for multi- instrument separation, tar get data are vocals, drums, bass, and other . Fig. 2 . The components of the dataset Figure 1 represents our overall architecture for singing voice separation. It is composed of three parts: Short-time Fourier T ransform, Spectrogram-Channels U-Net, and Audio Reconstruction. 2.1. Short-time Fourier T ransform W e transform a wav eform into a spectrogram to make input and target data of the netw ork by the following procedure: • Step 1: W e sample wa veform of songs at 44,100Hz. Then, we cut songs into 2 second increments. • Step 2: W e apply a short-time Fourier transform (STFT) to wa veform signals with a window size of 2048 and hop length of 512 frames. As a result, we get the complex- valued spectrograms of signals. • Step 3: W e decompose spectrograms into magnitude and phase. The former is used as input and targets to the network, the latter is used for audio reconstruction. For the sake of simplicity , spectrogram means magnitude in this paper . 2.2. Spectrogram-Channels U-Net Figure 3 represents the detail of Spectr ogram-Channels U- Net . The network consists of the encoder part and the decoder part. The encoder part has a repeated structure of two com- ponents: a conv olution layer that keeps spectrogram size and increases the number of channels, and a max pooling layer that decreases spectrogram size in half and keeps the number of channels. Each con volution layer in the encoder consists of con volution of kernel size 3x3 and padding 1, batch normal- ization, and rectified linear units(ReLU) activ ation function. The decoder part also has a repeated structure of two components: an upsampling decon volution layer that doubles Fig. 3 . The detail of Spectr ogram-Channels U-Net spectrogram size and decreases the number of channels in half, and a deconv olution layer that keeps spectrogram size and decreases the number of channels. The former consists of decon volution of kernel size 5x5, stride 2, and padding 2, batch normalization, ReLU activ ation function, and dropout with probability 0.4. The latter consists of deconv olution of kernel size 3x3 and padding 1, batch normalization, and ReLU activ ation function. The encoder and decoder , ha ving the same spectrogram size, are concatenated via skip connection. Since skip con- nection deliv ers the information of mixture from encoder to decoder , the combination of channels on the decoder part is also related to mixture. From this idea, we make the difference from [8] in which they used the concept of mask for separation. Rather , we make multiple channels output and view each channel of this output as the spectrogram of each source directly . For this idea, we use 1x1 con volution as the final con volution and use ReLU activ ation function since the values of spectrograms are non-negati ve. In summary , the input of this model is spectrogram of mixture, and each channel of the output corresponds to the spectrogram of each source that we want to separate. For con venience, let sour ce be the spectrogram of a target and channel source be the spectrogram of a separated source from a mixture. For example, in L ( v ocal, channel vocal ) , v ocal is the spectrogram of v ocal and channel vocal is the spectrogram of separated vocal from a mixture. For the training, we define loss functions as follow for each task: loss (Singing V oice) = α ∗ L ( v ocal , channel vocal ) +(1 − α ) ∗ L ( acc, channel acc ) loss (Multi-instrument) = α 1 ∗ L ( v ocal, channel vocal ) + α 2 ∗ L ( dr um, channel drum ) + α 3 ∗ L ( bass, channel bass ) + α 4 ∗ L ( other, channel other ) ( α 1 + α 2 + α 3 + α 4 = 1) where L is the average of L1 losses on ev ery pixel. W e train the network using AD AM optimizer with weight decay 1e-6, and batch size of 8. W e perform 20 epochs with learning rate of 1e-3, then perform 20 epochs more with learning rate of 1e-4. 2.3. A udio Reconstruction W e re-transform spectrogram into wa veform to listen to the reconstructed sound and to ev aluate. W e multiply the phase of mixture and the magnitude of separated source elementwisely where mixture is the input and separated source is the output. After that, we get the wa veform using in verse STFT . 3. EXPERIMENTS T o measure source separation performance objectively [16], we use Signal-to-Distortion Ratio(SDR) of separated sources. The formula is as follows: SDR := 10 log 10 || s target || 2 || e interf + e noise + e artif || 2 where s target is a version of modified by an allowed distortion for some signal s j and e interf , e noise , and e artif are, respectiv ely , the interferences, noise, and artifacts error terms. T o reduce artifacts by STFT and ISTFT , we use 20 seconds as an input of model and then ev aluate it ev ery one second. 3.1. Singing V oice Separation For singing voice separation, we make 4 dif ferent models ac- cording to α in the loss function. M1 sets α as 1.0, which means we extract only vocal source using this model. Then, we get accompaniment source by submitting extracted vocal source from mixture in waveform. On the other hand, M2 uses 0.0, which means we extract only accompaniment source using this model. Then, we get vocal source as the same way in M1 . M3 uses 0.5, which means we extract vocal source M1 M2 M3 M4 C1 Med. 5.93 0.68 5.79 5.90 4.46 MAD 6.11 6.96 6.14 6.16 3.21 Mean 2.50 -2.32 2.28 2.45 0.65 V oc. SD 11.09 9.90 11.00 11.09 13.67 Med. 11.43 11.82 11.93 11.67 10.69 MAD 5.01 5.49 5.18 5.13 3.15 Mean 13.47 13.47 13.36 12.85 11.85 Acc. SD 8.49 7.37 7.09 6.66 7.03 T able 1 . The results of singing voice separation from first output channel and accompaniment source from second output channel. Finally , M4 uses 0.707, which is the weight balancing between vocal and accompaniment. This value is calculated in wa veform. First, we calculate the mean of 2-norm of vocal training set and accompaniment training set respectiv ely . W e get the α value using this formula; α ∗ (the mean of 2-norm of vocal) = (1 − α ) ∗ (the mean of 2-norm of accompaniment). The reason why the weight of vocal source is greater is because vocal has smaller volume of sound than accompaniment. The balancing weight will help the sources that hav e small volume to be separated better than before. The results of singing voice separation are shown in T a- ble 1. Because each of M1 and M2 aims to extract vocal and accompaniment source respectively , it can be seen that M1 shows best score in vocal separation, and M2 shows almost best score in accompaniment separation compared to others. And we can see that the score of vocal source separation of M4 has increased compared to M3 . This is because the bal- ancing weight enhances the vocal source separation. 3.2. Multi-instrument Separation For multi-instrument separation, we make 2 different models according to α 0 s in the loss function. M5 uses [0.25, 0.25, 0.25, 0.25], which means we extract each source using the same weights. On the other hand, M6 uses [0.297, 0.262, 0.232, 0.209], which means we e xtract each source using bal- ancing weights. The way to get balancing weights is the same as singing voice separation case; First, we calculate the ra- tio between α 0 s using α 1 ∗ (the mean of 2-norm of vocal) = α 2 ∗ (the mean of 2-norm of drum) = α 3 ∗ (the mean of 2-norm of bass) = α 4 ∗ (the mean of 2-norm of other), then get exact values using α 1 + α 2 + α 3 + α 4 = 1 . From this balanc- ing weights, we can infer con versely that other is the biggest source and vocal is the smallest source. The results of multi-instrument separation are sho wn in T able 2. Since M5 and M6 separate each four sources, the scores of vocal source separation are lo wer than singing v oice separation. In result of M6 using balancing weights, we can see that the separation scores of vocal, drum, and even bass, which have relatively lower sound v olume than other , ha ve M5 M6 C2 Med. 5.32 5.40 3.00 MAD 5.95 5.89 2.76 Mean 1.99 2.11 -2.10 V ocal SD 10.49 10.40 15.41 Med. 4.84 5.05 4.15 MAD 4.60 4.46 1.99 Mean 4.13 4.34 2.88 Drum SD 6.59 6.31 7.68 Med. 2.44 2.66 2.91 MAD 5.55 5.53 2.47 Mean 0.96 1.14 -0.30 Bass SD 7.89 7.88 13.50 Med. 2.70 2.54 2.03 MAD 4.00 4.00 1.64 Mean 2.34 2.06 1.68 Other SD 6.00 5.85 6.14 T able 2 . The results of multi-instrument separation increased compared to M5 . It can be seen that the balanc- ing weights adjust the ratio between several sources to some extent. 3.3. Comparison with Others Using MUSDB18 W e compare ours with others reported in [17]. A various methods are used for enhancing performance; additional 800 songs for training [11, 18], data augmentation tech- niques such as random scaling and mixing with musdb18 [11, 18, 19, 20], and Wiener filter as a post-processing [11, 18, 19]. W e make models without any method men- tioned above. W e bring the results C1 in T able 1 and C2 in T able 2 from [20]. Since they used random scaling only for data augmentation, it is the most suitable for comparison. These results sho w that our model outperforms this model except a bass source on a multi-instrument separation task. 4. CONCLUSION W e propose an intuiti ve Spectr ogram-Channels U-Net view- ing each channel of output as the spectrogram of each source directly . The proposed model can be adapted for both separa- tion tasks by only changing the number of output channels. In addition, to consider the balance between sources, we use an weighted loss function by calculating the means of 2-norm on each source training set. Finally , we ev aluate our model and earn comparable results on both tasks without data augmenta- tion and post-processing. For future w ork, we will in vestigate other balancing ways besides the proposed balancing method, or 2-norm mean. By adapting more appropriate a balancing method, we could get better sound source separation. 5. REFERENCES [1] T uomas V irtanen, “Monaural sound source separation by nonnegati ve matrix factorization with temporal con- tinuity and sparseness criteria, ” IEEE transactions on audio, speech, and languag e pr ocessing , vol. 15, no. 3, pp. 1066–1074, 2007. [2] Dawen Liang, Matthe w D Hoffman, and Daniel PW El- lis, “Beta process sparse nonnegati ve matrix factoriza- tion for music., ” in ISMIR , 2013, pp. 375–380. [3] Nathan Souvira ` a-Labastie, Emmanuel V incent, and Fr ´ ed ´ eric Bimbot, “Music separation guided by cov er tracks: Designing the joint nmf model, ” in Acoustics, Speech and Signal Pr ocessing (ICASSP), 2015 IEEE In- ternational Confer ence on . IEEE, 2015, pp. 484–488. [4] Alexe y Ozerov , Pierrick Philippe, Frdric Bimbot, and Rmi Gribon val, “ Adaptation of bayesian models for single-channel source separation and its application to voice/music separation in popular songs, ” IEEE T rans- actions on Audio, Speech, and Language Processing , vol. 15, no. 5, pp. 1564–1578, 2007. [5] Po-Sen Huang, Scott Deeann Chen, Paris Smaragdis, and Mark Hasegawa-Johnson, “Singing-voice separa- tion from monaural recordings using robust principal component analysis, ” in Acoustics, Speech and Signal Pr ocessing (ICASSP), 2012 IEEE International Confer- ence on . IEEE, 2012, pp. 57–60. [6] Emad M Grais, Mehmet Umut Sen, and Hakan Erdo- gan, “Deep neural networks for single channel source separation, ” in Acoustics, Speech and Signal Pr ocess- ing (ICASSP), 2014 IEEE International Conference on . IEEE, 2014, pp. 3734–3738. [7] Alex Krizhevsky , Ilya Sutskev er , and Geoffre y E Hin- ton, “Imagenet classification with deep conv olutional neural networks, ” in Advances in neural information pr ocessing systems , 2012, pp. 1097–1105. [8] Andreas Jansson, Eric Humphrey , Nicola Montecchio, Rachel Bittner , Aparna Kumar , and T illman W eyde, “Singing voice separation with deep u-net conv olutional networks, ” 2017. [9] Olaf Ronneberger , Philipp Fischer , and Thomas Brox, “U-net: Con volutional networks for biomedical image segmentation, ” in International Confer ence on Med- ical image computing and computer -assisted interven- tion . Springer , 2015, pp. 234–241. [10] Po-Sen Huang, Minje Kim, Mark Hasegaw a-Johnson, and Paris Smaragdis, “Singing-voice separation from monaural recordings using deep recurrent neural net- works., ” in ISMIR , 2014, pp. 477–482. [11] Naoya T akahashi, Nabarun Goswami, and Y uki Mit- sufuji, “Mmdenselstm: An efficient combination of con volutional and recurrent neural networks for audio source separation, ” arXiv preprint , 2018. [12] Ian Goodfellow , Jean Pouget-Abadie, Mehdi Mirza, Bing Xu, David W arde-Farley , Sherjil Ozair , Aaron Courville, and Y oshua Bengio, “Generativ e adversar- ial nets, ” in Advances in neural information pr ocessing systems , 2014, pp. 2672–2680. [13] Santiago Pascual, Antonio Bonafonte, and Joan Serra, “Segan: Speech enhancement generativ e adversarial network, ” arXiv pr eprint arXiv:1703.09452 , 2017. [14] Zhe-Cheng Fan, Y en-Lin Lai, and Jyh-Shing Roger Jang, “Svsgan: Singing voice separation via generati ve adversarial network, ” arXiv preprint , 2017. [15] Zafar Rafii, Antoine Liutkus, Fabian-Robert Stter , Stylianos Ioannis Mimilakis, and Rachel Bittner, “The MUSDB18 corpus for music separation, ” Dec. 2017. [16] Emmanuel V incent, R ´ emi Gribon val, and C ´ edric F ´ evotte, “Performance measurement in blind audio source separation, ” IEEE transactions on audio, speech, and language pr ocessing , v ol. 14, no. 4, pp. 1462–1469, 2006. [17] Fabian-Robert St ¨ oter , Antoine Liutkus, and Nobutaka Ito, “The 2018 signal separation e valuation campaign, ” in International Confer ence on Latent V ariable Analysis and Signal Separation . Springer , 2018, pp. 293–305. [18] Stefan Uhlich, Marcello Porcu, Franck Giron, Michael Enenkl, Thomas Kemp, Naoya T akahashi, and Y uki Mitsufuji, “Improving music source separation based on deep neural networks through data augmentation and network blending, ” in Acoustics, Speech and Signal Pr ocessing (ICASSP), 2017 IEEE International Confer- ence on . IEEE, 2017, pp. 261–265. [19] Jen-Y u Liu and Y i-Hsuan Y ang, “Denoising auto- encoder with recurrent skip connections and residual re- gression for music source separation, ” arXiv preprint arXiv:1807.01898 , 2018. [20] Daniel Stoller, Sebastian Ewert, and Simon Dixon, “W av e-u-net: A multi-scale neural network for end- to-end audio source separation, ” arXiv preprint arXiv:1806.03185 , 2018.
Original Paper
Loading high-quality paper...
Comments & Academic Discussion
Loading comments...
Leave a Comment