mQAPViz: A divide-and-conquer multi-objective optimization algorithm to compute large data visualizations
Algorithms for data visualizations are essential tools for transforming data into useful narratives. Unfortunately, very few visualization algorithms can handle the large datasets of many real-world scenarios. In this study, we address the visualization of these datasets as a Multi-Objective Optimization Problem. We propose mQAPViz, a divide-and-conquer multi-objective optimization algorithm to compute large-scale data visualizations. Our method employs the Multi-Objective Quadratic Assignment Problem (mQAP) as the mathematical foundation to solve the visualization task at hand. The algorithm applies advanced sampling techniques originating from the field of machine learning and efficient data structures to scale to millions of data objects. The algorithm allocates objects onto a 2D grid layout. Experimental results on real-world and large datasets demonstrate that mQAPViz is a competitive alternative to existing techniques.
💡 Research Summary
**
The paper “mQAPViz: A divide‑and‑conquer multi‑objective optimization algorithm to compute large data visualizations” tackles the growing challenge of visualizing massive datasets that exceed the capacity of traditional dimensionality‑reduction and layout techniques. The authors reformulate the visualization task as a Multi‑Objective Optimization Problem (MOP) and introduce a novel framework called mQAPViz that leverages the Multi‑Objective Quadratic Assignment Problem (mQAP) as its mathematical core.
In the mQAP formulation, each data object must be assigned to a position on a two‑dimensional grid. The cost of an assignment is defined as the product of a distance term (the Euclidean distance between two grid positions) and a flow term (a similarity‑based weight between the corresponding objects). Unlike the classic QAP, mQAP simultaneously minimizes k different flow matrices, producing a Pareto front of solutions that balance multiple criteria such as similarity preservation and spatial compactness.
Directly solving mQAP for millions of objects would be computationally prohibitive (cubic or higher complexity). To overcome this, the authors devise a divide‑and‑conquer strategy composed of three main stages:
-
Construction of a k‑Nearest‑Neighbour Graph (k‑NNG).
Using a set of Random Projection Trees (RPTs), an initial approximate k‑NNG is built in O(n log n) time. An iterative refinement process (“neighbor of my neighbor”) improves the graph’s accuracy while keeping the computational cost linear in the number of points. -
Negative Sampling and Sub‑instance Generation.
From the full k‑NNG, a fraction pₛ of vertices is selected via negative sampling, a technique borrowed from language‑model training that preferentially samples low‑degree nodes. For each sampled vertex vₛ, its k‑nearest neighbours define a local region. A 50 × 50 rectangular grid (2 500 positions) is placed over this region, and an mQAP sub‑problem is instantiated using the objects inside the region and the corresponding distance/flow matrices. -
Parallel Optimization of Sub‑problems (P‑asMoQAP).
Each sub‑instance is solved independently by P‑asMoQAP, a parallel asynchronous memetic algorithm. P‑asMoQAP combines evolutionary operators (crossover, mutation) with local search heuristics, maintaining a population of candidate solutions that evolve toward the Pareto front. Because sub‑instances are independent, they can be processed on multiple cores with near‑linear speed‑up.
After all sub‑instances are optimized, a merging step aggregates the individual layouts into a global 2‑D visualization. The initial layout for the whole dataset is obtained using LargeVis, a scalable approximation of t‑SNE that already provides a reasonable embedding. The mQAP‑based refinement then improves the placement of sampled regions while preserving the overall structure.
Experimental Evaluation
The authors evaluate mQAPViz on several real‑world datasets ranging from 100 k to 2 M points, including image feature vectors, text embeddings, and biological networks. They compare against t‑SNE (the de‑facto standard) and LargeVis (the baseline for large‑scale visualizations). Metrics include:
- Preservation of local neighbourhoods (k‑NN recall).
- KL‑divergence between high‑dimensional and low‑dimensional similarity distributions.
- Runtime on a commodity multi‑core workstation.
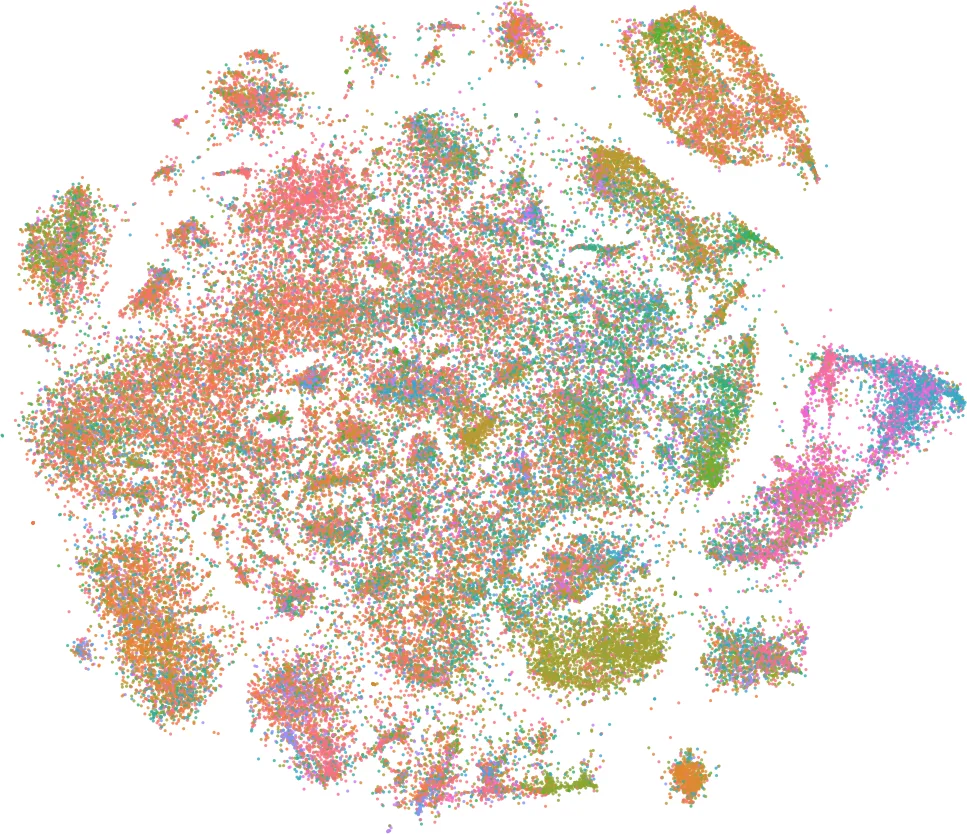
Results show that mQAPViz achieves comparable or better neighbourhood preservation and lower KL‑divergence than t‑SNE, while requiring orders of magnitude less time on datasets larger than 500 k points. For a 2 M‑point dataset, mQAPViz completes in under 30 minutes, whereas t‑SNE would take several hours or be infeasible. Visual inspection confirms that clusters are well separated and that the multi‑objective formulation allows users to trade off between compactness and separation by adjusting flow weights.
Contributions and Significance
- First formulation of large‑scale data visualization as a multi‑objective quadratic assignment problem.
- A scalable pipeline combining Random Projection Trees, negative sampling, and a parallel memetic optimizer.
- Demonstrated competitiveness with state‑of‑the‑art methods on both quantitative and qualitative grounds.
Future Directions suggested by the authors include automatic learning of flow matrices from data, incremental updates for streaming scenarios, and extensions to three‑dimensional or non‑rectangular layouts.
In summary, mQAPViz introduces a fresh optimization‑centric perspective on visual analytics, offering a practical solution for interactive exploration of massive datasets on standard hardware, and opening new research avenues at the intersection of combinatorial optimization, machine learning, and information visualization.
Comments & Academic Discussion
Loading comments...
Leave a Comment