A multi-device dataset for urban acoustic scene classification
This paper introduces the acoustic scene classification task of DCASE 2018 Challenge and the TUT Urban Acoustic Scenes 2018 dataset provided for the task, and evaluates the performance of a baseline system in the task. As in previous years of the cha…
Authors: Annamaria Mesaros, Toni Heittola, Tuomas Virtanen
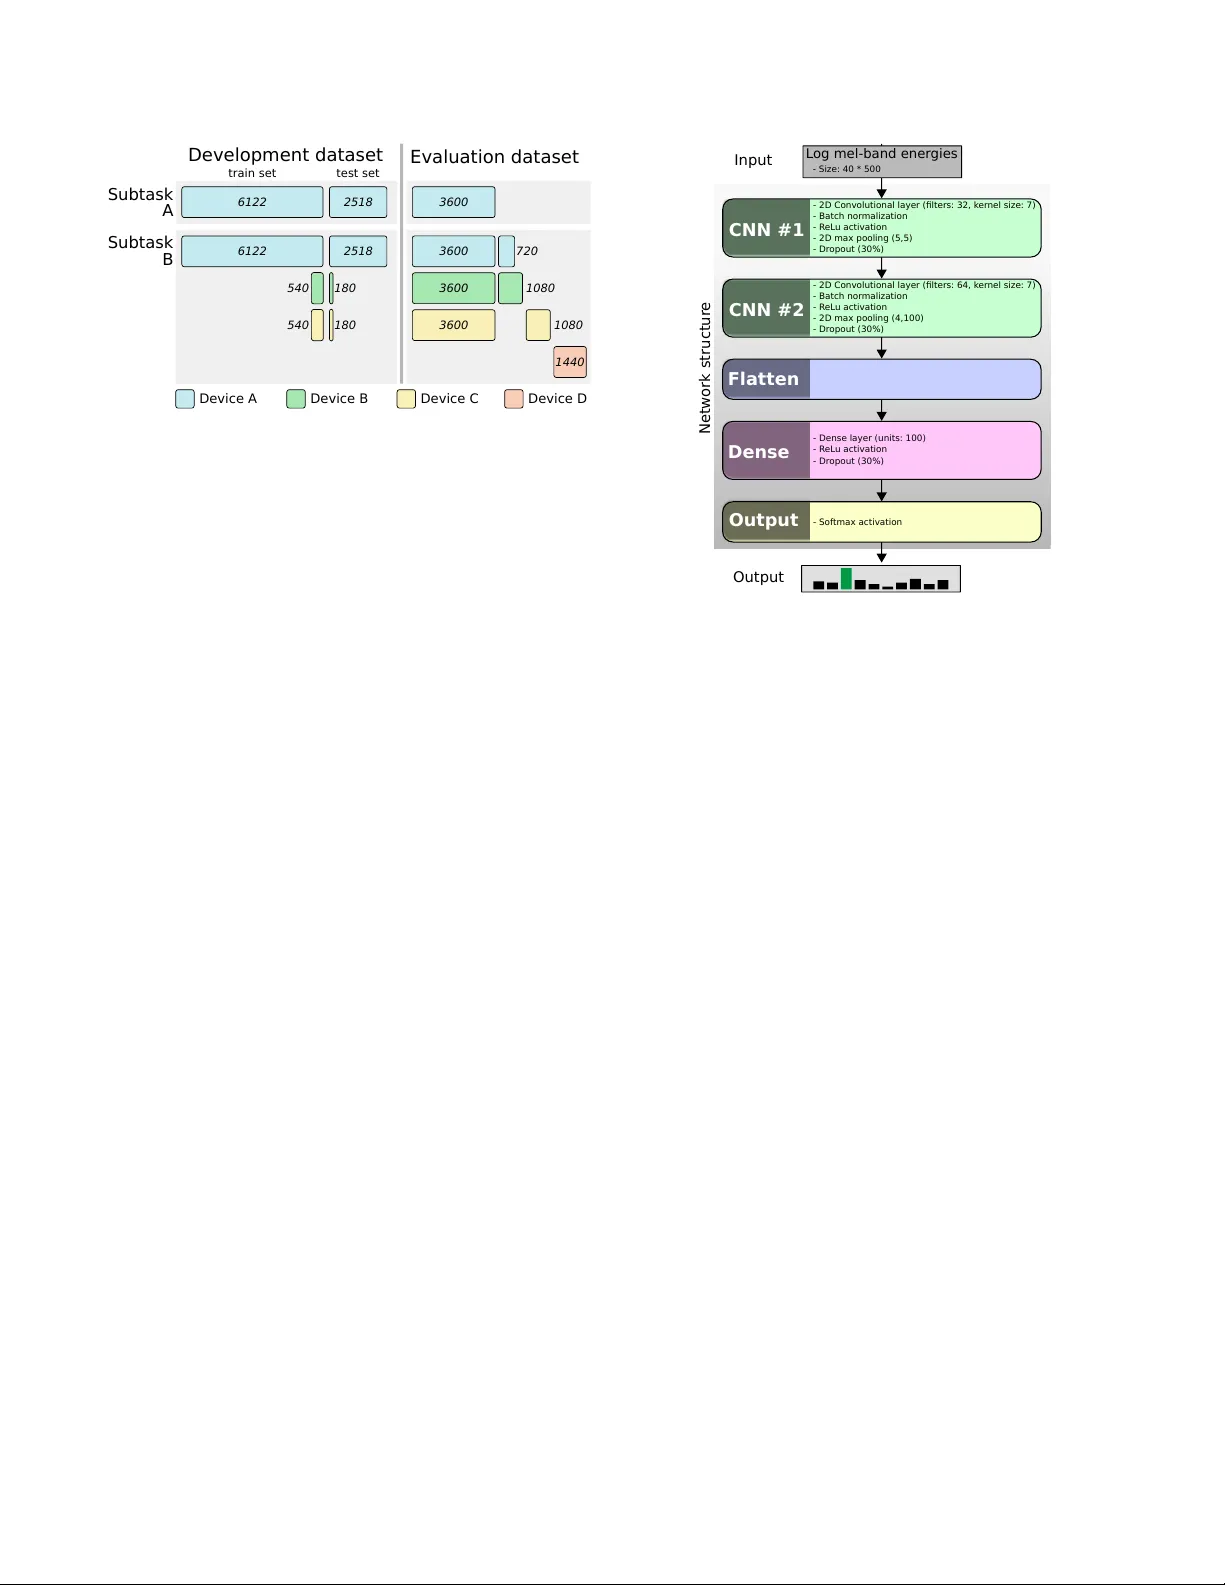
Detection and Classification of Acoustic Scenes and Events 2018 19-20 November 2018, Surre y , UK A MUL TI-DEVICE D A T ASET FOR URB AN A COUSTIC SCENE CLASSIFICA TION Annamaria Mesar os, T oni Heittola, T uomas V irtanen ∗ T ampere Univ ersity of T echnology , Laboratory of Signal Processing, T ampere, Finland { annamaria.mesaros, toni.heittola, tuomas.virtanen } @tut.fi ABSTRA CT This paper introduces the acoustic scene classification task of DCASE 2018 Challenge and the TUT Urban Acoustic Scenes 2018 dataset provided for the task, and e valuates the performance of a baseline system in the task. As in previous years of the challenge, the task is defined for classification of short audio samples into one of predefined acoustic scene classes, using a supervised, closed- set classification setup. The newly recorded TUT Urban Acoustic Scenes 2018 dataset consists of ten dif ferent acoustic scenes and was recorded in six large European cities, therefore it has a higher acoustic v ariability than the pre vious datasets used for this task, and in addition to high-quality binaural recordings, it also includes data recorded with mobile devices. W e also present the baseline system consisting of a con v olutional neural netw ork and its performance in the subtasks using the recommended cross-validation setup. Index T erms — Acoustic scene classification, DCASE chal- lenge, public datasets, multi-device data 1. INTR ODUCTION Acoustic Scene Classification is a regular task in the Detection and Classification of Acoustic Scenes and Events (DCASE) challenge series, being present in each of its editions up until now . The stan- dard setup of the task as a basic multiclass classification problem makes the task easily approachable also for the beginner in this field, resulting in large number of participants in the previous DCASE challenges. In the first three editions of the challenge, the acoustic scene classification task has received the highest number of submis- sions among the a vailable tasks, with 17 submissions in 2013 [1], 48 submissions in 2016 [2], and 97 submissions in 2017 [3]. Each consecuti ve edition of the challenge has brought a new and larger dataset than pre vious edition, facilitating use of recent machine learning techniques using deep neural networks that rely on large amounts of data for training. In 2013, the acoustic scene classification task used a development dataset consisting of 10 acoustic scenes each with 10 examples of 30 s, and an e valuation dataset of the same size [1, 4]. In 2016, 15 scene classes were used, each with 78 examples of of 30 s in the development set, and 26 examples per class in the ev aluation set [2]. This dataset offered higher acoustic v ariability than before through its higher number of classes, recording locations and amount of data, and it was the first suitable for use of deep learning methods. In DCASE 2017, the acoustic scene classification task was made more dif ficult by using 10 s audio segments, by re-se gmenting the complete data av ailable in 2016 (both development and ev alua- tion sets), having 312 se gments of 10 s per scene class. A ne w e val- uation dataset was recorded in similar locations approximately one ∗ This work has recei ved funding from the European Research Council under the ERC Grant Agreement 637422 EVER YSOUND. year later than the dev elopment data, containing 108 segments of 10 s per class. The temporal gap between the recordings created an unexpected mismatch in acoustic conditions, causing a significant drop in performance in all systems between de velopment and eval- uation sets [3]. Outside of DCASE challenge, there are only fe w other publicly av ailable datasets for acoustic scene classification, notably the LITIS dataset [5], containing 19 classes and ha ving ap- proximately 25 hours of audio, recorded using a mobile phone; the Defreville-Aucouturier en vironmental audio dataset [6] with 4 main classes (11 detailed classes) and approximately 4 hours of audio; and the UEA En vironmental noise datasets [7] with 10 classes and approximately 4 hours of audio in 2 series recorded with different devices. Of these, only the LITIS dataset has an adequate size for modern machine learning methods. DCASE 2018 challenge introduces a new dataset for acoustic scene classification, ha ving a number of ten classes and 24 hours of high-quality audio. It has smaller number of classes than data from previous challenges, b ut it is much larger in size and acoustic vari- ability , having been recorded in multiple cities across Europe. This is the lar gest freely av ailable dataset to date, comparable in size to the LITIS dataset, b ut it is the only one having recordings in multi- ple countries, while all other publicly a vailable datasets (within and outside of DCASE) are recorded within a single country or city . At the same time, parallel recordings performed with differ - ent de vices provide additional variability in the channel proper- ties, allo wing an additional subtask for studying the classification problem in mismatched conditions. All previous public e valuations hav e been done in matched conditions, with a single device used for recording all data, including ev aluation data, but in actual us- age scenarios of the methods, channel mismatch could be encoun- tered through device mismatch or difference in recording condi- tions. Other publicly a vailable datasets contain audio recorded with only one type of de vice, with small e xceptions (e.g. [7]) that do not permit a large-scale study of mismatched de vices. A mismatch usu- ally causes a lar ge drop in performance of machine learning based systems, as noticed in DCASE 2017, therefore this new dataset al- lows de velopment of techniques that can cope with the mismatch. This paper presents the subtasks and dataset used for T ask 1 in DCASE 2018. Section 2 presents the data recording procedure. Section 3 introduces the task definition and specific details on the subtasks, while Section 4 gives details on the experimental setup, including database statistics for each subtask. Section 5 presents the baseline system architecture and the results obtained on the pro- vided experimental setup, and Section 6 presents conclusions and future work. 2. D A T A RECORDING PROCEDURE The TUT Urban Acoustic Scenes 2018 dataset was collected dur- ing February-March 2018, containing recordings of ten acoustic scenes, recorded in six lar ge European cities: Barcelona, Helsinki, Detection and Classification of Acoustic Scenes and Events 2018 19-20 November 2018, Surre y , UK London, Paris, Stockholm, and V ienna. Acoustic scenes included are: airport, shopping mall (indoor), metro station (platform, un- derground), pedestrian street, public square, street (medium le vel of traffic), traveling by tram, bus and metro (underground), and ur- ban park. Each scene class was defined beforehand, and suitable locations were selected based on the description. For each city and each scene class, multiple different locations were used to record audio, i.e. dif ferent streets, different metro sta- tions, etc. For each such location there are 5-6 minutes of audio, recorded in 2-3 sessions of few minutes each, with a small tem- poral gap between them. The original recordings were split into segments with a length of 10 seconds that are provided in indi vid- ual files. Recording locations are numbered and used to identify all audio material from the same location when partitioning the dataset for training and testing. The information av ailable in the dataset consists of: acoustic scene class, city , and recording location IDs. Recordings were made using four devices that captured audio simultaneously . The main recording de vice consists in a Soundman OKM II Klassik/studio A3, electret binaural in-ear microphone and a Zoom F8 audio recorder using 48 kHz sampling rate and 24 bit resolution. The microphones were worn in the ears, therefore the recorded audio mimics the sound that reaches the human auditory system of the person wearing the equipment. This equipment is further referred to as device A. At the same time, the audio w as captured using three other mo- bile devices (e.g. smartphones, cameras), resulting in audio record- ings of different quality . W e further refer to these devices as B, C, and D. All simultaneous recordings are time synchronized using Panako acoustic fingerprinting system [8]. The used mobile devices are the following: device B is a Samsung Galaxy S7, device C is IPhone SE, and de vice D is a GoPro Hero5 Session. During record- ing, the Samsung phone was handheld at torso height, the IPhone was worn in a slee ve attached to the strap of a backpack, while the GoPro was mounted on the other strap. The mobile phones recorded single channel audio with a sampling frequency of 44.1 kHz, while the audio recorded by the GoPro is originally stereo, compressed, sampled at 48 kHz. T wo different versions of the dataset were pro vided for system dev elopment, namely TUT Urban Acoustic Scenes 2018, contain- ing only material recorded with device A, and TUT Urban Acoustic Scenes 2018 Mobile, containing material recorded with devices A, B and C. All datasets are freely av ailable. 1 2 3. T ASK DEFINITION Acoustic scene classification is defined as labeling one audio sam- ple as belonging to one of predefined classes associated to acoustic scenes. There are labeled e xample training data a vailable for all the classes, and therefore the task is an e xample of a supervised classi- fication problem, having a closed set of categories, as illustrated in Fig. 1. In the DCASE 2018 acoustic scene classification task there are three subtasks, offering more variety and degree of dif ficulty for the task, and at the same time e xtending the basic task tow ards real- life applications where there may be mismatch between training and ev aluation data recording de vices, or there may be dif ferent sources of training data av ailable. 1 TUT Urban Acoustic Scenes 2018: https://doi.org/10.5281/zenodo.1228142, https://doi.or g/10.5281/zenodo.1293883 2 TUT Urban Acoustic Scenes 2018 Mobile: https://doi.org/10.5281/zenodo.1228235, https://doi.or g/10.5281/zenodo.1293901 Figure 1: Acoustic scene classification example Subtask A : Acoustic Scene Classification is the typical acoustic scene classification task as encountered pre viously , where all data, both dev elopment and ev aluation, are recorded with a high quality device. In this subtask there is no mismatch in recording conditions besides the natural variation of weather , people at the scene, etc, which are not under control of the recorder , but are natural manifes- tations of the recorded scenes. Subtask B : Acoustic Scene Classification with mismatched r ecor ding devices illustrates the problem of creating a system that could be used with multiple de vices that record audio of varying quality . In this subtask there is mismatch in audio channels between the dev elopment and ev aluation sets, which must be accounted for in the system: the training data was recorded with a de vice pro vid- ing high-quality audio, while the ev aluation data w as recorded with multiple de vices, resulting therefore in mismatched audio channel. Some amount of parallel data, which was recorded simultaneously with three devices, w as also av ailable for training. Subtask C breaks away from the previous challenge rules against external data sources and allows use of external data and transfer learning to solve the problem provided in subtask A. In subtasks A and B all the participants have the same data av ailable for system de velopment, putting all participants to an equal starting point. In subtask C, systems may be relying on various sources of data, in any form, to study the possible improvement provided by using more data. As a rule for the challenge, the participants were required to use only external datasets that are publicly a vailable for free, and they were also required to inform the organizers about the external data sources for maintaining a list of such resources on the challenge website. 4. EXPERIMENT AL SETUP The experimental setup is similar for the three subtasks, with the same basic classification problem framed in different ways. In sub- task A, only data from de vice A (high-quality audio) is used, while for subtask B, some data from devices B and C is av ailable as paral- lel recordings. Subtask C allows the use of external data and trans- fer learning, but does not provide any additional data, only indicates some sources of data that could be used. For each subtask, a dev el- opment set was provided, together with a training/test partitioning for system development. Participants were required to report per- formance of their system using this train/test setup in order to allo w comparison of systems on the dev elopment set. The total amount of recorded audio was partitioned into de vel- opment and e valuation subsets, each containing data from all cities and all acoustic scenes. The dev elopment dataset was published when opening the task, provided with full metadata information. The ev aluation dataset was published as audio only; the metadata of Detection and Classification of Acoustic Scenes and Events 2018 19-20 November 2018, Surre y , UK Development datas et Subtask A Subtask B Evaluat ion dataset train set test set 6122 2518 540 540 180 Device A Device B Device C Device D 6122 2518 3600 3600 3600 3600 180 1080 1080 1440 720 Figure 2: Development and e v aluation data amounts. this part is kept secret, and the e valuation of systems is performed by the task organizers, based on the predicted scene labels that par- ticipants hav e to submit when participating the challenge. 4.1. Dev elopment datasets TUT Urban Acoustic Scenes 2018 development dataset consists of recordings from all six cities, having 864 segments for each acoustic scene (144 minutes of audio). The total size of the dataset is 8640 segments of 10 seconds length, i.e. 24 hours of audio. The dataset is further partitioned into training and test subsets such that the train- ing subset contains audio from approximately 70% of recording lo- cations of each city and each class. Of the total 8640 segments, 6122 segments were included in the training subset and 2518 seg- ments in the test subset. More details on the number of segments from each location are provided in the documentation of the dataset. TUT Urban Acoustic Scenes Mobile 2018 development dataset contains the same recordings as TUT Urban Acoustic Scenes 2018 and, in addition, two hours of parallel data recorded with devices B and C. Therefore the dataset contains 2 hours of data recorded with all three devices (A, B and C). The amount of data is as follows: • Device A: 24 hours (8640 segments, 864 se gments per scene) • Device B: 2 hours (720 segments, 72 se gments per scene) • Device C: 2 hours (720 segments, 72 se gments per scene) In this dataset, the data from de vice A which is originally binaural, was resampled to 44.1 kHz and av eraged into a single channel, to align with the properties of the data recorded with de vices B and C. The dataset contains in total 28 hours of audio. The training/test partitioning was done same as for TUT Urban Acoustic Scenes 2018, with approximately 70% of recording loca- tions for each city and each scene class included to the training sub- set, considering only device A. The training subset contains 6122 segments from de vice A, 540 se gments from device B, and 540 se g- ments from device C. The test subset contains 2518 segments from device A, 180 se gments from device B, and 180 segments from de- vice C. The data partitioning is illustrated in Fig. 2. 4.2. Evaluation datasets TUT Urban Acoustic Scenes 2018 ev aluation dataset contains au- dio examples from locations different that the ones in the devel- opment dataset. The dataset contains 3600 segments, therefore 10 hours of audio material, all recorded with device A. In the DCASE CNN #1 CNN #2 Flat ten Dense L og mel-band en er gies - 2D Con volutional layer ( fi lters: 32, k er nel size: 7) - Batch nor malization - R eL u ac tivation - 2D max pooling (5,5) - Dr opout (30% ) - 2D Con volutional layer ( fi lters: 64, k er nel size: 7) - Batch nor malization - R eL u ac tivation - 2D max pooling (4,100) - Dr opout (30% ) - Dense layer (un its: 1 00) - R eL u ac tivation - Dr opout (30% ) Outpu t - Sof tmax a ctivation - Size: 4 0 * 500 Network stru ctur e Input Output Figure 3: Baseline system architecture. Challenge, systems will be ranked based on classification accuracy for the evaluation dataset, calculated as class-wise average. The dataset is balanced at class level, ha ving a number of 360 segments per scene, being as balanced as possible at city lev el too, with 72 segments per scene per city when possible. There are only few exceptions, notably Barcelona airport being available only in the dev elopment set. TUT Urban Acoustic Scenes Mobile 2018 ev aluation dataset contains 42 hours of data, recorded with all four devices. The data recorded with device A was resampled and con verted to single chan- nel, just as in the development dataset. The dataset contains 3600 segments of parallel data from devices A, B and C, 360 segments of non-parallel data each from devices B and C, and 1440 se gments from de vice D. T o create more di versity and pre vent guessing of device specific segments, there are an additional 720 non-parallel segments from devices A, B and C, whose sole purpose is to create a non-balanced set, i.e. these segments will not be ev aluated. Ranking of the systems will be done based on classification ac- curacy only on audio recorded with devices B and C. Data from device A will be used for comparison with subtask A performance, while data from device D, which w as not encountered at all in train- ing, will be used to analyze performance on completely unseen de- vices. No information about device identity was provided with the segments, in order to force generalization and av oid tuning the sys- tems tow ards the specific devices. 5. B ASELINE SYSTEM RESUL TS The baseline system implements a con volutional neural network- based approach (CNN). The architecture of the network is based on one top ranked submission from DCASE 2016 [9], with added batch normalization and changes to layer sizes. This approach aims to implement a popular solution based on previous challenges, and to offer a satisf actory performance for the task. For each 10-second audio file, log mel-band energies were first extracted in 40 bands using an analysis frame of 40 ms with a 50% hop size. The neural network consists of two CNN layers and one fully connected layer , and uses an input of size 40x500, equiv alent Detection and Classification of Acoustic Scenes and Events 2018 19-20 November 2018, Surre y , UK T able 1: Baseline system results for acoustic scene classification, subtasks A and B in DCASE 2018 challenge. In subtask B, ranking is done by av erage performance on data from devices B and C. De vice ID is indicated per column for subtask B. Subtask A Acoustic Scene Dev set Eval set Airport 72.9 55.3 Bus 62.9 66.1 Metro 51.2 60.8 Metro station 55.4 52.8 Park 79.1 79.4 Public square 40.4 33.9 Shopping mall 49.6 64.2 Street, pedestrian 50.0 55.3 Street, traffic 80.5 81.9 T ram 55.1 60.0 A verage 59.7 61.0 ( ± 0.7) Subtask B Dev elopment set Evaluation set B C avg (B,C) A B C avg (B,C) A D 68.9 76.1 72.5 73.4 65.8 59.4 62.6 66.8 1.4 70.6 86.1 78.3 56.7 50.5 69.5 60.0 76.1 19.4 23.9 17.2 20.6 46.6 50.2 40.4 45.3 61.9 54.2 33.8 31.7 32.8 52.9 37.4 44.9 41.2 58.0 65.3 67.2 51.1 59.2 80.8 58.6 63.0 60.8 82.9 6.9 22.8 26.7 24.7 37.9 17.0 16.5 16.7 24.3 0.7 58.3 63.9 61.1 46.4 49.2 55.4 52.3 62.2 78.5 16.7 25.0 20.8 55.5 35.8 27.3 31.5 53.8 0.0 69.4 63.3 66.4 82.5 69.2 69.9 69.5 83.1 25.7 18.9 20.6 19.7 56.5 41.3 30.9 47.6 63.6 22.9 45.1 46.2 45.6 58.9 47.5 47.7 47.6 63.6 27.5 ( ± 3.6) ( ± 4.2) ( ± 3.6) ( ± 0.8) airport bus metro met stn park pub sq mall st ped st trf tram airport bus metro met stn park pub sq mall st ped st trf tram 55 24 14 66 12 16 12 61 12 13 53 12 79 14 11 34 33 13 21 64 21 55 82 19 11 60 Figure 4: Confusion matrix for subtask A. Evaluation set to the full length of the segment to be classified. The network was trained using Adam optimizer [10] with a learning rate of 0.001. The system architecture is presented in Fig. 3, including details of each layer . The model selection was done using a validation set consisting of approximately 30% of the original training data, selected such that training and v alidation sets do not hav e segments from the same location, and both sets ha ve data from each city . The model performance was e valuated on the v alidation set after each epoch, and the best performing model was selected. T able 1 presents the baseline system results for subtasks A and B, both on dev elopment set and e valuation sets. In the dev elopment stage, the system was trained and tested 10 times using the provided training/test split to account for the effect of random weight initial- ization in training; the mean and standard deviation of individual performance from these 10 independent trials is presented in the table as de velopment set performance. On subtask A, system per- formance on the development set is 59.7%, with class-wise results varying from 40.4% to 80.5%. The system generalizes rather well, having a performance of 61% on the ev aluation set. By comparing system performance on individual scene classes, we note that most scenes have very similar performance for the two sets - bus, metro station,park street with traffic. The most difficult class to recognize is public square, with the lo west performance in development set and ev en lower (33.9) in ev aluation set, while the best performance of ov er 80% is obtained for the street with traf fic scene. The confu- sion matrix is presented in Fig. 4. For subtask B, the system was trained using only the audio material from device A (6122 segments of high-quality audio) to highlight the problem of mismatched recording devices. No addi- tional techniques for dealing with the mismatch was used, in or- der to av oid influencing the challenge participants in their choice of method. T est subset results are presented separately for each de- vice (2518 segments from device A, 180 segments from device B, 180 segments from device C); average of devices B and C is high- lighted, as this is the official ranking measure in the challenge. Here too the system was trained and tested 10 times using the provided training/test split. System performance on data from device A, same as its training data, is 58.9%, comparable with the performance in subtask A. On devices B and C, the system performs similarly , with an over 10% gap to device A, clearly showing the device mismatch. The system has a similar behavior on the ev aluation set, with a performance of 63.6% for device A and 47.6% av erage on devices B and C, a sign of good generalization and consistent behavior . Performance on device D is v ery lo w , with a very large gap e ven to devices B and C. The one important characteristic of de vice D is that it provides audio in compressed format, which may be the cause of such extreme mismatch. Class-wise performance is mostly similar between dev elopment and ev aluation sets for all devices, with the performance gap still present between de vices even when the dev elopment and ev aluation performance for same device is significantly dif ferent: for example metro with 20% (de vices B,C) and 46% (de vice A) in dev elopment, increasing to 45% and 61%, respectiv ely , in ev aluation set. 6. CONCLUSIONS The acoustic scene classification within DCASE 2018 challenge offers participants three interesting subtasks, each with own re- search question. In subtask A, the same classification problem is approached for a dataset with a much larger size and acoustic vari- ability than before, subtask B calls for solutions to the device mis- match problem, while subtask C allows use of external resources such as data and transfer learning for increasing classification per- formance. The datasets are freely av ailable and not limited for use within the challenge, and will be extended in the future to include more cities and possibly other acoustic scene classes, to further in- crease task complexity through acoustic variability and allow other challenging research questions, such as training with unbalanced data, or open set classification. Detection and Classification of Acoustic Scenes and Events 2018 19-20 November 2018, Surre y , UK 7. REFERENCES [1] D. Stowell, D. Giannoulis, E. Benetos, M. Lagrange, and M. D. Plumbley , “Detection and classification of acoustic scenes and events, ” IEEE T rans. on Multimedia , vol. 17, no. 10, pp. 1733–1746, October 2015. [2] A. Mesaros, T . Heittola, E. Benetos, P . Foster , M. Lagrange, T . V irtanen, and M. D. Plumbley , “Detection and classification of acoustic scenes and events: Outcome of the dcase 2016 challenge, ” IEEE/ACM T ransactions on A udio, Speech, and Language Pr ocessing , vol. 26, no. 2, pp. 379–393, Feb 2018. [3] A. Mesaros, T . Heittola, and T . V irtanen, “ Acoustic scene clas- sification: an ov erview of dcase 2017 challenge entries, ” in 16th International W orkshop on Acoustic Signal Enhancement (IW AENC) , 2018. [4] D. Barchiesi, D. Giannoulis, D. Stowell, and M. Plumbley , “ Acoustic scene classification: Classifying en vironments from the sounds they produce, ” IEEE Signal Processing Magazine , vol. 32, no. 3, pp. 16–34, May 2015. [5] A. Rakotomamonjy and G. Gasso, “Histogram of gradients of time-frequency representations for audio scene classification, ” IEEE/A CM T rans. Audio, Speech and Lang. Pr oc. , v ol. 23, no. 1, pp. 142–153, Jan. 2015. [6] J.-J. Aucouturier, B. Defreville, and F . Pachet, “The bag-of- frames approach to audio pattern recognition: A sufficient model for urban soundscapes b ut not for polyphonic music, ” The Journal of the Acoustical Society of America , vol. 122, no. 2, pp. 881–891, 2007. [7] L. Ma, D. J. Smith, and B. P . Milner , “Context awareness using en vironmental noise classification. ” in INTERSPEECH . ISCA, 2003. [8] J. Six and M. Leman, “Panako: a scalable acoustic finger- printing system handling time-scale and pitch modification, ” in International Society for Music Information Retrieval, Pr oceedings , H.-M. W ang, Y .-H. Y ang, and Y . H. Lee, Eds., vol. Proceedings of the 15th Conference of the International Society for Music Information Retrie v al (ISMIR 2014), 2014, p. 6. [Online]. A vailable: http://www .terasoft.com.tw/conf/ ismir2014/proceedings/T048 122 Paper .pdf [9] M. V alenti, S. Squartini, A. Diment, G. Parascandolo, and T . V irtanen, “ A con v olutional neural network approach for acoustic scene classification, ” in 2017 International Joint Confer ence on Neural Networks (IJCNN) , May 2017, pp. 1547–1554. [10] D. P . Kingma and J. Ba, “ Adam: A method for stochastic opti- mization, ” in Pr oceedings of the 3r d International Conference on Learning Repr esentations (ICLR) , 2014.
Original Paper
Loading high-quality paper...
Comments & Academic Discussion
Loading comments...
Leave a Comment