A Visual Query System for Scholar Networks
Large scholar networks is quite popular in the academic domain, like Aminer. It offers to display the academic social network, including profile search, expert finding, conference analysis, course search, sub-graph search, topic browser, academic ran…
Authors: Hongze Li
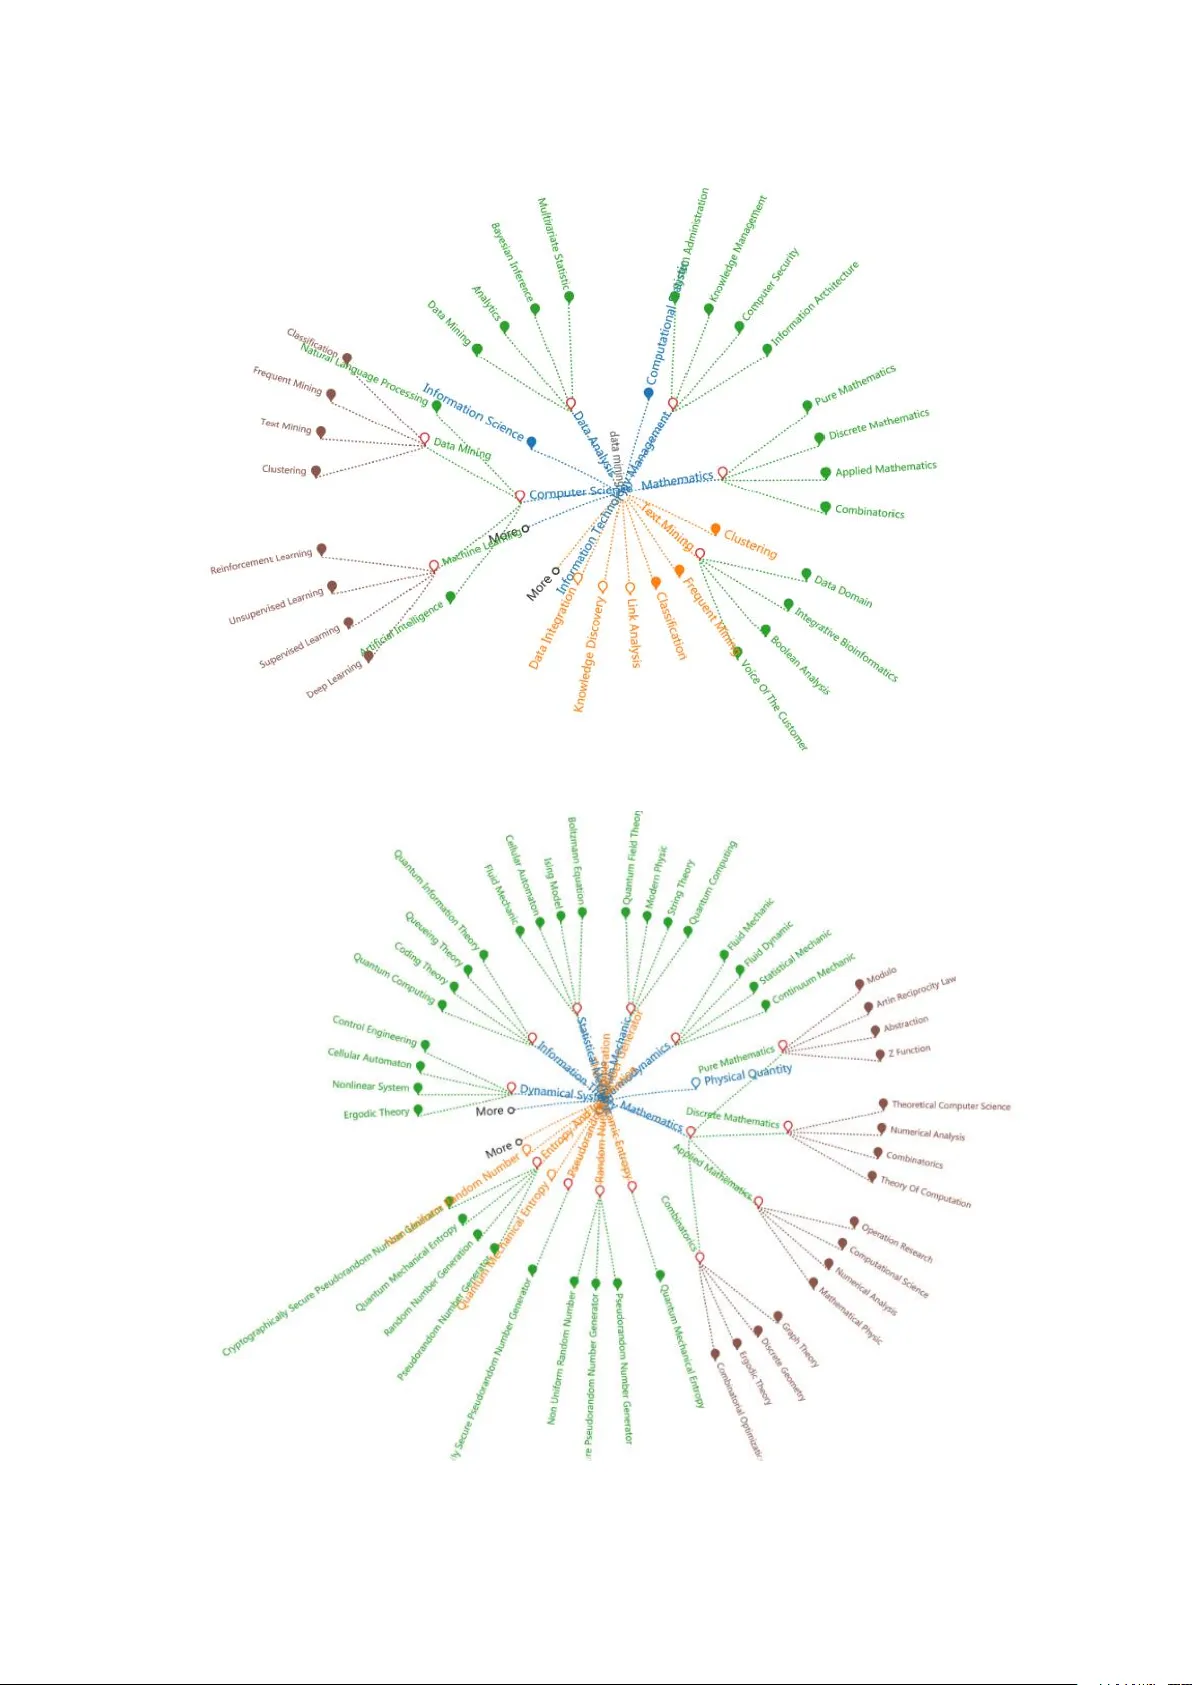
A Visual Query Sy stem for Scho lar Networks Hongze Li 1 1 Lhongze@hotmail .com Abstract : Large sc holar netwo rks is quite p opular in the academic domain, like Aminer. It o ffers to display the acad emic soc ial networ k, in cludin g pro file search, expert findin g, confe rence analysis, course search, sub -graph search, topic browser, academic r anks and user management. Usually the searc h results are listed as ite ms, while the r elations among them are hidde n to the user s. Visua lizatio n is a feasible way to help user s explor e the hidden relations and discover more us eful information. This article aim to visualize the search results in Aminer in a more user-friendly w ay and help them better utilize the tool. W e provided three d ifferent designs to visualiz e the re sults and tested them in us er stu dy. The empirica l results of our r esearch show that the designed gra phs help users better understand the area they intend to know and make their search more effective. Keywords: Network; Graph; Visua lization; Query 1. Introduction 1.1. Research Background introduction With the acceler ation of peo ple’s living rhythm and the increase of socia l co mplexity, more and more data are appearing in our sights. These data come from life as well as life. People also pay more and more attentio n to the impor tance of research data. Nece ssity, b ut the for m o f the d ata looks complicated and cumb ersome, can not properly grasp the data features and data descript ion of the problem, no doubt, through visualizatio n [ 1], will be displayed d irectly to our data list into a v isual image of people ca n feel, symbols, colors, textures, etc., enhance the efficien cy of id entifying large amounts o f data. I t is a goo d way to visualize data in front of our eyes and it is also easy to cap ture information that the data wants to convey to us. Information visualiza tion is clo sely related to human perception and human behavior, espe cially human interactio n[2]. The development of the I nternet makes search engines become the most important means for u sers to find informatio n, and accurate and rapid is the us er’s most impo rtant requirement f or search engin es. The original search engine and r etrieval system are only displayed to the user in the f orm of a list according to the results required by the user. The lack of interac tion and lack of intuition can not find the relationship between the search results, let alone the search process Interesting. 1.2. Res earch content introduction Today’s visualization has penetrate d into a ll fields, and la rge scholar networks are very popular in the academic field. It pro vides a d isplay of acad emic social netwo rks[3] including p rofile search, exp ert discovery, meeting analysis, course sea rch, topic browser, acad emic r anking and user man agement. Based on the sear ch engine[ 4], we can more easily obtain the informati on o f the sch olars. The query results are typically listed as items, to describ e the exp ertise of each schola r and their academic performanc e. However, the schola r netw ork s typically c onsist o f mil lions of scholars with d oses expertise. Organizing the results is highl y demanding. Ranking is proposed to help for this kind o f or ganization. It p rovides quite pro mising sequence to assist users to chec k the schola rs. However, when querying the certain scholar s, a number o f criteria involved that makes it difficult to rank th e scholar in a o ne dimensional line. A lso, users wish to gain more ins ight in terms of the relatio nship among the sch olars - to help for classi fication, search for colla boration, and even scientific study. T he ranking canno t a chieve this to ca pture the interrelation ships behind them. To bette r demonstr ate this problem, we propose t o utilize the visualizatio n to help users f or th e mu lti-criteria search. Visualizati on is a feasible way to help users explore hidde n relatio nships and discover mor e useful info rmation. The scholar’s infor mation retrieval system is the application of visualiza tion in the field of search[5] . The Echarts and d3.js visualization libraries used are designed as the b asis for the visualization of the page. Three visualizatio n forms are designed, and the co lors and lines are d istinguished. The search results are more intuitive and interactive, w ith more fun and readability, and the fun ctions are expanded and enhanced. The user c an use the retrieval system to co nveniently retrieve the required keywo rd information , and help to cla rify the r elationship between the sub -concept and su per- concept w ords between the k eywo rds. At the sam e time, the expansion of the new word and the double click event und er the event can be used to retrieve keywords[6]. Gre atly impro ved the search efficiency. T he visual search system is now genera lly recognized by everyone . M ore a nd mor e sea rch websites in the world hav e b egun to try to use the visual interface [7], so this is the trend of the time s. Our aim is to ob tain keywor ds-related informatio n by searching for k eywor ds and selectin g keywords, such as th e relevant scholars in the field and the historical development of the field. T herefore , o ur visua l design is better able to realize understandin g of the field and rela ted field s before we want to unde rstand a certain field, form an overall r elationship network, co nduct more in-d epth stud y of key ar eas, and our system thro ugh visuali zation. Presentation and co nvenient interaction a chieve this goal. Our paper is organized as follows. Section 2 presents the related work. Section 3 gives an overview of the system. Section 5 and 6 describ e the co re par t of the system - graph b ased query sy stem and show th e inter action of the visual query system respe ctively. Section 7 pr ovides differ ent user cases. Section 8 ends with conclusions. 2. Related Wo rk Most of sch olars’ sear ch system ’s Knowled ge Graph is a check box form to select keywo rds. Not o nly is the re lationship between keywo rds unique, but also the su b-concept and super-co ncept of some keywo rds are hidden[8]. The use r searches f or terms r elated to super- concept. For e xample, the AI’s super-concept is computer science, a nd the sub-concept is the search keyword’ s subordinate concept. That is, the narrower, related ter m, for example, the AI ’s sub-conce pt has automatic Driving, etc. When we expand the word when we search for an abbreviatio n, for examp le, the acronym for Artificial Intelligen ce is AI, then its exp ansion is Ab Itinio. When searching, you need to search the box again to p erform an input search. These steps are not only complicated but also not c lear to the user.Due to the continuous incre ase a nd improveme nt of dat a, the re sults displayed by search have become more and mor e complicated.T he or iginal sorting method can not display the results intuitively, and the selection method is not easy to understand. It is just the result of textual display, and hides the relationship b etween keywords. It is very impractical. W e want to design a visual system to show more results. This can be applied not only to scho lars’ search but also to mor e search systems. In different use cases, a visual disp lay system c an be d ynamically designed based on data[9]. There are m any m ethod s of visuali zation that can be used.The purpose is to mak e the system visual d isplay, while add ing some interactive feature s to provide human-compu ter interaction experience a nd e nhance the sea rch function. 2.1. Vis ual display part design Considering the layout of the pa ge and the us able range of the page, selec t the most suitab le visualizatio n in the Ec harts and d3 .js librar ies, and finally sele ct the interes ting a nd relationship -connected force-oriente d d iagram in d3.js. Display extend ed w ord information[1 0], an d at the same time find a tr ee d iagram in Echarts that has an up-and -down re lationship and has nodes to display t he super-concep t and su b-concept words, and imagine that it can be co lor-differentiat ed[1 1]. Set two r egions in the d isplay area. I f the user sea rches for an abbreviatio n, the extend ed word module will automatically display the extend ed word. If the user searches for a complete word, the extended word module shows the ba ckground image. The word search result display module displays the result s of the sub -concept and super-con cept o f the keywo rd. 2.2. In teractive Design Interaction is an impor tant part of o ur visual query syste m[12]. It not only makes sear ching easier, but searching is more interes ting. Most web pages foc us o n perfect functionality, b ut rarely consider the user’s experie nce. With the pop ularity of visu alizat ion[13 ], web pages shou ld also be more intui tive and easi er to use[ 14]. Our system takes into account all aspects of user requirements. First we can u se the click tree node to get the user’ s desire d sub-c oncept word, but if this node has already acquired the child node, then our click will be the expansion and contraction of the node. To improve usability and differentia tion, we designed a number o f changes in colors and fills[15] . Click on the interaction we can o nly receive the sub-concept word information of this keywor d, b ut many users want to find out the word and the expansion of the w ord, so we have designed a do uble-click event. A d ouble-click event will searc h for upstream and downstream word informatio n for this node. Seco nd, we added two MORE nodes to dynamically ad d the num be r of super-concep t and sub-concep t words, because to meet the needs of differe nt users, this node is completed by clicking. 3. Syst em Overview 3.1. The original se arch i nterface Figure 1. The g raph is the original search i nterface. The original search interface is a list of pages, and select the keywo rd by Check box[16]. More and more people see that check boxes are bor ing and feel complicated. When w e want to search a key w ord, we always h ave a headache and dazzled . While the relations among them a re hidden to the use rs[17]. So when users wa nt to search a key word ’s Super-concept and Sub-concept they must write the word into the searc h b ar. This method is very complicated . So we want to impro ve it. In this example, we have selected machin e learning, a nd then the system shows relevant scholar s in the scholar network[ 18]. To improve the system, we need to under stand the oper ating mode and intern al structur e of the original system. Ther efore, we explor ed that the original system works b y searching keywor ds and classifying keyword s, including sub-concept, su per-c oncept, and extensio ns. These r esults are pr esented in sub-cases, provided to the user for selection, and then r elevant info rmation can b e obtained through these keywo rds, suc h as displaying scho lars related to this.Its working method is shown in the figure below. Figure 2. The system internal process of the schol ar que ry system. 3.2. Vis ual Query System We designed a visual quer y system to search the key words. We aim to visualize the search results in Aminer in a more user-friendly wa y and help them better utilize the too l[19]. Our system consists o f mainly four parts - Query Bar, Keyword Expand Panel, Query Grap h Explo rer and Quer y List Display. The Query Bar o n th e top mainly co ntains the bar that allows users to ty pe their keywords for search. The Ke yword Expand Panel on the left up corner shows the options of the keywor ds. T he Query Graph Explo rer on the right up corner demo nstrates the proc ess of the query. The Query List Display o n the b ottom sho ws the cor responding scho lars and their properties. This system show that the designed graphs help users better understand the area they intend to know and make their search more e ffective. And the way p eople interact with the page is more intere sting and can make it easier for people to understand the rela tionship between keywo rds. Utilize our Visual Query System to display the scholars who need to understand more infor mation. Figure 3. The visual query system of s cholar. 3.3. Keyword Expand Panel It is quite common that some keyword s are abbreviatio n of the origina l words. For examp le, "AI" represents the " Artificial Intelligence" in the computer science domain, but it also means "Asymmet ric Information " some fusion occurs. To bette r suppo rt the query, we pro vide the "Keyword Expand Query". User could first types in the abbreviation of the keywords, th en some origina l terms are pr oposed to the user . He/sh e can pick the e xtract keyword. Extended words allow us to extend a basis for search. So we d esigned a module to display extende d words. When we search the ab br like AI, our sys tem can find and show exten ded words through force map. The significance of the existe nce of extended words is to give us ers mor e tip s, so that they can assoc iate mor e re levant keywords, pr ovide user s with more ide as to get more knowledge. We also add some events in the extended words to facilita te users to obtain rele vant information conveniently. For example, by clicking o n the circle s of various colors to realize the search functio n, more informatio n ab out the clic ked keywo rds is displayed to the user. Figure 4. T he extended word display module in visual query system. 3. Query Graph Explorer As we pr oduction three different methods to show the key words of the schola r networks. Since different users have different prefere nces, we co uld choo se different method s to demons trate results. 4.1. Rad ial tree We main ly studied Radial tree.Because this tr ee map is very b eautiful and it can ea sily to extended more features. We can saw the super -concept are displayed in b lue in the upper p art a nd the sub-concept in ora nge In the lower p art.This la yout is more intuiti ve and easy for users to accep t and understand[21] . Then we designed two nodes named More to a dd su per-concept and sub-c oncept. The ad vantages of radial tree are the following points. Fast display. The data display i s multiple layers. Under the visual analysi s, the data is divided into multiple layers and the layers ar e extended to each layer. Each layer rep resents a keywor d layer. The circular layo ut extend s outwardly to mor e intuitive d isplay of re lationship informatio n, which looks intuitive and enhances the user’s understand ing of keywords. Many of the key words covered in the graph are related of multiple elements. One element wi ll affect man y other e lements,If w e d o not take a visualization, you will not b e able to see the whole picture and you will not be able to have a real Hierarchical relationship discussio n. Figure 5. One of t he display methods of the visual query system: Radial tree. 4.2. Hori zon tree The seco nd m ethod is a horizon tree,this kind o f tree map is easier to d istinguish super-concept and sub- concept. The first requested words may not be what the user is looking for , so c lick the More node until find the result. There are also man y advantages of the horizontal tree diagram. For example, this kind of d isplay format saves the space of the pa ge a nd facilitates the layout of other modules in the system. This meth od also shows the relationship between keywo rds in a more intuiti ve manner , facilitating the user to understand the keyword informatio n. Ho wever, the level of this meth od is not good. When there are many open word s, the page is complicated and not easy to watch. Figure 6. One of t he display methods of the visual query system: Horizon tree. 4.3. Fo rce map We have designed a force map, we can p ut colo rful b alls in this module we want to put acc ording to the needs of the system and the needs o f the us ers. We plan to add a mo use click event to e ach circ le and click to show the related keywords. Mor e informati on and increase the user experience. Mandatory maps have many ad vantages. The most important is that it is a more interes ting layout. These nodes hav e a richer colo r. We can d rag it. The interaction is very strong, but its disp lay informati on capability is not the firs t tw o kinds of intu itive. Keywords The relationship between the two is also not stro ng enough, so there is still room for improvement . Figure 7. One of t he display methods of the visual query system: Force map. 5. Visu al Query Interac tion Interaction is the impo rtant part in our visual query sy stem. Not only does it make it e asier to sear ch but it can be more in teres ting to sea rch[2 2]. Most web pages focus on wheth er the fun ctionality is perfect, but ra rely take into acc ount the user’s experie nce. With the po pularity o f visualiz ation, web pages should also be more intuiti ve to display a nd more convenient to use. Our syste m takes into account all aspects of the user’s needs. Fo rm a multi-le vel web page[23]. 5.1. Expan d the Graph We could use the click tree nodes to obtain the sub-concept that the user wants to. For example, emerging technology is the super-concept for AI, we could click the Emerging technology node s to re ceive this word’s sub- concept. Like the green nodes and g reen lines in this graph. So we could use the same metho d to receive the sub- concept of green no des. Like the br own nodes and brown lines in t his graph. This f igure is all the nodes can click interaction. But if th is node already has children, then our click will be the expansion and collapse of the node . In order to impro ve usability, w e de signed many co lor and fill changes . When the n ode our clic k is not has su b-concept the node keeps its co lor unchang ed and be comes an empty node,like the nod e self -Driving. When the node our click h as sub-c on cept the nod e beco mes a red emp ty node , like the nod e Emer ging technolo gy and Machine lear nin g. Considering that ther e are too many nodes in the tree graph will become more c omplex, we can click to get the descendant of the child nodes, then shrink the node a nd the node beco me r ed fill node, like the node Na tural Language Processing . Figure 8. The method for expanding keywords in our visualization system: Click i nteraction. 5.2. Get more i nformation on keywords Click can only receive sub-concepts o f this key word, but many peo ple want to find out this word’s super- concept and extended words. So we designed do uble c lick even t. As we d ouble-click the super-co ncept of AI, like node emerging techn ology. A t this point, the node emerging techno logy is pa ssed to the ce nter o f the tree map, and the emerging technolo gy sup er-concept and sub-co ncept are expanded aro und. Also we can click and double-click interaction in this figure. Figure 9. The method for expanding keywords in our visualization system: Double-click interaction. 5.3. Cas e Study 5.3.1. Data Mining We can not only search f or abbreviations to get keyword information, b ut a lso w e can get informati on on complete keywords, like the keywo rd D ata mining. But in this w e don’t receive expand words. Also w e can click and d ouble-click interactio n in t his figu re. Figure 10. Search t he full n ame of the method to use t he visualization system. 5.3.2. Data Integration The biggest advantage of our system is that it can acco mmodate more keyword infor mation and meet t he needs of all users . After a lot o f actual testing, we lear ned about various special situations because we have considered vario us situ ations to design the system. An er ror o ccurred on the syste m and the syste m stopp ed working. Some key word s have no sub-conce pt, so when we search for such words, only the su per-concept words ar e shown, like Data integratio n.So we can saw the super-concept of the Da ta integration and we c ould c lick the nodes to expand t his nod e’s sub-concept. This situat ion give user mor e sele ct to I nteract with the computer. Figure 11. Some keywords only the super-concept words are shown, like Dat a integration. 5.3.3. Knowledge reasoning Figure 12. Some keywords only the translate words are shown, like Knowledge reasoning. The transl ation function c an b e an independent system. Although it does n ot display th e sub-concept and super-concep t word s, it c an acc urately translate k eywords. Some keyword s have no sub-concept, so when we search for such words, only the translate word s are shown, like Knowledge rea soning. 5.4. Examp les show We d esigned this syste m to d isplay all keywo rds infor mation on our da tabase which the user want to know.And this datab ase ar e big enough. We sh owed the results of the ac quisition of some main keywords like Classificatio n and Comp uter Vision. Figure 13. The figure i s an example keyword: Classification . Figure 14. The figure i s an example keyword: Computer Vision. Figure 15. This graph is a system case of visual q uery . Figure 16. The figure i s a radial tree d iagram after expanding more keywords. Users can change the color of a ny ele ment i n the s ystem by their own needs. Figure 17. The visual query give us more color c hange select. The visualiz ation function not only allo ws us to click on mo re sub-nodes we need to expand our visualizatio n, so that the grap hics are more hierarchical and the structure is clea rer. It c ontains the differe nces between various color s a nd node fills. When more and more nodes become more and more dense, the system will automa tica lly adjus t the dist ance between the co nnecti on and th e node, m ak ing th e whole more like a b eauti ful cir cle. In the end we formed an overall visual query system for scholar networ ks. System overview a s shown belo w. Figure 18. The graph is the full page of our visual query system. References 1. Mujhid, Ibrahim Jameel, et al. "A se arch engine for finding and reusing architecturally significant code." J ournal of Systems S oftware 130(2016). 2. Jácome, A. G., F. Fd ez-Riverola, and A. Lourenço. "BIOMedic al Search Engine Framework: Lightweight and customized implementation of domain-specific biomedica l se arch engines." Computer Methods Programs in Biomedicine 131(2016):63-77. 3. Guo, Kehua, et al. "An effective and economical architecture for se mantic-based heterogen eous multimedia big data retrieval." Journal o f Systems Software 102.C(2015):207-2 16. 4. Abdou, Samir, and J. Savoy. S earching in Medline: Query expansion and manual indexing evaluation. Pergamon Press, Inc. 2008. 5. Razavian, Ali Sharif, et al. "Visual Instance Retrieval with Deep Convolutional Networks." Ite Transactions on Media Technology Applications 4(2016). 6. Kaneko, Hiromasa. "k-nearest neighbor normalized error for visualization and rec onstruction – A new measure for data visualization performance." Chemometr ics Intelligent Laboratory Systems 176(2018):22- 33. 7. Cheng, Shenghui, W. Xu, a nd K. Mueller. "RadViz Deluxe: An Attribute-Aware Display for Multivariate Data." P rocesses 5.4(2017): 75. 8. Zhang, Ning, et al. "TapTell: Interactive visual search for mobile task recommendation " Journal o f Visual Communication Image Representation 29(2015):1 14-124. 9. Sekerina, I. A., Luca, C ., Van, D. J. A. Using the Visual World Paradigm to Study Retrieval Interference in Spoken Language C omprehen sion:. Frontiers in Psychology 2 016, 7(873), 873. 10. Guo, K., Liang, Z., Tang, Y., Chi, T. S or: an o ptimized semantic ontology retrieval a lgorithm for heterogeneous multimedia big d ata.Journal of Computational Science 2017. 11. Cheng, Shenghui, and K. Mueller. "Improving the fidelity of contextual data layouts using a Generalized Barycentric Coordinates framework." Visualization Symposium IEEE, 2015:295-302. 12. Liu, S ., Cui, P., Luan, H., Zhu, W., Yang, S., Ti an, Q. Social-oriented visual image search. Computer Vision and Image Understanding 2014, 118(1), 30-39. 13. Kobayashi, K., Ogawa, T., Haseyama, M. Novel Evaluation Criterion for Visualization of Image Search Results Ba sed on Feature Integration Theory. MTA 2013,1(4), 333-342. 14. Tseng, Y.C., Howes, A. The Adaptation of Vi sual Search to Utility, Ecology a nd Design. International Journal of Human - Computer Studies 2015, 80(C),45-55. 15. Cheng, S., Xu, W., Mueller, K. C olormapnd: a data-driven approach and tool for mapping multi variate data to color. IEEE Transactions on Visualization and Computer Graphics, PP(99), 1 -1. 16. Li, R., et al. "Epidemiological Characteristics and Spatial-Temporal Clusters of Mumps in Shandong Province, China, 2005-2014. " S ci Rep 7(2017):46328 . 17. Jiang, Zhifang, et al. "Research on time-series data visualization method b ased on parameteriz ed parallel coordinates and color mapping function." International Conference on Systems a nd Informatics IEEE, 2012:510-514. 18. Nazemi, K., Burkhardt, D., Hoppe, D., Nazemi, M., Kohlhammer, J. Web-based evaluation of information visualization. Procedia Manufacturing 2015, 3, 5527-5534. 19. Cheng, Shenghui, P. Cui, and K. Mueller. "Extending Scatterplots to Scalar Fields." (2016). 20. Cheng, Shenghui, et al. "TorusVisND:unr aveling high-dimensional torus networks for network traffic visualizations." The Workshop on Visual PERFORMANCE Analysis IEEE, 2014:9-16. 21. Cheng, Shenghui, K. Mueller, and W. Xu. "A framework to visualize temporal behavioral relationships in streaming multivariate data." Scientific Data Summit IEEE, 2016:1-10. 22. Furukawa, H. Int eractive visualization system of taylor vortex fl ow using stokes’ stream function. World Journal of Mechanics 2012, 2 (4), 188-196. 23. Jiang, Zhifang, et al. "The shape coordinates system in v isualization space." International Symposium on Visual Information Communicatio n and Interaction 2012:18-21. Author Contributions: H.Li pr oposed the id ea, mad e the to ol and wrot e the p aper draft. Acknow ledgments: We wou ld like to thank Tsinghu a University Aminer group to pro vide the data and conduct certain survey. Conflicts of In terest: T he authors declare no conflict of interest.
Original Paper
Loading high-quality paper...
Comments & Academic Discussion
Loading comments...
Leave a Comment