On a Class of Objective Priors from Scoring Rules
Objective prior distributions represent an important tool that allows one to have the advantages of using the Bayesian framework even when information about the parameters of a model is not available. The usual objective approaches work off the chose…
Authors: Fabrizio Leisen, Cristiano Villa, Stephen G. Walker
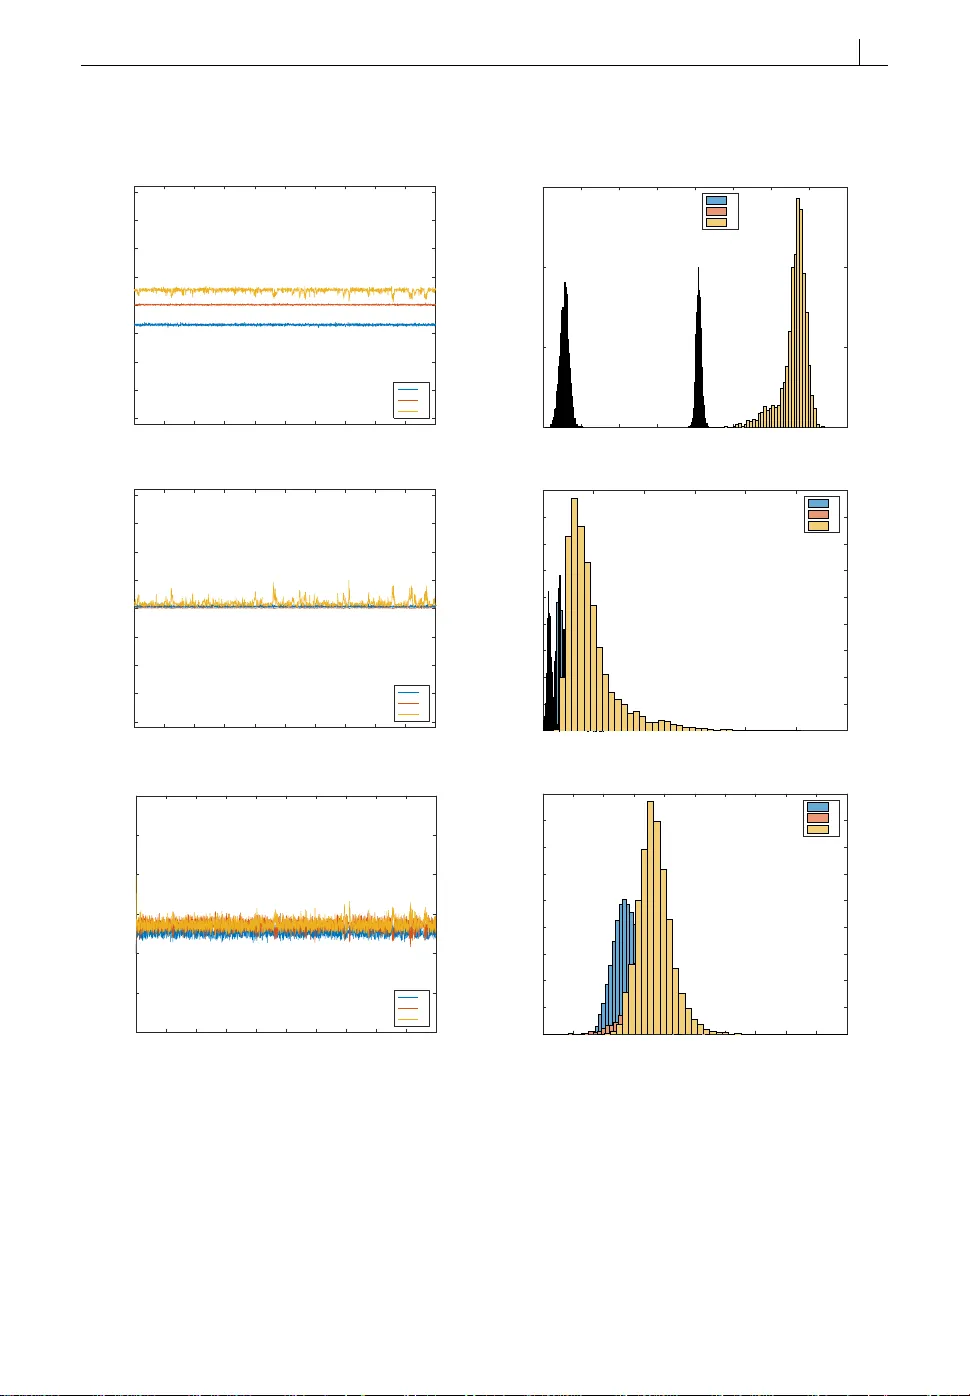
O R I G I N A L A R T I C L E J o u r n a l S e c t i o n On a Class of Objectiv e Priors from Scoring Rules Fabrizio Leisen 1 | Cristiano Villa 1 | Stephen W alk er 2 1 School of Mathematics, Statistics and Actuarial Science, Univesity of Kent, Canterbury , UK. 2 Department of Mathematics, University of T exas at Austin. Objective prior distributions represent an important tool that allows one to have the advantages of using the Bayesian framework even when information about the parameters of a model is not available. The usual objective approaches work off the chosen statistical model and in the majority of cases the resulting prior is improper , which can pose limita- tions to a practical implementation, even when the complex- ity of the model is moderate. In this paper we propose to tak e a novel look at the construction of objective prior distri- butions, where the connection with a chosen sampling distri- bution model is removed. We explore the notion of de fi ning objective prior distributions which allow one to have some degree of fl exibility , in particular in exhibiting some desirable features, such as being proper , or centered on speci fi c val- ues which would be of interest in nested model comparisons. The basic tool we use are proper scoring rules and the main result is a class of objective prior distributions that can be employed in scenarios where the usual model based priors fail, such as mixture models and model selection via Bayes factors. In addition, we show that the proposed class of pri- ors is the result of minimising the information it contains, providing solid interpretation to the method. K E Y W O R D S Calculus of variation, Differential entropy , Euler–Lagrange equation, Fisher information, Invariance, Objective Bayes, Proper scoring rules 1 2 1 | I N T R O D U C T I O N With the ever increasing popularity of Bayesian methods, attributable largely to the advent of Mark ov chain Monte Carlo methods and other sampling techniques, the need for default, otherwise known as objective or noninformative, priors is also in demand. Model based objective priors, such as the reference prior (Berger et al., 2009) and Jeffreys prior (Jeffreys, 1961), are commonly used when available. However , as models become larger and more complex, so it is that such priors are becoming more dif fi cult to obtain, if not altogether unavailable. Indeed, it is our contention that model based objective priors have now reached their natural ceiling with little progress or advances in recent years. Some recent developments include a class of prior for hierarchical models, introduced by Simpson et al. (2017), though these penalizing complexity priors are not considered objective in the usual sense. For a recent comprehensive review of objective Bay esian procedures we refer the reader to Consonni et al. (2018). Our observation is that limits to the progress in the research on objective priors is connected to their improperness. In fact, with very few ex ceptions, objective priors are improper . Although this may not represent a problem, as long as the posterior is proper , it causes severe limitations to the use of objective prior distributions, as we discuss in Section 1.1. Indeed, the improperness of objective priors is the main motivation which brought us to investigate a novel approach to derive objective priors. Before proceeding further , it is important to provide some background. We argue that the Bayesian prior is given by the probability measure Π on a suitable space of density functions and constructed from statistical model f ( · | θ ) , θ ∈ Θ , and probability density p ( θ ) on Θ , via Π ( f ∈ A ) = { θ : f (· | θ )∈ A } p ( θ ) d θ , for all measurable sets A . This is a more direct interpretation of the prior and avoids the inconvenient separation between Bayesian parametric and nonparametric methods. Indeed, it is useful to visualize Bayesian inference as the generation of a random density and associated functions; even if one is only considering random normal density functions. From this perspective, the two components that are traditionally known as the likelihood, f ( · | θ ) , and the prior , p ( θ ) , are mere tools used for constructing Π and, perhaps, the reasons for this nomenclature are more historical than accurate. Hence, the prior Π can never be assigned completely on objective grounds, as the function f ( · | θ ) is assigned as a result of a subjective choice, based on good reasons. However , the function p ( θ ) can be derived through some objective method, making the actual prior Π a combination of subjective and objective choices. This said, it is puzzling to understand why p ( θ ) and f ( · | θ ) need to feed off each other in any way; other than the θ in both needs to be sitting in the same parameter space Θ . Consequently , in this paper we investigate the possibility of de fi ning objective prior distributions that are not model dependent and based on the sole knowledge of the parameter space Θ . The p ( θ ) using only Θ loses the connection with the subjective component of Π and could be argued as a consequence to be more objective . Conversely , model based priors, such as the Jeffreys prior or the reference prior , necessarily include the subjective choice of the model. In fact, models are by and large misspeci fi ed and, consequently , model based priors are propagating this misspeci fi cation. So, while a model based prior reinforces the connection between the misspeci fi ed model and the prior itself , a prior that depends on the parameter space loses only the connection. 1.1 I M P RO P E R P R I O R S 3 1.1 Improper priors Most limitations to the use of model based objective priors lie in the fact that they are improper . In Section 1.2 we discuss some motivating e xamples where the lack of properness in the prior makes them unsuitable. Here, we would like to present more general issues widely discussed in the literature. A thorough discussion of the problems that improper priors cause can be found in Kass and Wasserman (1996), where they illustrate the following fi ve issues: 1. Incoherence, strong inconsistencies and nonconglomerability; 2. Dominating effect of the prior; 3. Inadmissibility; 4. Marginalisation paradox es; 5. Improper posteriors. Although points 1. to 4. are undoubtedly important and noteworthy , it is probably the last issue that requires careful consideration. The main concern is that, as of today , general results that allow one to assess if a given improper prior yields a proper posterior are yet to be found. Research has progressed on a case by case basis; for example, see Ibrahim and Laud (1991) for the use of Jeffreys prior in generalised linear models, extended to overdispersed models of the same kind by Dey et al. (1993), Natarajan and McCulloch (1995), Berger and Strawderman (1993), and Y and and Chen (1995). More recently , Rubio and Steel (2018) describe general conditions to use improper priors for linear mixed models with longitudinal and survival data. However , the ke y point is that when one wishes to use (improper) objective priors, unless they have been used before for that speci fi c case, extensiv e work is required to ensure that the posterior is proper . As one would expect, the task becomes more onerous the more complex the model is. But, even for simple models, the risk is high; as, for e xample, the discussion in V allejos and Steel (2013) about the use of the Jeffreys rule prior for the Student- t regression model derived in Fonseca et al. (2008) shows. The above limitations imposed by improperness of model based objective priors lead us to the development of a method that allows objectivity of the prior and properness to coexist. 1.2 Motivating e xamples The following four sections give an idea of the challenges that the use of improper priors may pose, even for simple problems, and highlight the need for objective prior distributions that have the fl exibility , when needed, of being proper . 1.2.1 Mixture models A powerful tool in statistical analysis is represented by mixtures models. Due to their fl exibility , mixtures of probability distributions allow models suitable for complex data by building on simple components. As an example, consider a mixture of normal densities, f ( x ) = k j =1 ω j N ( x | µ j , σ 2 j ) , (1) where k is a positive integer , including ∞ , and the ( ω j , µ j , σ j ) are the collection of parameters of the mixture model. Even under the scenario when k is known, the reference prior for model (1) has yet to be derived, and Jeffreys prior can only 4 1.2 M OT I VAT I N G E X A M P L E S be obtained under speci fi c conditions; see Grazian and Robert (2018). Furthermore, this type of model is subject to other issues related to non-identi fi ability and unbounded likelihoods, among others. The issues mainly rise from the fact that improper priors may not be appropriate as we might not observe outcomes from every component of the mixture (Titterington et al., 1985). For example, Grazian and Robert (2018) show that Jeffreys prior is suitable for mixtures of normal densities only in certain circumstances; that is, when the unknown parameters are the weights. If the unknown parameters are the means or the variances, then using Jeffreys prior may lead to improper posteriors. In particular , if the unknown parameters are the means only , proper posteriors exist only when the number of mixture components is at most two; while, if the unknown parameters are the variance, or the mean and the variances, then Jeffreys prior is not suitable for inference. The above issues can be generalised to apply to any type of mixture model. 1.2.2 Bay es factors Another simple case where objective priors are problematic is in model comparison (or selection) via Bayes factors. So, if we wish to compare model M 1 = { f 1 ( x | θ θ θ 1 ) , p 1 ( θ θ θ 1 ) } to model M 2 = { f 2 ( x | θ θ θ 2 ) , p 2 ( θ θ θ 2 ) } , where both θ θ θ 1 and θ θ θ 2 are vector of parameters with some elements not in common, then the Bayes factor B 12 = f 1 ( x | θ θ θ 1 ) p 1 ( θ θ θ 1 ) d θ θ θ 1 f 2 ( x | θ θ θ 2 ) p 2 ( θ θ θ 2 ) d θ θ θ 2 , is, in general, meaningful if the priors assigned to non-common parameters are proper . If not, then the arbitrary multiplicative constant up to which they are de fi ned do not cancel and the Bayes factor depends on an arbitrary constant. Solutions to the issue have been proposed, see for example O’Hagan (1995) and Berger and Pericchi (1996), however , the resulting procedures are still quite tedious to implement and are limited to simple models. By and large the above issue stays; however , Berger et al. (1998) give an ex ception of the issue. 1.2.3 Hierarchical models Improper priors may not always be used with hierarchical models. Consider the following simple example from Kass and W asserman (1996), y i | µ i , σ ∼ N ( µ i , σ 2 ) µ i | τ ∼ N ( µ , τ 2 ) , for i = 1 , . . . , n . Assuming σ is known, one could adopt the objective prior π ( µ , τ ) ∝ τ − 1 , which is improper . However , the (marginal) posteriors are improper . One way of overcoming this issue is to use proper priors that approximate the behaviour of the objective priors, which means proper and vague densities (or uniform distributions on a compact set); due to the arbitrariness of the choices involv ed, the above are obviously not viable solutions in an objective context. 1.2.4 Other issues related to the use of improper priors There are many issues, practical and foundational, deriving from the use of improper priors. F or example, the marginali- sation parado x (Stone and Dawid, 1972), related to the use of improper priors for multi-dimensional parameter spaces, or the Stein ’s parado x (Bernardo and Smith, 1994), related to the use of vague proper priors (or uniform priors on 1.3 T H E I D E A : O V E R V I E W 5 compact sets). Another issue goes under the name of strong inconsistency , illustrated by the following e xample taken from Syversveen (1998). Consider observations from the normal density N ( µ , σ 2 ) , where the variance is known, and de fi ne the event E = { | x | ≥ µ } . From the model, we have P ( E | µ ) = 1 2 + Φ − 2 | µ | √ n / σ > 1 2 . Since P ( E | µ ) > 1 / 2 for all the values of µ , we conclude that P ( E ) > 1 / 2 , and the posterior for E , assuming p ( µ ) ∝ 1 , is given by P ( E | x ) = 1 2 − Φ − 2 | x | √ n / σ < 1 2 . As P ( E | x ) < 1 / 2 for all values of x , we conclude that P ( E ) < 1 / 2 , showing inconsistency between the sampling distribution and the posterior . 1.3 The idea: Overview In this section we give an overview of the idea we propose to derive a class of objective prior distributions that depends on the parameter space only . While a formal presentation will be discussed later on, we deem it appropriate to present, at least at an intuitive level, the ideas here. The ke y to the idea is to consider a loss function l ( θ , p ( θ )) which penalizes for each θ ∈ Θ a choice of a prior density p ( θ ) . The objective criterion is then based on the idea of fi nding the class of p which makes l ( θ , p ( θ )) constant. For obvious reasons, the loss function should have the following property l ( θ , p ( θ )) q ( θ ) d θ ≥ l ( θ , q ( θ )) q ( θ ) d θ , (2) for all q ’s representing a density for the θ . In other words, if a “true” density for θ exists, the expected loss should be minimised when such a density is chosen. The condition in (2) identi fi es a particular class of loss functions, known as proper scoring rules . One way of interpreting (proper) scoring rules is as loss functions that measure the quality of a quoted density p for an uncertain quantity θ ; see for e xample Parry et al. (2012). We indicate proper scoring rules as S ( θ , p ) , and we ask it to be constant for all θ ∈ Θ . So we set S ( θ , p ) = constant [ θ ∈ Θ , and the densities satisfying the above equality identify a class of objective priors. We set the constant to 1 and show later that this choice is without loss of generality . The criterion de fi ning this class of priors is clearly objective, for if the scoring rule were not constant, some parts of the space Θ would be given preference above others. As discussed in Parry et al. (2012), any proper scoring rule is equivalent to the log score , − log p ( θ ) , also known as the self information loss function. The log score has the property of depending on p only through its value at θ , which is known as the local property . However , the above scoring rule lacks the fl exibility for assigning an objective prior . F or if we set − log p ( θ ) = constant, we only achieve p ( θ ) ∝ 1 . T o solve this, we consider additionally the Hyvärinen scoring rule (Hyvärinen, 2005), which makes use of the fi rst two derivatives of p , written as p 0 and p 0 0 . We then have a scoring rule S ( θ , p ) which has two components; the log score and the Hyvärinen score. Finding solutions to S ( θ , p ) = 1 will now involv e solving a second order differential equation and 6 1.4 I N VA R I A N C E we obtain the class of prior through the two constants connected with the two derivatives. While the prior is deemed objective through the setting of the scoring rule to be a constant, we show that the prior distribution which solves S ( θ , p ) = 1 has an alternative derivation using variational methods; that is S ( θ , p ) = 1 is a solution to the Euler–Lagrange equation for minimising Θ L ( θ , p , p 0 ) d θ , where L represents information in p , indeed a combination of the differential entropy information, given by p ( θ ) log p ( θ ) d θ , and the Fisher information, given by p 0 ( θ ) 2 / p ( θ ) d θ . There is then an elegant alternative interpretation of obtaining the class of objective prior , which involv es information aspects of the prior distribution itself . In higher dimensions, where the parameter space is ( θ 1 , . . . , θ k ) , and there are no constraints between parameters, we assume prior independence among the components and construct the prior as p ( θ 1 , . . . , θ k ) = k j =1 p j ( θ j ) , where each p j ( θ j ) is a prior derived with our proposed approach. While we could theoretically obtain the multivariate prior it is convenient to assume independence, as is commonly done with objective priors, for example as with the independent Jeffreys prior . Indeed, we argue that in the absence of any prior information about possible constraints between the parameter spaces, the assumption of independence is an appropriate representation of absence of information. Note that, although reference priors allow us to obtain priors for multidimensional parameter spaces, they hav e the downside, when it is possible to fi nd them, in that the yield a prior which depends on the order in which the parameters are considered. Furthermore, it is not uncommon to see the use of independence Jeffreys prior for multidimensional cases, as in Fonseca et al. (2008) or Rubio and Liseo (2014), given that it can still remain the best (or only) option in this situations. Nevertheless, in Section 2 we do describe the full multivariate solution. 1.4 Invariance A fundamental point of discussion about prior distributions and, in particular , objective prior distributions, is invariance. Indeed, Jeffreys’ rule to derive a prior distribution for the parameters of a given model is based on an invariance requirement, in particular on invariance under one-to-one reparameterizations. Also, other common objective priors, such as reference priors, have been shown to be invariant and the same apply , for example, to the priors in Simpson et al. (2017). Here we discuss invariance from two opposite perspectives: that it is not important, and that it is important. Before discussing this apparent contradiction, we need to point out that we de fi ne the objective prior by setting the scoring rule equal to a constant, that is S ( θ , p ( θ )) = constant , is invariant under location transformations. The core of the discussion about invariance revolves around transformations that are not of the location type. In general, we have the choice of the model f ( · | θ ) de fi ning the parameter space Θ which, in turn, de fi nes the prior p θ ( θ ) . For a non location transformation, say φ = φ ( θ ) , it is that f ( · | φ ) de fi nes p φ ( φ ) via S ( φ , p φ ( φ )) = constant and, in general { θ : f (· | θ )∈ A } p θ ( θ ) d θ , { φ : f (· | φ )∈ A } p φ ( φ ) d φ , (3) so the prior distributions under the two scenarios are different. As an example, consider the transformation from a probability (e.g. the parameter of a Bernoulli distribution) to negative log; i.e. φ = − log θ , for which the parameter space changes from ( 0 , 1 ) to ( 0 , ∞) . 1.5 O B J E C T I V I T Y A N D U N I Q U E N E S S 7 The question is whether this has any practical implications given that only one of the two priors in (3) will be used. Current model based objective procedures are bound to throw away some coherence properties to achieve invariance, see Kass and W asserman (1996). However , our point is that there is no practical consequence of any relevance arising from the lack of invariance, given that, as mentioned above, a single parameterization will be used. For e xample, in the case the chosen model is the normal density , one either considers the precision parameter or the variance parameter , not both. The above points of discussion are concerned with the perspective that invariance is not important. T o consider the opposite point of view let us assume that there is a canonical parameterization for the model f ( · | θ ) . Certainly , for most models the set of parameters for which priors would be assigned is obvious. For example, the e xponential family has f ( x | θ ) = h ( x ) exp p j =1 θ j T j ( x ) − A ( θ ) with θ = ( θ 1 , . . . , θ p ) being the canonical parameterization. We can then de fi ne the canonical objective prior for statistical model f ( · | θ ) , θ ∈ Θ , as p Θ ( θ ) = p j =1 p Θ j ( θ j ) , where Θ = ⊗ p j =1 Θ j . Then, any transformed prior can be obtained in the usual way involving variable transformations; that is p ( φ ) = | J | p Θ ( θ ( φ )) , where J is the Jacobian matrix for the transformation. 1.5 Objectivity and uniqueness Before proceeding further it is important to discuss uniqueness and fl exibility associated with objective priors. It is widely acknowledged that a prior representing total ignorance is elusive (and it might not even be possible to obtain in principle, see Bernardo and Smith (1994)). As a consequence, any prior distribution, objective or not, must out of necessity provide some knowledge about something, and this “something” is not necessarily unique. For example, given a particular problem the corresponding objective prior over a given parameter space could be proper or improper; differentiable everywhere or not; conve x; log-concave; etc. In other words, a prior can be objective and exhibit desirable features of choice without impinging on subjective components relating to information. So while we will be introducing a Bayesian objective prior criterion, it does not lead to a unique prior , rather to a class of priors, where some desirable features may or may not be included. We believ e that this level of fl exibility is a point of strength of the proposed approach, making it adaptable to different scenarios, including those where model based priors do not work. Indeed, model based priors may lead to uniqueness, yet they provide features, mostly improperness, which may not actually be desirable. For example, Jeffreys prior for the parameter of a Bernoulli distribution has the feature of having spikes at 0 and 1. On the other hand, the class of objective priors that are de fi ned by our method contains both proper and improper priors so, for example, the objective prior on a location parameter can be the fl at prior (i.e. the usual objective prior obtained, for example, by applying Jeffreys method) but can be proper as well (for example, to be used for the location parameters in mixture models). The de fi nitions of objective priors are vague and certainly encompass our choice. In Berger (2006) the following four de fi nitions of objective Bayes are listed in order of generality; 8 1.6 L I T E R AT U R E R E V I E W 1. A major goal of statistics (indeed science) is to fi nd a completely coherent objective Bayesian methodology for learning from data. 2. Objective Bayesian analysis is the best method for objectively synthesizing and communicating the uncertainties that arise in a speci fi c scenario, but is not necessarily coherent in a more general sense. 3. Objective Bayesian analysis is a convention we should adopt in scenarios in which a subjective analysis is not tenable. 4. Objective Bayesian analysis is simply a collection of ad hoc but useful methodologies for learning from data. The claim is that 1. is not attainable; 2. is achievable (though not always); while 3. should always hold and should be always implemented. If we consider the above de fi nitions given by Berger (2006), we note the possibility of some degree of fl exibility in an objective approach. As a starting point of discussion, let us consider the properness of the prior and let us assume that we are able to obtain, through the same procedure, a proper as well as an improper prior for a given parameter space; say , the mean of a normal density when the variance is known. As mentioned above, Jeffreys (and the reference) prior propose the fl at prior p ( µ ) ∝ 1 . This solution is in general sensible and it would lead to a proper posterior . However , as discussed in the Example 1.2.1 above, the fl at prior will not be applicable to a mixture model with more than two components. In this scenario, it would be desirable (and sensible) to have the fl exibility of using the same objective criterion and obtain a proper prior . In fact, if we consider the possibility of having a proper prior by leveraging on the fl exibility of an objective method we surely satisfy the points from Berger (2006). With respect to the above four descriptions of objective Bay es, we see that points 3. and 4. are quite obvious, as the methodology will surely be useful and it would be employed in a scenario where prior information is not available (or cannot be used). The choice of properties in a prior , such as properness, is not strictly a subjective action; in particular if it is driven by common sense (i.e. there are no alternatives). Furthermore, we argue that fl exibility fi ts into point 2. as it is objective within a speci fi c scenario. If we need proper objective priors for the means on the components of a mixture model, then that particular choice is objective. 1.6 Literature review The development of objective priors has been proli fi c in recent years. The idea is that in a scenario where prior elicitation is not feasible, or not desirable, a prior distribution can be formed through structural or formal rules (Kass and W asserman, 1996). Although a thorough review of objective Bayesian methods is beyond the scope of this paper , we deem it appropriate to brie fl y list the most common proposals. The fi rst approach is due to Laplace (1820) with the principle of insuf fi cient reason which leads to uniform, or fl at, prior distributions. The most popular objective prior is Jeffreys prior (Jeffreys, 1946, 1961), who proposed a prior distribution for continuous parameter spaces which is invariant for one–to–one transformations of the parameter space. For example, if we consider the sampling distribution f ( x | θ ) , the corresponding Jeffreys prior is given by p ( θ ) ∝ I ( θ ) , where I ( θ ) is the Fisher information. Although in scenarios where there is only one parameter of interest, Jeffreys prior yields sensible posterior distributions. However , in cases where the parameter space has a dimension of two or more, the prior is known to yield posteriors with poor performance (sometimes giving parado xical results, such as the marginalisation paradox). In such cases the priors are taken to be independent. Although other more general invariance priors have been proposed, such as in Dawid (1983), Hartigan (1964) and Jaynes (1968), the reference prior of Bernardo represents an alternative to Jeffreys prior . Here the idea is to derive a prior distribution which carries as minimal information as possible. The prior is identi fi ed as the one which maximises the (e xpected) missing information between the prior and the posterior . The most up–to–date results on reference 1.7 O R G A N I S AT I O N O F T H E PA P E R 9 priors can be found in Berger et al. (2009) and, for an extension to discrete parameter spaces, in Berger et al. (2012). A limitation of reference priors is sensitivity to the order of importance of parameters; this issue and possible solutions have been discussed in Berger et al. (2015). Other objective priors proposed include that of Box and Tiao (1973), based on data–translated lik elihoods, and maximum entropy priors, see for example Jaynes (1957, 1968). The fi rst type aims to use uniform priors in models where the likelihood can be translated producing posteriors which, for different samples, have the same shape and differ in location only . As discussed in Kass (1990), these priors turn out to be very restrictive. Another important class of objective priors are the probability matching priors, fi rst proposed in Welch and Peers (1963). The aim is to obtain a prior distribution under which the posterior probabilities of certain regions coincide with their cover age probabilities, either exactly or approximately . For example, if we consider the model f ( x | θ ) , and t ( p , α ) is the α –quantile of the posterior , and P f { θ ≤ t ( p , α ) | x } = t ( p , α ) −∞ p ( θ | x ) d θ = α , then p ( θ ) is a probability matching prior . Recent developments of this method can be found in Sweeting et al. (2006) and Sweeting (2008). A different method, based on information theoretical concepts, has been proposed by Zellner and Min (1993), giving the so called maximal data information prior . Although the method gav e rise to some interesting results, such as the derivation of the right-Haar measure for location-scale problems, applications remain limited. Possibly , the most recent development in de fi ning prior distributions, although not in a strictly objective sense, is discussed in Simpson et al. (2017). The idea is to identify the parts in a complex model that require subjective input, while the remaining can be associated to non-informative priors. The comparison between a simple model, say f 0 ( · | η 0 ) and a richer and more fl exible alternative, say f ( · | η ) , is done by assigning a prior on η that penalises for complexity (on the basis of the Kullback–Leibler divergence between the two models). The other parameters (may) have objective priors assigned upon. A fi nal consideration is reserved for discrete parameter spaces, whose systematic discussion can be seen to be generated by the paper of Rissanen (1983). The lack of general methods, due to the challenges that discreteness imposes, has been fi lled by Berger et al. (2012) fi rst, and by Villa and W alker (2015) later . As previously mentioned, for a recent and thorough review of the objective Bayesian approaches so far developed, we refer the reader to Consonni et al. (2018). 1.7 Organisation of the paper The paper is organised as follows. In Section 2 we introduce the foundations of the proposed prior on the basis of scoring rules and their properties. An interesting aspect of the prior based on scoring rules is its interpretation in terms of the information content carried by the prior itself . This aspect is explored in Section 3. In Section 4 we present the objective priors concentrating on Θ = ( 0 , 1 ) , ( 0 , ∞) and (−∞ , + ∞) . The implementation of the prior for some speci fi c applications is presented in Section 5. Finally , Section 6 is dedicated to some fi nal remarks. 10 2 | P R I O R S F R O M S C O R I N G R U L E S Let us consider a quantity of interest, θ , which can take values in the space Θ . The fundamental argument behind objective prior distributions is that they should represent a state of actual or alleged prior ignorance about the true value of θ . Sever al criteria have been proposed to select such a prior , all of which assume that a probabilistic model generating the data (given θ ) has been chosen. What we propose is to avoid this choice and derive a prior depending on Θ only . The idea is to measure the quality of the prior p with a proper scoring function, say S ( θ , p ) , and assume it to be constant, as discussed in the Introduction. De fi nition A density p with respect to the Lebesque measure on Θ , is objective (in accordance with commonly accepted meaning of the expression) if S ( θ , p ) = 1 for all θ ∈ Θ , where S is a proper scoring rule. Before proceeding we provide a brief discussion on scoring rules. Scoring rules are proper if Θ S ( θ , p ) q ( θ ) d θ is mini- mized at p = q and local if it depends on p only through the value p ( θ ) . The unique proper local scoring rule is the log score, de fi ned as S L ( θ , p ) = − log p ( θ ) . (4) Parry et al. (2012) extend the local property to m –local, in that now S ( θ , p ) depends also on the l -derivative p ( l ) ( θ ) , for 0 ≤ l ≤ m . In particular , for m = 2 , there is the Hyvärinen scoring rule, (Hyvärinen, 2005), given by S H ( θ , p ) = ∂ 2 ∂ θ 2 log p ( θ ) + 1 2 ∂ ∂ θ log p ( θ ) 2 . (5) Consequently , our choice of scoring rule is S ( θ , p ) = S L ( θ , p ) + S H ( θ , p ) = − log p ( θ ) + p 0 0 ( θ ) p ( θ ) − 1 2 p 0 ( θ ) p ( θ ) 2 . (6) That this is a proper scoring rule is derived from the fact that it is a sum of two proper scoring rules. It is also clearly 2 –local. Previously , priors have been sought based solely on log p ; for example, the reference prior , and the math becomes unnatural as a consequence. On the other hand, including higher derivatives yields well de fi ned solutions to optimization procedures. That we set this score to 1 for all θ is done without loss of generality , as we shall see later on. That we understand this to be an objective procedure is evident from the fact that no part of Θ is being given preference; the loss at θ for our choice of p ( θ ) is the same for all θ . For , if S ( θ , p ) did depend on θ then we argue that this could only be driven by information ; i.e. parts of Θ space are preferential to others. It is to be noted that we have summed the two scores directly without introducing any weighting; for we could have used S w ( θ , p ) = S L ( θ , p ) + w S H ( θ , p ) . The choice of w = 1 is a calibration issue between the two scores; i.e. to put them on a comparable scale. The reason for w = 1 is that for the benchmark standard normal density function, i.e. p ( θ ) ∝ e − 1 2 θ 2 , the difference between the scores S L and S H is a constant (i.e. does not depend on θ ), and so one does not end up dominating the other , only for w = 1 . Hence, we see that the objective prior p ( θ ) is obtained by solving the following differential equation: p 0 0 ( θ ) p ( θ ) − 1 2 p 0 ( θ ) p ( θ ) 2 = 1 + log p ( θ ) . (7) 11 T o derive the solution, we have the following result. Theorem 1 The solution to (7) is given by p ( θ ) ∝ e − u ( θ ) with u solving u 0 ( θ ) = ± c e u ( θ ) − 2 { 1 + u ( θ ) } , for some suitable constant c . Proof Solving the differential equation (7) is equivalent to solving the following differential equation; u ( θ ) 0 0 − 1 2 { u ( θ ) 0 } 2 = u ( θ ) , (8) where we have u ( θ ) = − log p ( θ ) . Strictly we have u 0 0 − 1 2 ( u 0 ) 2 = u − 1 but if u solves this then u + 1 solves (8). The 1 here is the same one which appears in the S ( θ , p ) = 1 and hence con fi rming the “without loss of generality” in the choice of 1 as a constant. By now letting v = u 0 we have v d v d u = u + 1 2 v 2 , which has the solution v ( θ ) = u 0 ( θ ) = ± c e u ( θ ) − 2 { 1 + u ( θ ) } , (9) for a suitable c . The missing pieces in equation (9) are c and say u ( 0 ) , two constants of integration. We will see how to complete these when we look at illustrations in Section 4. In general, as the solution depends on the above two arbitrary constants, our method provides a class of solutions, where some are proper and some are improper and, more general, where the priors will have some assigned properties via speci fi cation of ( c , u ( 0 )) . We also note here that we do not need the normalizing constant for p and neither do we need to fi nd an explicit solution for u , and p , beyond (9). The reason for this is that we can fi nd an accurate solution via numerical methods; i.e. if we have u ( θ ) at a particular θ value, then we can evaluate u ( θ + ε ) = u ( θ ) + ε u 0 ( θ ) + 1 2 ε 2 u 0 0 ( θ ) + o ( ε 2 ) for small ε , and the u 0 and u 0 0 are available explicitly , with u 0 as in equation (9) , u 0 0 = 1 2 c e u − 1 , and with the ease of obtaining higher derivatives if needed. From here we can evaluate p ( θ ) . Finally , in this section, we describe the multidimensional solution. So suppose that θ = ( θ 1 , . . . , θ k ) . Without needing to replicate the mathematics, we can easily derive the solution as p ( θ ) ∝ exp (− u ( θ )) with ∂ u / ∂ θ j = ± c j e u ( θ ) − 2 ( 1 + u ( θ )) , j = 1 , . . . , k , where the additional free parameters are the ( c j ) . We can again solve for u using the multivariate version of the T aylor approximation. 12 3 | VA R I A T I O N A L P R O B L E M S A N D S O L U T I O N S Here we provide an alternative derivation of (7) using information theory , speci fi cally entropy information and Fisher information. We show that the p solving (7) can also be regarded as a density carrying minimal local information. This material then is to provide support for the solution to (7) being an objective prior . The entropy information (negative entropy) of a density function p is given by I E ( p ) = p ( θ ) log p ( θ ) d θ , which is related to Shannon ’s entropy and is equal to negative the expected self–information loss. In addition to I E ( p ) , we consider a measure of the information in the density p known as Fisher information, given by I F ( p ) = p 0 ( θ ) 2 p ( θ ) d θ = p ( θ ) ∂ ∂ θ log p ( θ ) 2 d θ . (10) See for example Bobkov et al (2014). Now consider I ( p ) = I E ( p ) + 1 2 I F ( p ) and the aim is to fi nd the p which minimizes I ( p ) . Recalling variational methods (Rustagi, 1976), if we wish to minimise b a L ( θ , p , p 0 ) d θ , a necessary condition for a local extremum of the integral of the Lagrangian L ( θ , p , p 0 ) is that ∂ L ∂ p = d d θ ∂ L ∂ p 0 . (11) Minimising b a L ( θ , p , p 0 ) d θ reduces to the classical calculus of variation problem where we want to extremize the integral of the function L ( θ , p , p 0 ) = 1 2 p 0 ( θ ) 2 p ( θ ) + p ( θ ) log p ( θ ) . (12) The solution to the extremal problem, if it e xists, is obtained from the Euler–Lagrange equations, given by (11). According to page 44 of Rustagi (1976), if L ( p , p 0 ) is strictly conve x on ( 0 , ∞) × (−∞ , + ∞) , and p satis fi es the Euler equation, then p is a minimum of b a L ( θ , p , p 0 ) d θ . Now L ( p , p 0 ) is strictly conve x if the matrix H = ∂ 2 L / ∂ p 2 ∂ 2 L / ∂ p ∂ p 0 ∂ 2 L / ∂ p ∂ p 0 ∂ 2 L / ∂ ( p 0 ) 2 is positive de fi nite. Theorem 2 A minimum satisfying the Euler–Lagrange equations is given by the p solving the differential equation p 0 = ± p c /( e p ) + 2 log p , for some suitable c . 13 Proof Calculations give H = 1 p κ 2 + 1 − κ − κ 1 where κ = p 0 / p . This is easily seen to be a positive de fi nite matrix; the eigenvalues are given by 1 p 1 2 ( 2 + κ 2 ) ± 1 4 ( 2 + κ 2 ) 2 − 1 , which are positive. Then equation (11), after some elementary algebra and differentiation, leads to the following differential equation, p 0 0 ( θ ) p ( θ ) − 1 2 p 0 ( θ ) p ( θ ) 2 = 1 + log p ( θ ) , which is the same as (7). This differential equation has the solution derived in the previous section. It is interesting that the Euler–Lagrange equations are solved by precisely the same p solving equation (7). 4 | I L L U S T R A T I O N S T o illustrate the proposed method we consider three common parameter spaces. In particular , we consider the space for a parameter representing a probability , that is Θ = ( 0 , 1 ) , the space Θ = ( 0 , ∞) , usually representing the support of scale parameters and, fi nally , the support for (location) parameters Θ = (−∞ , + ∞) . The aim here is to solve (11) for particular motivated choices of ( c , u ( 0 )) , equivalently , ( c , p ( 0 )) or ( p 0 ( 0 ) , p ( 0 )) . In fact, the solutions to the Euler–Lagrange equations are many , and the choice of the two constants ( c , u ( 0 )) will then determine a unique solution. Now there is the fl at solution for all Θ in (7) given by p ( θ ) ∝ 1 . This is achieved by setting c = 2 and u ( 0 ) = 0 . However , in each of the settings of Θ considered we can fi nd alternate priors with particular features. So, e.g. for Θ = ( 0 , 1 ) we ask that p ( 0 ) = p ( 1 ) = 0 and for Θ = ( 0 , ∞) we ask that p is conve x and decreasing. Case Θ = 0 , 1 . Here we consider the u function, recall p ∝ e − u , and so for p ( 0 ) = p ( 1 ) = 0 we require u ( 0 ) = u ( 1 ) = ∞ . F or additional symmetry , we can take u 1 2 = w > 0 and taking c = 2 as the extremal value, we have u 0 = √ 2 √ e u − 1 − u θ > 1 2 u 0 = − √ 2 √ e u − 1 − u θ < 1 2 . Note there is a discontinuity in the derivative of u at θ = 1 2 . As w increases it is that u ( 0 ) and u ( 1 ) got to ∞ . A plot of u is given in Fig. 1 for w = 1 . 1 and in Fig. 2 for w = 1 . 14 . For these fi gures we used a grid of 1000 either side of θ = 1 2 to obtain the numerical solutions. In the latter case, the corresponding density for p is presented in Fig. 3. 14 0.0 0.2 0.4 0.6 0.8 1.0 1 2 3 4 5 6 7 8 theta u F I G U R E 1 Numerical solution for u with w = 1 . 1 0.0 0.2 0.4 0.6 0.8 1.0 5 10 15 20 theta u F I G U R E 2 Numerical solution for u with w = 1 . 14 15 0.0 0.2 0.4 0.6 0.8 1.0 0.0 0.2 0.4 0.6 0.8 1.0 1.2 theta density F I G U R E 3 Numerical solution for normalized p with w = 1 . 14 It also possible to obtain a prior that mimics Jeffreys’; that is, a distribution that has spik es at θ = 0 and θ = 1 with the lowest value at θ = 1 2 . This is done by simply inverting u : i.e. set u = − u in the above prior . Case Θ = 0 , ∞ . F or a prior de fi ned on the space ( 0 , ∞) we require a speci fi c shape property for p (con vex and decreasing) and then take extremal values for the c and u ( 0 ) . This property is common to most objective priors on ( 0 , ∞) . Thus, since p 0 < 0 we require u 0 > 0 and so u 0 = c e u − 2 ( 1 + u ) , and for u 0 to exist for all u we must have c ≥ 2 . Thus, as an extremal value, we take c = 2 . F or the prior to be conve x we require p 0 0 ≥ 0 . Now p 0 = − u 0 p implying p 0 0 = p ( u 0 ) 2 − u 0 0 . Therefore, p is conve x when ( u 0 ) 2 ≥ u 0 0 . From (8) and (9) we have ( u 0 ) 2 = c e u − 2 ( 1 + u ) and u 0 0 = 1 2 c e u − 1 , and hence we are interested in the u ( 0 ) for which c = 2 ≥ 2 ( 1 + 2 u ) e − u for all u ; i.e. ( 1 + 2 u ) e − u ≤ 1 for all u . Given that the function ( 1 + 2 u ) e − u is maximum, with a value of 1 . 31 , at u = 1 2 , and u is increasing, since u 0 > 0 , we need u ( 0 ) > 1 2 and ( 1 + 2 u ( 0 )) e − u ( 0 ) = 1 , again as an extremal value. Solving this gives a value for u ( 0 ) of approximately 1.31. In the next result we show that u 0 is bounded away from 0, and this will have important consequences for the properness of p . Lemma 3 It is that u 0 is bounded away from 0. Proof T o show this we need to show that e u − 1 − u is bounded away from 0 for u ≥ u ( 0 ) . This follows trivially since e u − 1 − u ≥ 1 2 u 2 ≥ 1 2 u ( 0 ) 2 . The result of Lemma 3 has also the implication that p is a proper density function. T o show this, we require Gronwall’s in- equality (Gronwall, 1919). This inequality states that, if f and g are real valued functions on Θ = ( 0 , ∞) , g is differentiable on int ( Θ ) , and g 0 ( t ) ≤ g ( t ) f ( t ) for all t ∈ Θ then g ( t ) ≤ g ( 0 ) exp t 0 f ( s ) d s . 16 Lemma 4 If p ( 0 ) < ∞ , it is that p ( θ ) ≤ p ( 0 ) e − θ , and hence p is proper . Proof Since p 0 = − u 0 p and we have u 0 ≥ for some > 0 , it is that p 0 ≤ − p . From Gronwall’s lemma, with f ( t ) = − and g = p , we have that p ( θ ) ≤ p ( 0 ) exp − θ 0 d s , and hence the proof is complete. T o have a graphical image, in Figure 4 we plot the prior using the approximation available via a numerical solution to the differential equation for p . Note that this is the unnormalised p . F I G U R E 4 Global prior distribution for the case Θ = [ 0 , ∞) , with c = 2 and u ( 0 ) = 1 . 31 Case Θ = −∞ , + ∞ . A solution here is a symmetric version of the case Θ = ( 0 , + ∞) , which will represent a proper prior . On the other hand, if we ask that p is smooth at the origin, i.e. p 0 ( 0 ) = 0 , then we need u 0 ( 0 ) = 0 and hence we must take ( c , u ( 0 )) to satisfy c e u ( 0 ) = 2 + 2 u ( 0 ) . If now we take c = 2 , then u ( θ ) is a constant, resulting in a fl at (improper) prior for p . F or a proper prior here one could tak e u ( 0 ) to be small, say u ( 0 ) = 0 . 01 and then to take c = 2 { 1 + u ( 0 ) } / exp { u ( 0 ) } . We computed numerically the right side; i.e. the ( 0 , ∞) side, for p , which is shown in Fig. 5. 17 0 1 2 3 4 5 6 0.0 0.2 0.4 0.6 0.8 1.0 theta (unormalized) density F I G U R E 5 Right side of (unnormalized) prior p which is proper and differentiable at origin T o make the value of u ( 0 ) more diverted, we could equally set a motivated choice for p ( 0 ) = 1 / { σ √ 2 π } , corresponding to a normal density with zero mean and variance σ 2 . 5 | A P P L I C A T I O N S Although we do not have an explicit form for p ( θ ) , we can use (9) to calculate it numerically quite easily . In particular , if we know p ( θ ) then we calculate p ( θ + δ θ ) for small δ θ , hence setting up the possibility of a posterior estimation process via Metropolis–Hastings sampling. The algorithm employed is detailed in the Appendix. T o be speci fi c, suppose we are currently at θ and the proposal value is θ 0 . The acceptance probability is α = min 1 , l ( θ 0 ) l ( θ ) p ( θ 0 ) p ( θ ) q ( θ | θ 0 ) q ( θ 0 | θ ) , (13) where l ( θ ) is the likelihood function, and q ( θ 0 | θ ) is the proposal density . The evaluation of p ( θ 0 )/ p ( θ ) in equation (13) does not represent any particular challenge. In fact, we have p ( θ 0 )/ p ( θ ) = exp { −[ u ( θ 0 ) − u ( θ )] } , where u is the solution of the differential equation u 0 = c e u − 2 ( 1 + u ) . (14) Equation (14) allows us to evaluate u ( θ 0 ) − u ( θ ) numerically , via u ( θ 0 ) ≈ u ( θ ) + ( θ 0 − θ ) u 0 ( θ ) + ( θ 0 − θ ) 2 2 u 0 0 ( θ ) + ( θ 0 − θ ) 3 6 u 0 00 ( θ ) , 18 5.1 M I X T U R E M O D E L S where u 0 ( θ ) = c e u ( θ ) − 2 ( 1 + u ( θ )) , u 0 0 ( θ ) = 1 2 c e u ( θ ) − 1 , and u 0 00 ( θ ) = 1 2 c e u ( θ ) c e u ( θ ) − 2 ( 1 + u ( θ )) , and so on. Depending on how far θ 0 is from θ we can either use the direct approximation just given or otherwise get from θ to θ 0 using smaller step sizes. Before showing the results of a thorough simulation study in Section 5.4, we consider the following two applications based on single i.i.d. samples: 1. X 1 , . . . , X n ∼ Poisson ( θ ) , where we assume our prior on the unknown parameter θ > 0 , that is a sample space ( 0 , ∞) . 2. X 1 , . . . , X n ∼ N ( µ , 1 ) , where we assume our prior on the unknown parameter µ ∈ Ò , that is a sample space (−∞ , ∞) . In the fi rst illustration we sample n = 100 observations from a Poisson distribution with mean value θ = 2 . 5 . The Metropolis–Hastings has been run with c and u ( 0 ) set as discussed in Section 4, and the results for 100,000 iterations are shown in Figure 6 (posterior sample) and in Figure 7 (posterior histogram). Both fi gures show a good mixing and a posterior distribution that accumulates around the true parameter value. Iteration × 10 4 0 1 2 3 4 5 6 7 8 9 λ 1.8 2 2.2 2.4 2.6 2.8 3 3.2 F I G U R E 6 Posterior chain for θ of a Poisson distribution with mean θ = 2 . 5 . F or the second illustration we have sampled n = 100 observations from a normal density with mean µ = 5 and (known) variance equal to one. Here, for a total of 100,000 iterations, we had the results in Figure 8 (posterior sample) and Figure 9 (posterior histogram). In this case too the results are satisfactory . 5.1 Mixture models In this section we discuss the application of the proposed method to a scenario where objective priors have been notoriously challenging. If we consider mixture models, it is well known that the use of objective priors (Grazian and Robert, 2018) has to be done carefully , as this type of model is subject to issues related to non-identi fi ability , unbounded likelihoods, etc. The fact is that improper priors may not be appropriate as we might not observe outcomes from every component of the mixture (Titterington et al., 1985). For e xample, Grazian and Robert (2018) show that Jeffreys prior 5.1 M I X T U R E M O D E L S 19 λ 1.8 2 2.2 2.4 2.6 2.8 3 3.2 0 1000 2000 3000 4000 5000 6000 7000 8000 F I G U R E 7 Posterior histogram for θ of a Poisson distribution with mean θ = 2 . 5 . Iteration × 10 4 0 0.5 1 1.5 2 2.5 3 3.5 4 4.5 µ 4.4 4.5 4.6 4.7 4.8 4.9 5 5.1 5.2 5.3 5.4 F I G U R E 8 Posterior chain for µ of a normal density with mean µ = 5 . is suitable for mixtures of normal densities only in certain circumstances; that is when the unknown parameters are the weights. If the unknown parameters are the means or the variances, then using Jeffreys prior leads to improper posteriors. In particular , if the unknown parameters are the means only , we need at most two components to have proper posteriors; while, if the unknown parameters are the variance or the mean and the variances, then Jeffreys priors are not suitable for inference. The authors also generalise the result to any type of mixture. Given that the objective prior we propose is proper , it allows to make inference on the parameters of a mixture density as the yielded posteriors will be proper . As an illustration, we consider a mixture of three normal densities, where the weights and the parameters of the components are unknown. In particular , we sample from the following model f ( y | ω 1 , ω 2 , ω 3 , µ 1 , µ 2 , µ 3 , σ 2 1 , σ 2 2 , σ 2 3 ) = 3 i =1 ω i N ( µ i , σ 2 i ) , (15) with weights ω 1 = 0 . 25 , ω 2 = 0 . 35 and ω 3 = 0 . 40 , means µ 1 = − 3 . 5 , µ 2 = 0 and µ 3 = 2 . 5 , and variances σ 2 1 = 0 . 5 , σ 2 2 = 0 . 1 20 5.1 M I X T U R E M O D E L S µ 4.4 4.5 4.6 4.7 4.8 4.9 5 5.1 5.2 5.3 5.4 0 500 1000 1500 2000 2500 3000 3500 4000 F I G U R E 9 Posterior histogram for µ of a normal density with mean µ = 5 . and σ 2 3 = 1 . 2 . Note that we have chosen mixture components that are reasonably distant, so not to be forced to impose any constraint to overcome identi fi ability , as the focus of the paper is not in this sense. However , the implementation of constraints in that sense is straightforward. For the parameters we have chosen prior independence, where each prior is the prior on the space ( 0 , 1 ) for the weights, on the space (−∞ , ∞) for the means and on the space ( 0 , ∞) for the variances, in agreement with Section 4. The prior on (−∞ , ∞) is the symmetrised version from Θ = ( 0 , ∞) . In the fi rst illustration we sample n = 100 observations from the above mixture. In Figure 10 we can see an histogram of the sampled data. y -5 -4 -3 -2 -1 0 1 2 3 4 5 0 2 4 6 8 10 12 F I G U R E 1 0 Sample of size n = 100 from mixture (15). The posterior distributions have been obtained by implementing the Metropolis sampling de fi ned above within a Gibbs sampler . Using the same initial settings of c and u ( 0 ) as above, for a total of 10,000 iterations, we obtain the results in Figure 11. The plots show clear convergence of the posterior chains and reasonable inferential results. In the second illustration we have increased the sample size ( n = 250 ) from the above model (15) , performing the same procedures with the same prior distributions. The histogram of the sample data is in Figure 12, while the posterior 5.2 M O D E L C O M PA R I S O N 21 traces and histograms are in Figure 13. y -6 -4 -2 0 2 4 6 0 5 10 15 20 25 F I G U R E 1 2 Sample of size n = 250 from mixture (15). We see in this case as well good performances of the prior with good inferential results. 5.2 Model comparison In this section we employ the objective prior in model selection. T o illustrate a more comprehensive use, we decide to compare a Poisson distribution and a geometric distribution for some values of the parameters and for two sample sizes: n = 30 and n = 100 . The problem is then formalised by considering the following two models M 1 = f 1 ( x | θ ) = θ x e − θ / x ! , p 1 ( θ ) and M 2 = { f 2 ( x | φ ) = φ ( 1 − φ ) x , p 2 ( φ ) } , where p 1 ( θ ) is the prior for the case ( 0 , ∞) , as de fi ned in Section 4, and p 2 ( φ ) is the uniform prior on the interval ( 0 , 1 ) . By setting P ( M 1 ) = P ( M 2 ) , we perform the model comparison by means of the Bayes Factor: B 12 = m 1 ( x ) m 2 ( x ) = f 1 ( x | θ ) p 1 ( θ ) d θ f 2 ( x | φ ) p 2 ( φ ) d φ . The simulation e xercise is performed by fi rst drawing 100 samples from M 1 and counting the proportion of times the B F 12 > 1 ; then, we draw 100 samples from M 2 and count the proportion of times B F 12 < 1 . ideally , in both cases, we would like to have a proportion close to 100 %. T able 1 and T able 2 show the simulation results for , respectively , n = 30 and n = 100 . Under each true model we report the minimum and the maximum Bayes Factor B F 12 and the number of ex ceptions, indicating the number of times the “wrong” model is selected. While for n = 100 there are no e xceptions, we note one e xceptions in three case for n = 30 . Given the amount of information about the true model in the data is limited, the ex ceptions do not raise any particular concern. 22 5.2 M O D E L C O M PA R I S O N T rue model M 1 M 2 Exceptions θ φ min max min max M 1 M 2 5 0.5 611 . 77 1 . 07 × 10 11 2 . 97 × 10 − 45 7 . 08 × 10 − 21 0 0 2 0.5 0 . 69 4 . 02 × 10 05 1 . 45 × 10 − 11 0 . 45 1 0 2 0.2 3 . 00 4 . 13 × 10 06 2 . 87 × 10 − 77 58 . 39 0 1 2 0.8 0 . 22 8 . 15 × 10 05 1 . 66 × 10 − 23 2 . 28 × 10 − 08 1 0 5 0.8 1 . 28 × 10 03 6 . 58 × 10 10 2 . 92 × 10 − 60 3 . 69 × 10 − 45 0 0 T A B L E 1 Model comparison for n = 30 . Minimum and maximum Bayes Factor under true model M 1 (Poisson) and M 2 (geometric) for 100 draws. T rue model M 1 M 2 Exceptions θ φ min max min max M 1 M 2 5 0.5 2 . 47 × 10 13 1 . 68 × 10 30 6 . 62 × 10 − 132 2 . 15 × 10 − 79 0 0 2 0.5 5 . 13 × 10 03 2 . 90 × 10 14 4 . 10 × 10 − 31 2 . 96 × 10 − 09 0 0 2 0.2 5 . 87 × 10 03 1 . 76 × 10 16 9 . 43 × 10 − 127 2 . 19 × 10 − 28 0 0 2 0.8 2 . 80 × 10 04 2 . 40 × 10 15 8 . 97 × 10 − 67 1 . 25 × 10 − 43 0 0 5 0.8 7 . 57 × 10 15 1 . 39 × 10 29 4 . 96 × 10 − 189 8 . 95 × 10 − 147 0 0 T A B L E 2 Model comparison for n = 100 . Minimum and maximum Bayes Factor under true model M 1 (Poisson) and M 2 (geometric) for 100 draws. 5.2.1 Nested models When models under comparison are nested, there are particular considerations which are needed to be taken into account; see, for example, Consonni et al. (2013). The point is that a diffuse type prior for the larger model will end up lacking focus so that the mass assigned to the smaller model is too much. However , our argument is that if two nested models are under comparison, it is essential, at least from a coherent point of view, to center the larger prior on the fi xed part of the smaller one. Let us elaborate. Suppose f ( y | θ ) for θ ∈ Θ 1 is the larger model and the smaller one is given by θ ∈ Θ 0 where Θ 0 ⊂ Θ 1 . T ypically Θ 1 will be a higher dimension to Θ 0 and to get the latter from the former one fi xes a particular value in the higher dimension. T o make this concrete, let us consider Example 2.1 from Consonni et al. (2013), where M 0 : f ( y | θ 0 ) is binomial ( n , θ 0 ) , with θ 0 = 1 / 4 fi xed, and M 1 : f ( y | θ ) is binomial ( n , θ ) , for which a prior for θ , p ( θ ) , is required. Given the nature of the comparison it is our argument that p ( θ ) must be centered on θ 0 . We can adapt quite easily the prior obtained in Section 4, the Θ = ( 0 , 1 ) , to be centered on 1 / 4 rather than 1 2 . Without repeating the mathematics, we can take u ( 1 / 4 ) = w and c = 2 and then u 0 = √ 2 √ e u − 1 − u θ > 1 / 4 u 0 = − √ 2 √ e u − 1 − u θ < 1 / 4 . 5.2 M O D E L C O M PA R I S O N 23 F or the illustration of the prior p ( θ ) , obtained numerically from u , in Fig 14 we took w = 1 . 5 . 0.0 0.2 0.4 0.6 0.8 1.0 0.0 0.5 1.0 1.5 2.0 theta p(theta) F I G U R E 1 4 Numerical solution for normalized p with w = 1 . 5 The proposed prior , centered at θ 0 = 0 . 25 , is compared with the intrinsic prior in Consonni et al. (2013), that is p I ( θ | b , t ) = t x =0 Beta ( θ | b + x , b + t − x ) Bin ( x | t , θ 0 ) , where b = 1 and t = 8 . The intrinsic prior de fi ned above is centered at w θ 0 + ( 1 − w ) 1 2 , where w = t /( 2 b + t ) , and has behaviour similar to the one in Figure 14, giving the Intrinsic Bayes Factor in favour of M 1 B I 10 = 8 x =0 B ( 1 + x + y , 1 + t − x + n − y ) B ( 1 + x , 1 + t − x ) θ y 0 ( 1 − θ 0 ) n − y , where n = 12 . A relatively small sample size allows to better capture differences in the performance of the two priors. Figure 15 shows the posterior probability for M 1 , i.e. P ( M 1 | y ) = ( 1 + 1 / B I 10 ) − 1 . 24 5.3 P O I S S O N R E G R E S S I O N 0.00 0.25 0.50 0.75 1.00 θ 0.0 0.1 0.2 0.3 0.4 0.5 0.6 0.7 0.8 0.9 1.0 P(M 1 |y) Intrinsic Prior Proposed Prior F I G U R E 1 5 Small sample evidence for the Binomial e xample. The graph shows the posterior probability for model f ( y | θ ) = Bin ( n = 12 , θ ) using the proposed prior (squares) and the intrinsic prior (circles). The priors yield model probabilities that are similar; in fact in both cases the lowest point is at θ = θ 0 and, the more θ moves away from θ 0 the higher the posterior probability for M 1 . 5.3 Poisson regression In this section we show how the proposed prior can be used in estimating the parameters of a Poisson regression model. We will apply the prior to both simulated and real data. Let us consider the following Poisson regression model y i ∼ Poisson ( θ i ) , i = 1 , . . . , n with θ i = exp k j =1 x i j β j . The covariates are the x i j ’s, with the corresponding vector of parameters β = ( β 1 , . . . , β k ) . In this section we show how we make inference on the vector β by using the prior in the form p ( β ) = p ( β 1 ) × · · · × p ( β k ) , where p ( β j ) is the prior de fi ned on the interval (−∞ , ∞) . Again, this prior is the symmetrised version of the prior on ( 0 , ∞) . We start by setting k = 5 , with β = (− 0 . 8 , − 0 . 5 , 0 , 0 . 5 , 0 . 8 ) , and we simulate the covariate values from a multivariate normal with vector of means β and variance matrix a diagonal matrix of dimension k . The vector of observations of the response variable y is obtained from a Poisson distribution with mean exp ( x β ) . Applying the algorithm in the Appendix, with 50,000 simulations and a burn-in period of 25,000, the posterior 95% credible intervals for the β ’s are represented in the caterpillar plot in Figure 16. 5.3 P O I S S O N R E G R E S S I O N 25 We can see that the intervals contain the true parameter values, showing the effectiveness of the inferential approach using the proposed prior . T o verify the robustness of the procedure, we have included random noise by adding, fi rst 5 and then another 10, covariates with true value equal to zero. The results are in Figure 17 and Figure 18. Again, we see that the posterior intervals comprise the true values with no evident impact on their size when noise is added. T o show the application of the prior on a real data set, we consider the n = 78 observations on bilateral sanctions behaviour , for selected years, in the period 1939–1983 (Martin, 1992). In particular , we replicate the analysis in Goodrich and Lu (2013), where the number of sanctions (‘num’) is regressed on the political stability and economic health of the country targeted by the sanction (’target’) and the level of international cooperation (‘coop ’). For the covariates, the coding is described in T abl 3. Meaning V alue ‘target’ ‘ coop ’ 1 Severe stress No cooperation 2 Mildy stable Minor cooperation 3 Relatively stable Modest cooperation 4 NA Signi fi cant cooperation T A B L E 3 Coding of the covariates representing the political stability and economic wealth of the nation targeted by the sanction (values from 1 to 3) and of the level of international cooperation (values from 1 to 4). Therefore, the Poisson regression model will be y i ∼ Poisson ( x i 1 β 1 + x i 2 β 2 + x i 3 β 3 ) , i = 1 , . . . , 78 , where β 1 is the intercept, x i 1 = 1 , for i = 1 , . . . , 78 , x i 2 is the political and wealth level of the target and x i 3 the level of international cooperation; β 2 and β 3 the corresponding coef fi cients. Assuming independent prior knowledge, we have p ( β 1 , β 2 , β 3 ) = p ( β 1 ) p ( β 2 ) p ( β 3 ) and, as for the simulation above, we assign a prior de fi ned on (−∞ , ∞) to each coef fi cient. In the fi rst step of the analysis we have run 50,000 iterations for 4 chains per parameter , where the starting points have been randomly chosen. Figure 19 shows the fi rst 10,000 iterations for each parameter where a fast convergence is clear . T o obtain the inferential results, we have therefore focused on a chain and, considering a burn-in period of 25,000 iterations, we have obtained the trace plots and histograms in Figure 20 and the corresponding posterior statistics in T able 4. In T able 4 we have included the posterior summaries obtained by using default priors, that is normal densities centered at 0 with large variance (Goodrich and Lu, 2013). We can see that the results are very similar , in terms of point estimate, standard deviation and size of the credible interval. 26 5.4 S I M U L AT I O N S T U D Y Proposed Prior Mean sd 95% C.I. β 1 -0.96 0.18 (-1.35, -0.62) β 2 -0.02 0.06 (-0.13,0.09) β 3 1.21 0.05 (1.13,1.30) Default Prior Mean sd 95% C.I. β 1 -0.98 0.17 (-1.33, -0.65) β 2 -0.02 0.06 (-0.13,0.09) β 3 1.21 0.05 (1.12,1.31) T A B L E 4 Posterior mean, standard deviation and 95% credible interval for the real data analysis, under the proposed priors and the default priors. 5.4 Simulation study F or objective priors, it is common practice to analyse some frequentist properties of the yielded posteriors. Furthermore, when available, the performance is compared to the one of other objective priors. We consider two frequentist index es: the cover age (CO VE) of the 95 % credible interval of the posterior distribution and the square root of the mean squared error (MSE) from the posterior mean. Note that, for a scale parameter , say θ , the MSE is computed relatively to the parameter value; that is M S E ( θ )/ θ (RMSE). This is necessary to have a more realistic quanti fi cation of the estimation accuracy , as one would expect the uncertainty to increase as the value of the parameter increases. The study compares the performances of the proposed prior with the ones of the appropriate Jeffreys prior , which can be considered as commonly accepted benchmark of reference. It has to be noted that one would e xpect a larger RMSE when the proposed prior is used, in comparison to any model based prior . In fact, while the former used as information only the sample space, the latter includes the sampling distribution as well. Hence, the informational content of the posterior yielded by the proposed prior has to be less than the one of the posterior yielded by , say , the Jeffreys prior . The fi rst study considers the Poisson as sampling distribution. We repeat the procedure introduced in Section 5 on 250 samples drawn from a Poisson with θ = 1 , 10 , 100 , 500 . The sample sizes considered are n = 3 , n = 10 , n = 30 and n = 100 . The small sample sizes, although not very realistic, allow to better discern the performance of the proposed prior in comparison to the Jeffreys prior . Recalling that, if x ∼ Poisson ( θ ) , then the Jeffreys prior is π J ( θ ) ∝ θ − 1 / 2 , we present the comparison in T ables 5 to 8. Proposed Prior Jeffreys Prior θ RMSE CO VE RMSE COVE 1 0.679 0.95 0.616 0.92 10 0.184 0.94 0.180 0.96 100 0.053 0.94 0.052 0.94 500 0.026 0.92 0.025 0.94 T A B L E 5 Frequentist analysis for θ for n = 3 , for the proposed objective prior and Jeffreys prior . 5.4 S I M U L AT I O N S T U D Y 27 Proposed Prior Jeffreys Prior θ RMSE CO VE RMSE COVE 1 0.316 0.97 0.300 0.96 10 0.100 0.93 0.094 0.94 100 0.034 0.92 0.033 0.93 500 0.014 0.94 0.014 0.96 T A B L E 6 Frequentist analysis for θ for n = 10 , for the proposed objective prior and Jeffreys prior . Proposed Prior Jeffreys Prior θ RMSE CO VE RMSE COVE 1 0.188 0.94 0.177 0.94 10 0.056 0.98 0.054 0.95 100 0.019 0.93 0.016 0.94 500 0.008 0.94 0.007 0.97 T A B L E 7 Frequentist analysis for θ for n = 30 , for the proposed objective prior and Jeffreys prior . Proposed Prior Jeffreys Prior θ RMSE CO VE RMSE COVE 1 0.093 0.95 0.091 0.97 10 0.030 0.96 0.030 0.95 100 0.010 0.96 0.009 0.94 500 0.004 0.93 0.003 0.95 T A B L E 8 Frequentist analysis for θ for n = 100 , for the proposed objective prior and Jeffreys prior . As expected, the RMSE associated to the proposed prior is always larger than the RMSE yielded by the Jeffreys prior (the two e xceptions are a mere consequence of rounding). However , the difference tends to be smaller the larger the sample size, given that the information in the data becomes stronger , so the prior information becomes less important. The cover age is in line with the behaviour one would expect from a minimally informative prior , and the MSE increases as the sample size decreases as there is less information contained in the data. A similar conclusion can be drawn for the second simulation study , where a normal with known variance is considered. In this case, with observations from N ( µ , σ 2 ) (where σ 2 is assumed to be known), where µ = { − 5 , − 4 , . . . , 0 , . . . , 4 , 5 } , Jeffreys prior is π J ( µ ) ∝ 1 . The reported results have been obtained for σ 2 = 1 as there is no impact of the variance on the prior performances. By inspecting Figure 21, we do not notice any sensible difference, in terms of frequentist performance, between the two priors, with the ex ception of a slightly larger MSE for the proposed prior (as expected). 28 6 | D I S C U S S I O N In this paper we have introduced a new class of objective priors derived from scoring rules. A remarkable aspect is that we have been able to show that the same result can be achieved via the rigour of calculus of variations, by fi nding objective priors which solve the Euler–Lagrange equation for fi nding extremum to integrals of the type L ( θ , p , p 0 ) d θ . If we can establish suitable choices of L ( θ , p , p 0 ) which can be motivated and satisfy conditions for the existence of extremum, then new classes of objective prior can be sought. The case we have considered, which we can consider as a fi rst step, is to use a combination of two well known measures of information in a prior density function; i.e. L ( θ , p , p 0 ) = 1 2 p 0 ( θ ) 2 p ( θ ) + p ( θ ) log p ( θ ) . The objective priors here de fi ned have two desirable properties. The fi rst is that they are somewhat detached from the choice of the sampling distribution and are dependent on the parameter space only . In other words, the information required to derive the prior is limited to the range of values that the quantity of interest can take. The second property is that the prior can be proper . Besides the advantage of not having to check properness of the posterior , it allows to exploit the prior in scenarios where improper objective priors have been challenging. For example, as illustrated in Section 5.1, the proposed prior is used to estimate the means of a mixture of normal densities with three components. Another potential application, discussed in Section 5.2, is in model selection. In particular , the objective prior may be used to represent minimal information on the parameters that are not common to two models. In fact, the Bayes factor used to compare two models is, in general, sensitive to the proportionality constant of improper priors. While for common parameters the constant will cancel out, this is not the case if the parameter is either at the numerator or at the denominator of the ratio only . Hence, the necessity of having a proper prior assigned to this kind of parameters. The simulation study , aimed to compare the frequentist performances of the proposed prior with the ones of the Jeffreys prior , has shown no appreciable differences, with the ex ception of a slightly larger MSE for the proposed prior; the last result is expected as it is a consequence of the smaller information used to de fi ne the proposed prior in comparison with any model based objective prior . A C K N O W L E D G E M E N T S The authors would like to thank Guido Consonni for feedback on an earlier draft of the paper . Fabrizio Leisen was supported by the European Community’s Seventh Fr amework Programme [FP7/2007-2013] under grant agreement no: 630677. The third author is partially supported by NSF grant DMS 1612089. R E F E R E N C E S Berger , J. O. (2006). The case for objective Bayesian analysis. Bayesian Analysis , 1 , 1–17. Berger , J. O., Bernardo, J. M. and Sun, D. (2009). The formal de fi nition of reference priors. Annals of Statistics , 37 , 905–938. Berger , J. O., Bernardo, J. M. and Sun, D. (2012). Objective priors for discrete parameter spaces. Journal of the American Statisti- cal Association , 107 , 636–648. REFERENCES 29 Berger , J. O., Bernardo, J. M. and Sun, D. (2015). Over all objective priors (with discussion). Bayesian Analysis , 10 , 189–221. Berger , J. O. and Pericchi, L . R. (1996). The intrinsic Bayes factor for model selection and prediction. Journal of the American Statistical Association , 91 , 109–122. Berger , J. O., Pericchi, L. R., and V arshavsky , J. (1998). Bayes factors and marginal distributions in invariant situations. Sankhya , 60 , 109–122. Berger , J. O. and Strawderman, W . (1993). Choice of hierarchical priors: admissibility in estimation of normal means. T echnical report , 93-34C, Purdue University , Dept. of Statistics. Bernardo, J. M. (1979). Reference posterior distributions for Bayesian inference (with discussion). Journal of the Royal Statistical Society , Series B , 41 , 113–147. Bernardo, J. M. (1979). Noninformative priors do not exist: a discussion with José M. Bernardo. Journal of Statistical Planning and Inference , 65 , 159–189. Bernardo, J. M. and Smith, A. F . M. (1994). Bayesian Theory . John Wiley & Sons, Inc., Hoboken, NJ, USA. doi: 10.1002/9780470316870.ch1. Bhattacharyya, A. K. (1943). On a measure of divergence between two statistical populations de fi ned by their probability dis- tribution. Bulletin of the Calcutta Mathematical Society , 35 , 99–109. Bobko v , S. G., Gozlan, N., Roberto, C. and Samson, P . M. (2014). Bounds on the de fi cit in the logarithmic Sobolev inequality . Journal of Functional Analysis , 267 , 4110–4138. Box, G. E. P . and Tiao, G. C. (1973). Bayesian Inference in Statistical Analysis . Reading, MA: Addison-Wesle y . Clarke, B. and Sun, D. (1997). Reference priors under the chi-square distance. Sankhy ¯ a A , 59 , 215–231. Clarke, B. and Sun, D. (1999). Asymptotics of the expected posterior . Annals of the Institute of Statistical Mathematics , 51 , 163– 185. Clarke, B. and W asserman, L. (1993). Noninformative priors and nuisance parameters. Journal of the American Statistical Associ- ation , 88 , 1472–1432. Clarke, B. and Wasserman, L . (1995). Information trade-off . TEST , 4 , 19–38. Consonni, G., Forster , J. J. and La Rocca, L . (2013). The Whetstone and the alum block: Balanced objective Bay esian comparison of nested models for discrete data. Statistical Science , 28 , 398–423. Consonni, G., Fouskakis, D., Liseo, B. and Ntzoufras, I. (2018). Prior distributions for objective Bayesian analysis. Bayesian Anal- ysis , 13 , 627–679. Dawid, A. P . (1983). Invariant prior distributions. In Encyclopedia of Statistical Sciences , eds. S. Kotz and N. L . Johnson, New Y ork: John Wiley . Dey , D. K., Gelfand, A. E. and Peng, F . (1993). Overdispersed generalized linear models. T echnical report , University of Connecti- cut, Dept. of Statistics. de Finetti, B. (1974). Theory of Probability , Wiley , New Y ork. F onseca, T . C. O. , F erreira, M. A. R. and Migon, H. S. (2008). Objective Bayesian analysis for the Student- T regression model. Biometrika , 95 , 325–333. Ghosh, M. (2011). Objective priors: an introduction for frequentists. Statistical Science , 26 , 187–202. 30 REFERENCES Ghosh, J. K., Delampady , M. and Samanta, T . (2006). An Introduction to Bayesian Analysis . Springer , New Y ork. Ghosh, M., Mergel, V . and Liu, R. (2011). A general divergence criterion for prior selection. Annals of the Institute of Statistical Mathematics , 63 , 43–58. Ghosh, M. and Mukerjee, R. (1992). Non-informative priors. Bayesian Statistics 4 , eds. J. M. Bernardo, J. O. Berger , A. P . Dawid and A. F . M. Smith, Oxford, U.K.: Clarendon Press. Goodrich, B. and Lu, Y . (2013). Poisson-Bay es: Bayesian Poisson regression in Christine Choirat, Christopher Gandrud, James Honaker , Kosuk e Imai, Gary King, and Olivia Lau, Zelig: Everyone ’s Statistical Software , http:/ /zeligproject.org/ Grazian, C. and Robert, C. P . (2018). Jeffreys priors for mixture estimation: properties and alternatives. Computational Statistics and Data Analysis , 121 , 149–163. Gronwall, T . H. (1919). Note on the derivatives with respect to a parameter of the solutions of a system of differential equations. Annals of Mathematics , 20 , 292–296. Hartigan, J. A. (1964). Invariant prior distributions. Annals of Mathematical Statistics , 35 , 836–845. Hyvärinen, A. (2005). Estimation of non-normalized statistical models by score matching. Journal of Machine Learning Research , 6 , 695–709. Ibrahim, J. G. and Laud, P . W . (1991). On Bayesian analysis of generalized linear models using Jeffreys’s prior . Journal of the American Statistical Association , 86 , 981–986. Kass, R. E. (1990). Data-translate likelihood and and Jeffreys’s rule. Biometrika , 77 , 107–114. Kass, R. E. and Wasserman, L . (1996). The selection of prior distributions by formal rules. Journal of the American Statistical Association , 91 , 1343–1370. Jaynes, E. T . (1957). Information theory and statistical mechanics I, II. Physical Review , 106 , 620–630; 108 , 171–190. Jaynes, E. T . (1968). Prior probabilities. IEEE T ransactions on Systems Science and Cybernetics , SSC -4 , 227–241. Jeffreys, H. (1946). An invariant form for the prior probability in estimation problems. Proceedings of the Royal Society of London , Ser . A, 186 , 453–461. Jeffreys, H. (1961). Theory of Probability and Inference , 3rd ed. Cambridge University Press, London. Laplace, P . S. (1820). Essai Philosophique sue les Probbailités . Martin, L . (1992). Coercive Cooperation: Explaining Multilateral Economic Sanctions . Princeton: Princeton University Press. Merhav , N. and Feder , M. (1998). Universal prediction. IEEE T ransactions on Information Theory , 44 , 2124–2147. Natarajan, R. and McCulloch, C. E. (1995). A note on the existence of the posterior distribution for a class of mixed models for binomial responses. Biometrika , 82 , 639–643. O’Hagan, A. (1995). Fractional Bayes factors for model comparison. Journal of the Royal Statistical Society , Series B , 57 , 99–138. Parry , M., Dawid, A. P . and Lauritzen S. (2012). Proper local scoring rules. Annals of Statistics , 40 , 561–592. Rissanen, J. (1983). A universal prior for integers and estimation by minimum description length. Annals of Statistics . 11 , 416– 431. Rubio, F . J. and Liseo, B. (2014). On the independence Jeffreys prior for skew-symmetric models. Statistics & Probability Letters , 85 , 91–97. REFERENCES 31 Rubio, F . J. and Steel, M. F . J. (2018). Flexible linear mixed models with improper priors for longitudinal and survival data. Elec- tronic Journal of Statistics , 12 , 572–598. Rustagi, J.S. (1976). Variational Methods in Statistics . Academic Press. Shannon, C. E. (1948). A mathematical theory of communication. Bell System T echnical Journal , 27 , 379–423. Stone, M. and Dawid, A. (1972). Un-Bayesian implications of improper Bay es inference in routine statistical problems. Biometrika , 59 , 369–375. Syversveen, A. R. (1998). Noninformative Bayesian priors. Interpretation and problems with construction and applications. T echnical Report . Simpson, D., Rue, H., Riebler , A., Martins, T . G. and Sørbye, S. H. (2017). Penalising model component complexity: a principled, practical approach to constructing priors. Statistical Science , 32 , 1–28. Sweeting, T . J. (2008). On predictive probability matching priors. IMS Collections: Pushing the Limits of Contemporary Statistics: Contributions in Honor of Jayanta K. Ghosh , eds. B. Clarke and S. Ghosal. 3 , 46-59. Sweeting, T . J. (2011). Invited discussion of M. Ghosh : Objective priors: an introduction for frequentists. Statistical Science 26 , 206-209. Sweeting, T . J., Datta, G. S. and Ghosh, M. (2006). Nonsubjective priors via predictive relative entropy loss. Annals of Statistics . 34 , 441-468. Titterington, D., Smith, A. and Mako v , U. (1985). Statistical Analysis of Finite Mixture Distributions . John Wiley , New Y ork. V allejos, C. A. and Steel, M. J. F . (2013). On posterior propriety for the Student- t linear regr ession model under Jeffreys priors . Villa, C. and Walk er , S. G. (2015). An objective approach to prior mass functions for discrete parameter spaces. Journal of the American Statistical Association , 110 , 1072–1082. W alker , S. G. (2016). Bayesian information in an experiment and the Fisher information distance. Statistics and Probability Let- ters , 112 , 5–9. Welch, B. L . and Peers, H. W . (1963). On formulae for con fi dence points based on integrals of weighted likelihoods. Journal of the Royal Statistical Society , Series B , 35 , 318–329. Y ang, R. and Chen, M. H. (1995). Bayesian analysis for random coef fi cient regression models using noninformative priors. Jour- nal of Multivariate Analysis , 55 , 283–311 Zellner , A. and Min, C. (1993). Bayesian analysis model selection and prediction. In Physics and Probability: Essays in honour of Edwin T . Jaynes , eds. W . T . Grandy , Jr . and P . W . Milonni, Cambridge, U.K.: Cambridge University Press. 32 REFERENCES A P P E N D I X - M C M C A L G O R I T H M The following algorithm produces a MCMC sample θ ( 0 ) , θ ( 1 ) , . . ., θ ( T ) from the posterior distribution. Suppose to fi x the initial value θ ( 0 ) and repeat the following procedure for t = 1 , . . . , T . Metropolis-Hastings for the prior Suppose that θ ( t ) is the current state of the chain: 1. Draw θ 0 from a proposal distribution q ( · | θ ( t ) ) 2. Evaluate u ( θ 0 ) − u ( θ ( t ) ) numerically , via u ( θ 0 ) = u ( θ ( t ) ) + ( θ 0 − θ ( t ) ) u 0 ( θ ( t ) ) + ( θ 0 − θ ( t ) ) 2 2 u 0 0 ( θ ( t ) ) + ( θ 0 − θ ( t ) ) 3 6 u 0 00 ( θ ( t ) ) + R , where u 0 ( θ ( t ) ) = c e u ( θ ( t ) ) − 2 ( 1 + u ( θ ( t ) )) u 0 0 ( θ ( t ) ) = 1 2 c e u ( θ ( t ) ) − 1 u 0 00 ( θ ( t ) ) = 1 2 c e u ( θ ( t ) ) c e u ( θ ( t ) ) − 2 ( 1 + u ( θ ( t ) )) 3. Compute p ( θ 0 )/ p ( θ ( t ) ) = exp { −[ u ( θ 0 ) − u ( θ ( t ) )] } 4. Set θ ( t +1 ) = θ 0 with probability α = min 1 , l ( θ 0 ) l ( θ ( t ) ) p ( θ 0 ) p ( θ ( t ) ) q ( θ ( t ) | θ 0 ) q ( θ 0 | θ ( t ) ) , and θ ( t +1 ) = θ ( t ) with probability 1 − α Depending on how far θ 0 is from θ we can either use the direct approximation in step 3 with higher order derivatives or otherwise get from θ to θ 0 using smaller step sizes. REFERENCES 33 Iterations 0 1000 2000 3000 4000 5000 6000 7000 8000 9000 10000 -20 -15 -10 -5 0 5 10 15 20 µ 1 µ 2 µ 3 (a) µ -4 -3 -2 -1 0 1 2 3 4 0 500 1000 1500 µ 1 µ 2 µ 3 (b) Iterations 0 1000 2000 3000 4000 5000 6000 7000 8000 9000 10000 -20 -15 -10 -5 0 5 10 15 20 σ 1 σ 2 σ 3 (c) σ 0 1 2 3 4 5 6 0 200 400 600 800 1000 1200 1400 1600 1800 σ 1 σ 2 σ 3 (d) Iterations 0 1000 2000 3000 4000 5000 6000 7000 8000 9000 10000 -1 -0.5 0 0.5 1 1.5 2 ω 1 ω 2 ω 3 (e) ω 0 0.1 0.2 0.3 0.4 0.5 0.6 0.7 0.8 0.9 1 0 200 400 600 800 1000 1200 1400 1600 1800 ω 1 ω 2 ω 3 (f) F I G U R E 1 1 Posterior traces (left) and histograms (right) for the means, (a) and (b), the variances, (c) and (d), the weights, (e) and (f), for a sample of size n = 100 from mixture (15). 34 REFERENCES Iterations × 10 4 0 0.5 1 1.5 2 2.5 3 3.5 4 4.5 5 -20 -15 -10 -5 0 5 10 15 20 µ 1 µ 2 µ 3 (a) µ -4 -3 -2 -1 0 1 2 3 4 0 1000 2000 3000 4000 5000 6000 7000 µ 1 µ 2 µ 3 (b) Iterations × 10 4 0 0.5 1 1.5 2 2.5 3 3.5 4 4.5 5 -20 -15 -10 -5 0 5 10 15 20 σ 1 σ 2 σ 3 (c) σ 0 0.5 1 1.5 2 2.5 3 3.5 4 0 1000 2000 3000 4000 5000 6000 7000 8000 9000 σ 1 σ 2 σ 3 (d) Iterations × 10 4 0 0.5 1 1.5 2 2.5 3 3.5 4 4.5 5 -1 -0.5 0 0.5 1 1.5 2 ω 1 ω 2 ω 3 (e) ω 0 0.1 0.2 0.3 0.4 0.5 0.6 0.7 0.8 0.9 1 0 2000 4000 6000 8000 10000 12000 ω 1 ω 2 ω 3 (f) F I G U R E 1 3 Posterior traces (left) and histograms (right) for the means, (a) and (b), the variances, (c) and (d), the weights, (e) and (f), for a sample of size n = 250 from mixture (15). REFERENCES 35 1 2 3 4 5 −1.0 −0.5 0.0 0.5 1.0 Cov ar iate F I G U R E 1 6 Caterpillar plot representing the 95% credible intervals of the β ’s of a Poisson regression with k = 5 covariates. 2 4 6 8 10 −1.0 −0.5 0.0 0.5 1.0 Cov ar iate F I G U R E 1 7 Caterpillar plot representing the 95% credible intervals of the β ’s of a Poisson regression with k = 10 covariates. 36 REFERENCES 5 10 15 20 −1.0 −0.5 0.0 0.5 1.0 Cov ar iate F I G U R E 1 8 Caterpillar plot representing the 95% credible intervals of the β ’s of a Poisson regression with k = 20 covariates. 0 2000 4000 6000 8000 10000 −4 −2 0 2 4 1:10000 Iteration beta[1] (a) 0 2000 4000 6000 8000 10000 −4 −2 0 2 4 1:10000 Iteration beta[2] (b) 0 2000 4000 6000 8000 10000 −4 −2 0 2 4 1:10000 Iteration beta[3] (c) F I G U R E 1 9 Multiple-trace plots of posterior chains for (a) β 1 , (b) β 2 and (c) β 3 , for the fi rst 10,000 iterations. REFERENCES 37 0 5000 10000 15000 20000 25000 −1.6 Iteration Histogram of b1.mcmc[(burnin + 1):iter s, 4] β 1 −1.6 −1.4 −1.2 −1.0 −0.8 −0.6 −0.4 0 3000 0 5000 10000 15000 20000 25000 −0.2 0.2 Iteration Histogram of b2.mcmc[(burnin + 1):iter s, 4] β 2 −0.2 −0.1 0.0 0.1 0.2 0 0 5000 10000 15000 20000 25000 1.10 Iteration Histogram of b3.mcmc[(burnin + 1):iter s, 4] β 3 1.10 1.15 1.20 1.25 1.30 1.35 1.40 0 2000 F I G U R E 2 0 Posterior trace plots and histograms for β 1 (top), β 2 (middle) and β 3 (bottom). 38 REFERENCES -6 -4 -2 0 2 4 6 µ 0 0.2 0.4 0.6 0.8 1 Global Prior Jeffreys Prior (a) -6 -4 -2 0 2 4 6 µ 0 0.02 0.04 0.06 0.08 0.1 0.12 0.14 0.16 0.18 0.2 Global Prior Jeffreys Prior (b) -6 -4 -2 0 2 4 6 µ 0 0.2 0.4 0.6 0.8 1 Global Prior Jeffreys Prior (c) -6 -4 -2 0 2 4 6 µ 0 0.02 0.04 0.06 0.08 0.1 0.12 0.14 0.16 0.18 0.2 Global Prior Jeffreys Prior (d) F I G U R E 2 1 Normal model. Coverage of the 95 % credible interval of the posterior for θ = 1 , 2 , . . . , 10 for n = 30 (a) and for n = 100 (c), and MSE from the mean for n = 30 (b) and for n = 100 (d). Each graph shows the results for the proposed prior (blue square) and the Jeffreys prior (red diamond).
Original Paper
Loading high-quality paper...
Comments & Academic Discussion
Loading comments...
Leave a Comment