Seafloor crustal deformation data along the subduction zones around Japan obtained by GNSS-A observations
Crustal deformation data obtained by geodetic observation networks are foundations in the fields of geodesy and seismology. These data are essential for understanding plate motion and earthquake sources and for simulating earthquake and tsunami disasters. Although relatively scarce, seafloor geodetic data are particularly important for monitoring the behaviour of undersea interplate boundary regions. Since the mid-1990s, we have been developing the combined Global Navigation Satellite System-Acoustic ranging (GNSS-A) technique for realizing seafloor geodesy. This technique allows us to collect time series of seafloor crustal deformation. Our published data can be used to investigate several seismological phenomena along the subduction zones around Japan, namely the Nankai Trough, Sagami Trough and Japan Trench. These regions are globally important places in geodesy and seismology and are also suitable for comparison with other geophysical datasets. Our intention is for these data to promote further understanding of megathrust zones.
💡 Research Summary
The paper presents a comprehensive dataset of seafloor crustal deformation obtained by the combined Global Navigation Satellite System–Acoustic ranging (GNSS‑A) technique along Japan’s major subduction zones: the Nankai Trough, Sagami Trough, and Japan Trench. Since the mid‑1990s, the Hydrographic and Oceanographic Department of the Japan Coast Guard (JHOD) has refined a seafloor geodetic system that couples a surface‑mounted GNSS antenna, a motion sensor, and an acoustic transducer with an array of acoustic transponders deployed on the seafloor. The authors describe the evolution of the observation system—from an 8‑m aluminum pole used on a drifting vessel (equipment code “A”), to a stainless‑steel pole (code “B”), and finally to a permanently hull‑mounted transducer (code “C”)—which dramatically improved measurement accuracy and reduced observation time from several days to a single 16‑24 hour cruise.
Data acquisition involves continuous GNSS positioning at 2 Hz, vessel attitude recording at 50 Hz, and acoustic travel‑time measurements for each transponder. Sound‑speed structure (SSS) profiles are collected every few hours using CTD, XCTD, and XBT instruments; these profiles are essential for converting travel times into distances. The processing pipeline consists of two iterative steps. First, a linearized least‑squares inversion estimates the absolute seafloor position (SP) using an initial SSS model. Second, the residuals between observed and modeled travel times are used to derive a time‑dependent SSS correction function expressed as a linear combination of basis functions. The inversion iterates until SP converges, achieving centimetre‑level precision.
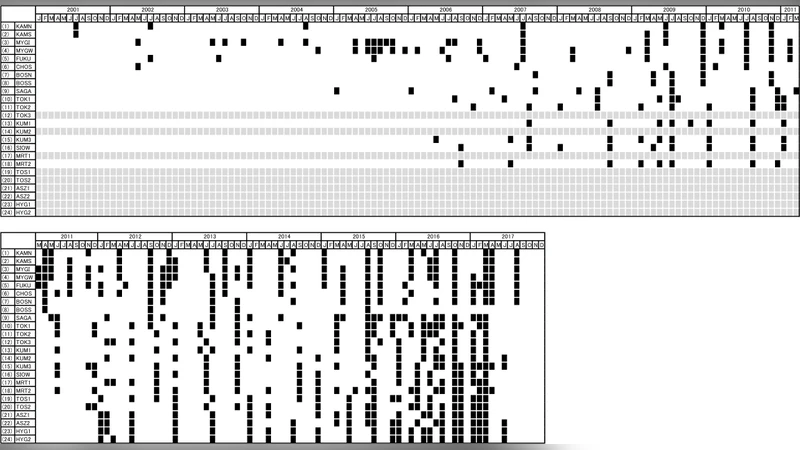
Error sources are categorized into (1) GNSS‑related atmospheric and ionospheric delays, (2) G‑T (GNSS‑to‑transducer) errors arising from vessel‑mounted equipment deformation (particularly in the early aluminum‑pole configuration), and (3) sensor noise. Each observation record includes metadata indicating the equipment code (A, B, or C) and the survey vessel used (codes T, S, M, K for Takuyo, Shoyo, Meiyo, and Kaiyo), enabling users to model and mitigate systematic biases.
The released data are provided in two formats: (i) absolute Earth‑Centered Earth‑Fixed (ECEF) coordinates consistent with ITRF2005 (files ending in “_xyz.txt”), and (ii) relative East‑North‑Up (ENU) displacements referenced to the first epoch (files ending in “_enu.txt”). Both formats contain start/end dates, position vectors, equipment and vessel identifiers, and are distributed via the PANGAEA repository. Notably, the dataset captures the co‑seismic step and post‑seismic deformation associated with the 2005 Off‑Miyagi (Mw 7.2) and the 2011 Tohoku‑oki (Mw 9.0) earthquakes. For the Japan Trench, the authors provide a separate file that isolates the co‑seismic displacement by using only transponders that remained functional before and after the 2011 event.
Scientific value lies in the ability to directly observe inter‑seismic strain accumulation, slip‑deficit rates, and rapid coseismic offsets on the megathrust interface—information that is otherwise inaccessible to land‑based GNSS or InSAR. The authors cite previous studies that have used these data to map coupling along the Sagami and Nankai troughs, estimate slip‑deficit distributions, and model earthquake cycles. The dataset therefore serves as a critical input for seismic hazard assessment, tsunami simulation, and the development of coupled geodetic‑seismic models. By making the time‑series openly available, the authors aim to foster broader use of seafloor geodesy in understanding megathrust dynamics and to encourage integration with other geophysical observations (e.g., seismicity, ocean bottom pressure, and marine gravity).
Comments & Academic Discussion
Loading comments...
Leave a Comment