Digital Urban Sensing: A Multi-layered Approach
Studies of human mobility increasingly rely on digital sensing, the large-scale recording of human activity facilitated by digital technologies. Questions of variability and population representativity, however, in patterns seen from these sources, remain major challenges for interpreting any outcomes gleaned from these records. The present research explores these questions by providing a comparison of the spatial and temporal activity distributions seen from taxi, subway and Citi Bike trips, mobile app records, geo-tagged Twitter data as well as 311 service requests in the five boroughs of New York City. The comparison reveals substantially different spatial and temporal patterns amongst these datasets, emphasizing limitations in the capacity of individual datasets to represent urban dynamics in their entirety. We further provide interpretations on these differences by decomposing the spatial distributions with working-residential balance and different propensities for demographic groups to use different activities. Nevertheless, the differences also highlight the opportunity to leverage the plurality to create multi-layered models of urban dynamics. We demonstrate the capacity of such models to advance urban zoning and socio-economic modeling - two common applications of digital urban sensing.
💡 Research Summary
The paper “Digital Urban Sensing: A Multi‑layered Approach” investigates how multiple digital data streams can be combined to obtain a richer, less biased picture of urban dynamics. Using New York City as a testbed, the authors collect six large‑scale datasets for July 2017: 311 service requests, mobile device location records, geo‑tagged Twitter posts, taxi/Uber pick‑up and drop‑off logs, MTA subway turnstile counts, and Citi Bike trip records. All records are aggregated to the 263 taxi‑zone spatial units and to 56 three‑hour intervals covering a typical week, producing both spatial vectors and weekly temporal profiles for each data source.
First, the authors compare the spatial distributions across datasets and against two static baselines: residential population from the Census and working‑population estimates from the LODES database. Pearson correlation matrices reveal that 311 and mobile data are strongly aligned with residential density, whereas Twitter, taxi, subway and Citi Bike are more similar to the working‑population pattern. This suggests that each digital layer captures a distinct facet of city life.
Second, the temporal dimension is examined by normalising each weekly timeline (L1 norm) and visualising the 56‑bin series. All six series display the expected seven‑day cycle, but the shape differs: transit datasets show a pronounced bimodal peak on weekdays (morning and evening commute) that disappears on weekends; 311, mobile and Twitter exhibit a single daily peak, with 311 slightly ahead of the average baseline and Twitter lagging behind. Correlation of the normalized timelines confirms that mobile and Twitter are almost identical, while the weakest similarity is observed between Citi Bike and Twitter.
Third, to explain the spatial differences, the authors model each activity’s spatial vector A as a linear combination of the working‑population vector W and the residential vector R: A = β W + (1‑β) R. The coefficient β, estimated by ordinary least squares, quantifies the “working‑bias” of each dataset. 311 has β≈0, indicating a purely residential signal, while transit modes and Twitter have β>0.7, reflecting a strong work‑related component. β also varies over the week, peaking during daytime on weekdays and dropping at night and on weekends, mirroring commuting patterns.
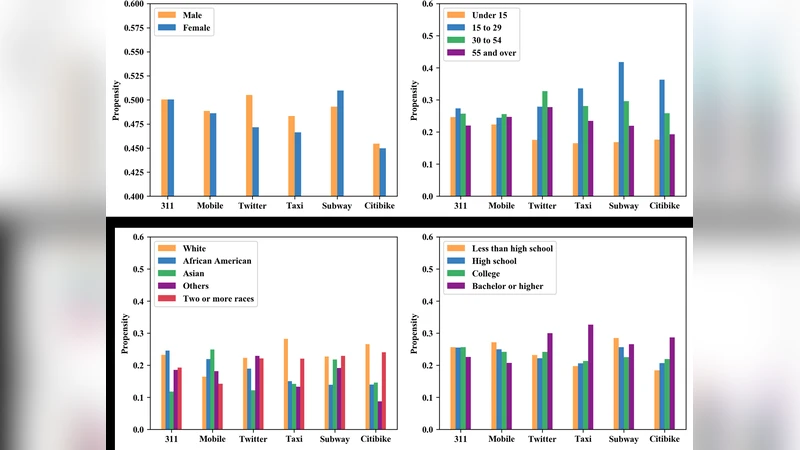
The analysis is extended to demographic groups (age, gender, race, education). For each group G, a synthetic “acting” population is constructed as a β‑weighted blend of that group’s residential and working counts. A regression of A on these group‑specific acting populations yields propensity coefficients θG, regularised with an L2 penalty to avoid multicollinearity. The resulting θ profiles show that younger adults (15‑29 and 30‑59) dominate transit activity, while higher‑educated individuals are more likely to generate Twitter, taxi and Citi Bike trips. These findings provide a nuanced view of how demographic composition shapes the observed digital traces.
Fourth, the authors explore the practical value of a multi‑layered representation through clustering and socio‑economic modelling. Each dataset’s 56‑dimensional weekly profile is L1‑normalised and fed into k‑means clustering (k = 5, selected via the elbow method). The resulting spatial partitions reveal interpretable zones such as tourism hotspots, low‑density residential neighborhoods, and the central business district. When all six profiles are concatenated (336 features) and clustered jointly, the zones become more spatially cohesive and better aligned with underlying socio‑economic variables. Cluster quality is assessed using the Adjusted Rand Index (comparing to quintiles of demographic attributes) and the Silhouette score (measuring intra‑cluster cohesion). The joint clustering attains the highest Silhouette score, while the 311‑only partition scores best on the Adjusted Rand Index, underscoring the complementary strengths of individual layers.
Finally, the temporal signatures are employed as predictors in regression models of various socio‑economic outcomes (e.g., median income, education level, unemployment rate). Models built on a single data source achieve modest explanatory power, but a combined model that incorporates all six signatures substantially improves R² and reduces prediction error. The authors argue that this demonstrates the superiority of a multi‑layered digital census for urban analytics.
In summary, the study provides a systematic framework for integrating heterogeneous digital traces, quantifying their biases, and leveraging their complementary information for tasks such as zoning, clustering, and socio‑economic inference. It highlights both the limitations of relying on any single data source and the opportunities unlocked by a multi‑layered approach, offering valuable guidance for researchers and practitioners seeking to harness big‑data streams in smart‑city planning and policy making.
Comments & Academic Discussion
Loading comments...
Leave a Comment