Audio segmentation based on melodic style with hand-crafted features and with convolutional neural networks
We investigate methods for the automatic labeling of the taan section, a prominent structural component of the Hindustani Khayal vocal concert. The taan contains improvised raga-based melody rendered in the highly distinctive style of rapid pitch and…
Authors: Amruta Vidwans, Nachiket Deo, Preeti Rao
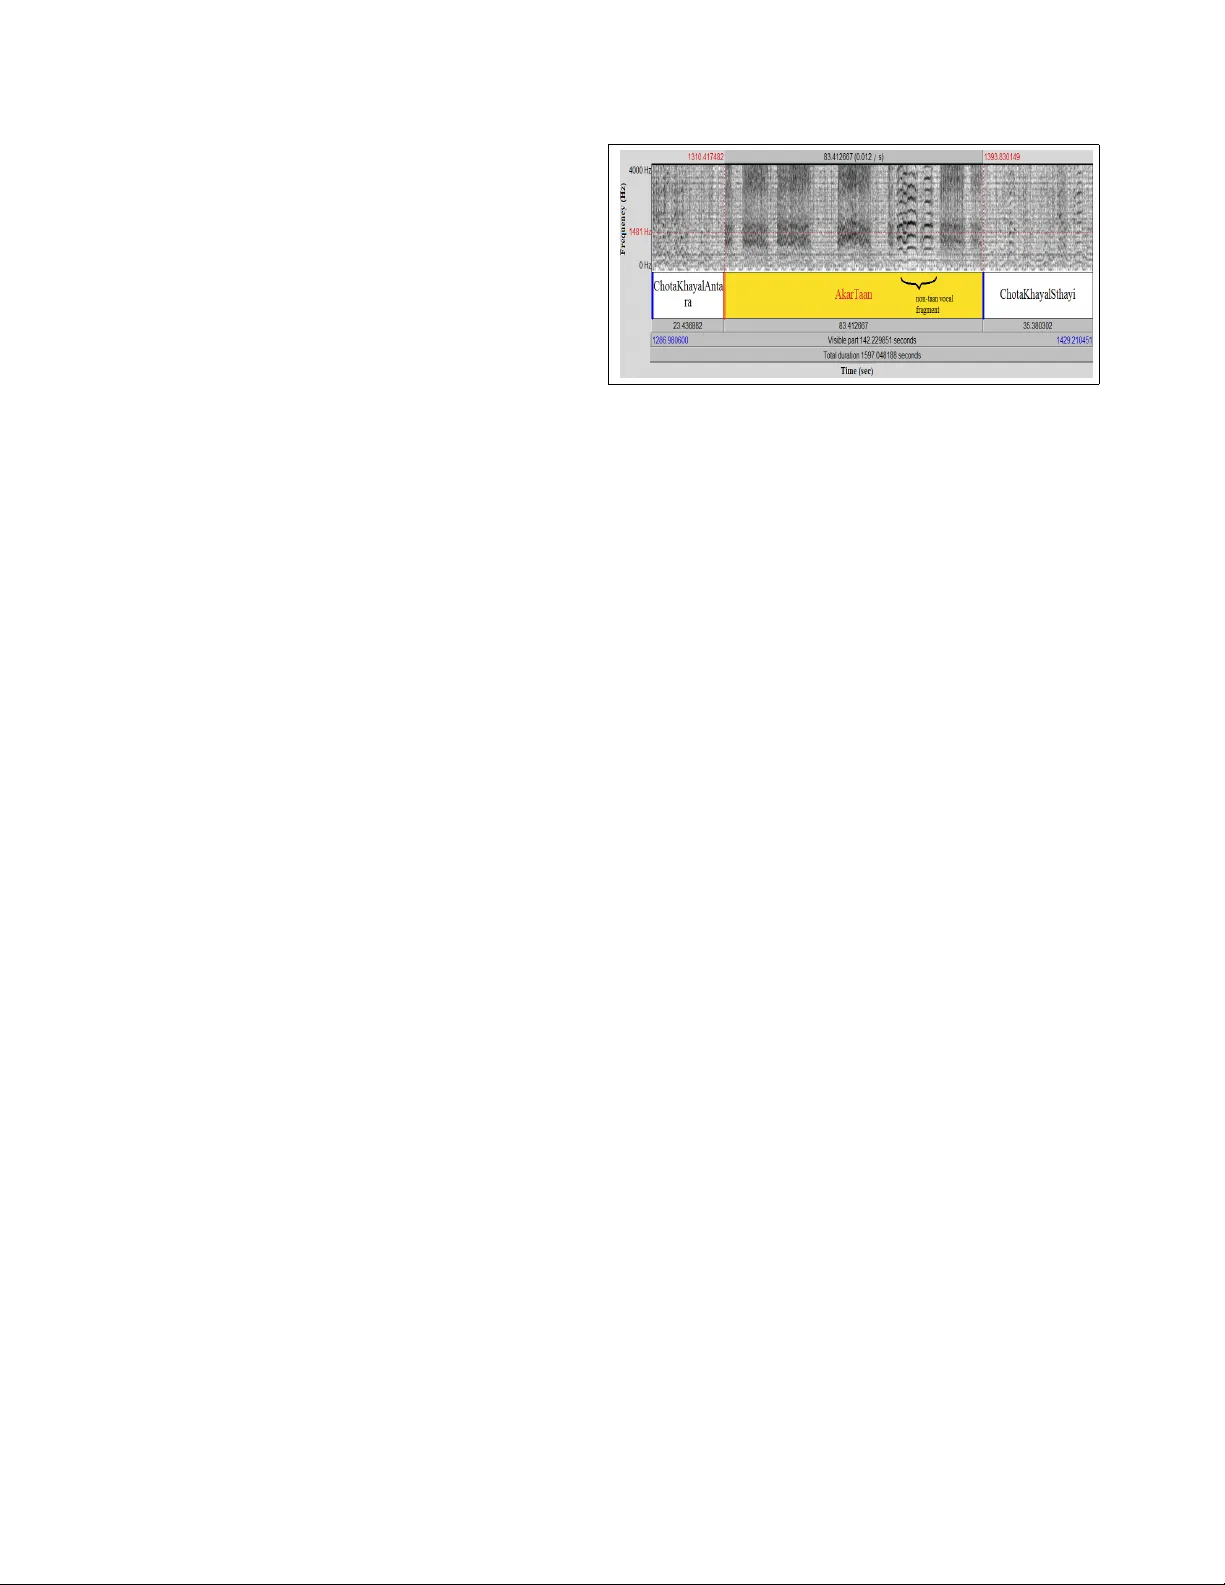
A udio segmentation based on melodic style with hand-crafted featur es and with con volutional neural networks Amruta V idwans, Nachiket Deo, Preeti Rao Department of Electrical Engineering, Indian Institute of T echnology , Bombay { amrutav, ndeo, prao } @ee.iitb.ac.in Abstract W e in vestigate methods for the automatic labeling of the taan section, a prominent structural component of the Hin- dustani Khayal vocal concert. The taan contains impr o- vised raga-based melody r ender ed in the highly distinctive style of r apid pitc h and ener gy modulations of the voice . W e pr opose computational features that capture these spe- cific high-level char acteristics of the singing voice in the polyphonic conte xt. The e xtr acted local featur es ar e used to achie ve classification at the frame level via a trained multilayer per ceptr on (MLP) network, followed by gr oup- ing and se gmentation based on novelty detection. W e r e- port high accuracies with refer ence to musician annotated taan sections acr oss artists and concerts. W e also com- par e the performance obtained by the compact specialized featur es with frame-le vel classification via a con volutional neural network (CNN) operating directly on audio spectr o- gram patches for the same task. While the relatively simple ar c hitectur e we experiment with does not quite attain the classification accuracy of the hand-crafted featur es, it pr o- vides for a performance well above chance with inter esting insights about the ability of the network to learn discrimi- native featur es ef fectively fr om labeled data. 1. Introduction Structural segmentation of concert audio recordings is very useful in music retriev al tasks such as navigation and automatic summarization. It is particularly strongly indi- cated for Indian classical music where concerts can extend for hours, and commercial audio recordings are rarely an- notated, while the performance indeed follow an established structure depending on the genre. Khayal v ocal music is the single most prominent genre in the Indian classical tradition of Hindustani music. A raga performance in khayal has a structure comprised of a number of elements such as the free form introduction ( alap ), the composition ( bandish ), metered improvisation (also, alap ), rhythmic impro visation ( layakari ) and improvisation inv olving fast sequences of notes ( taan ) [7]. The concert ensemble is made up of the vo- calist accompanied by the drone and percussion and some- times melodic accompaniment such as the harmonium or sarangi . As such there are no changes in timbre texture due to the constancy of instrumentation, and harmony is non- existent. The structural elements mentioned earlier occur to various extents in the performance and in different orders depending on the school ( gharana ). Even to the uninitiated (but attenti v e) listener , the dif ferent concert sections appear clearly contrasting in one or the other of the two important dimensions: rhythm and melodic style. Recently , tempo de- riv ed features were used to achiev e structural segmentation at the highest time scale on Hindustani instrumental concert audio [15]. In this work, our focus is on segmenting sections that are melodically salient i.e. the sequence of melodic phrases or notes is rendered in a characteristic melodic style kno wn as the taan . The notes may be articulated in various ways including solfege and the syllables of the lyrics. Most com- mon howev er is the akar taan , rendered using only the vo wel /a/ (i.e. as melisma). The sequence of notes is rel- ativ ely fast-paced and regular , produced as skillfully con- trolled pitch and energy modulations of the singers voice similar to vibrato. But unlike the use of vibrato which orna- ments a single pitch position in W estern music, the cascad- ing notes of the taan sketch elaborate melodic contours like ascents and descents over se veral semitones. The melodic structure is strictly within the r aga grammar while the step- like re gularity in timing brings in a rh ythmic element to the improvisation in contrast to the (also improvised) alap sec- tions. Apart from sho wcasing the singers musical skills, one or more taan sections typically contrib ute to the climax of a raga performance and therefore serv e as prominent mark ers musicologically . A broad ov ervie w of methods av ailable for structural segmentation is summarized in [6]. Since our task in v olves the detection and segmentation of a specific named section of the concert, we need to in v oke both segmentation and su- pervised classification methods. Musically motiv ated fea- 4321 tures and methods are our chosen approach given their po- tential for success with limited training data [12]. The chal- lenges to taan detection are the polyphonic setting where we want to focus on the vocal signal, and designing distincti ve features that are artist and concert independent. Giv en that pitch modulations are the prime characteristic of taan , re- liable pitch detection with sufficient time resolution is nec- essary . Finally , we need to con v ert the low lev el analyses to annotation that closely matches with the musicians la- beling of taan episodes from a performers point of view . T o wards these goals, we use a v ocal source separation algo- rithm based on predominant-F0 detection [9]. Features de- signed to capture the characteristic of rapid but regular pitch and energy variations of the voice are presented. A frame lev el classification at 1 s granularity is followed by a group- ing stage with the goal of emulating the subjectiv e label- ing of taan by musicians as extended regions that occur at salient positions in the concert. Finally , we also wish to ex- plore the interesting question of whether the hand-designed features can be replaced by learned features obtained via a CNN applied directly to the polyphonic audio spectra. There has been much recent research interest in automatic feature learning for a variety of audio tasks such as genre and artist classification [4], chord recognition [3], onset de- tection [11], and structural analysis [14]. In the next section, we describe the characteristics of our audio database. This is followed by a discussion of the pro- posed melodic style features, and the classification and seg- mentation methods. Finally , we present the experiments and ev aluation measures follo wed by a discussion of the results. 2. Database Description Our audio database consists of 57 khayal vocal concert recordings from commercial CDs partitioned into two dis- tinct sets of 22 single-artist (Pt. Jasraj) concerts, and 35 multi-artist concerts (that do not contain Pt. Jasraj). In both cases a number of different ragas are covered at var- ious tempi. All artists are male. The 22 concert set is treated as the test set with two dif ferent training conditions: artist-specific training via leav e-one-song-out cross v alida- tion, and artist-independent training where the test concert artist is not represented at all in the training data of 35 con- certs. In order to achie ve realistic training time for the CNN classification in the 22-fold cross-validation, the 22 test con- cert audios were edited to remove an early sections of each concert audio (where taan typically does not occur). Even- tually we ha ve 3.5 hours of test audio with the proportion of taan in the ov erall vocal re gion at 35%. The labeling of concert sections was carried out by a mu- sician using the PRAA T interface [1]. 1 shows a fragment of labeled audio comprising portions of 3 sections spanning 2.5 minutes of a khayal performance. W e observe that the single continuous section labeled akar taan (of duration 85 Figure 1. Spectrogram of an episode of akartaan flanked by other sections in a concert.The labeled taan section shows rapid oscilla- tory movements of vocal harmonics, interrupted by short non- taan mov ement in-between. s) actually comprises of a cluster of taan segments separated by instrumental or other regular singing segments. A taan segment is easily identified in the audio spectrogram, com- puted with 40 ms Hamming windowing, by the modulated harmonics in the region of prominent formants (dark region abov e 800 Hz). W ithin the labeled taan section, the indi- vidual taan episodes can be as short as 5 s and be separated from each other by up to as much as 20 s. W e observ ed that the musician labeled taan based on the perceived intent of the performer i.e. relativ ely short durations of instrumentals and other vocal styles that occurred sandwiched between taan episodes were subsumed by the taan label (as in 1). For the real-world use case, we would like our automatic system to match the musicians labeling of the taan sections in the concert. 3. F eatur e extraction, classification and group- ing Giv en our knowledge about taan production and obser- vations of the acoustic signal characteristics, it is clear that the presence of strong pitch modulation is among the dis- tinctiv e traits of the taan style of singing. The required au- dio pre-processing and feature extraction methods are pre- sented in the following. 3.1. V ocal attrib utes extraction The singing voice usually dominates over other instru- ments in a vocal concert performance in terms of its lev el and continuity over relativ ely large temporal extents al- though the accompaniment of tabla and other pitched in- struments such as the drone and harmonium are present. The singing voice regions, or vocal spurts, are identified in the audio track using an av ailable singing voice detec- tion system based on timbral and periodicity characteristics of the singing voice as opposed to the instrumentation [8]. The SVM classifier is trained on a few hours of Hindus- tani vocal music (different from the database used in the 4322 present work). Next, a predominant F0 detector is used to estimate the pitch at 10 ms intervals corresponding to the vocal component [9]. The pitch detector uses an adaptiv e analysis window to optimize the time and frequency reso- lution trade-off in order to track rapid pitch variations. The total harmonic energy in the frequenc y re gion below 5 kHz, where the harmonics correspond to the detected pitch, pro- vides an estimate of the vocal energy , also at 10 ms inter- vals. The purely instrumental regions, as determined by the singing voice detector , are not processed for feature extrac- tion. 3.2. Pitch and energy modulation featur es The melodic style descriptors are computed in the de- tected vocal regions only . The pitch values are first con- verted to a cents scale by normalising with a standard F0 chosen to be 55 Hz. The sampled pitch trajectory within each 1 s analysis frame is mean subtracted where mean refers to the slow trend in melodic shape. The mean smooth trajectory is obtained by a third order polynomial fit to the pitch samples in the frame [2]. The mean subtracted trajec- tory is analysed by the 128 point DFT of a sliding window of 1 s duration at 500 ms hop intervals to find the spec- trum peak location and height in the region 1-20 Hz. The peak location is an estimate of the pitch modulation rate. It is observed to lie in the 5-10 Hz range irrespectiv e of the underlying tempo of the section in the case of taan like mov ements. The energy computed from the DFT power spectrum in a neighborhood of +/- 1.6 Hz (5 bins) around the peak represents the regularity and strength of the pitch modulation. It was also observed that the overall energy in the voice fluctuated with the pitch modulation. This could be a consequence of the physiology of production. 2 shows temporal trajectories of extracted pitch and energy across a region partly comprised of taan , where we clearly observe the pitch modulation and rapid energy fluctuations. There is no apparent correlation between instantaneous values of pitch and vocal energy . In order to capture the energy fluctu- ation cue, we use the measured zero-crossing rate from the mean-remov ed energy contour over 1 s window duration at 500 ms hop. Next, a local a veraging of the features is carried out ov er 5 s windo ws to obtain smoothened feature trajectories sam- pled at 1 s frame rate. The feature values are normalized to zero-mean and unit v ariance across the concert. W e thus ob- tain a 3-dimensional normalized feature vector at 1 s frame rate in the vocal segments of the audio which can be used to classify frames into taan and non- taan categories. 3.3. Classification and grouping using posteriors A frame-wise classification into taan and non- taan styles is carried out for all frames in the vocal segments by a trained MLP network. W e use a feed-forward architecture Figure 2. Pitch contour in cents (top) and energy in dB (bottom) of a section of concert audio. Non- taan movements seen in the first half and taan seen after . with the sigmoid acti v ation function for the hidden layer comprising 300 neurons. Training uses cross entropy er- ror minimization via the error back-propagation algorithm. Upon classification, the recall and precision of taan frame detections with respect to the ground-truth can serve to mea- sure the discriminati ve power of the features. In our use case howe ver we seek to label continuous regions of the audio rendered in taan style much as a human annotator would. This requires the grouping of frames based on ho- mogeneity with respect to the taan characteristics. Novelty detection based on a self-distance matrix is an effectiv e way to find segment boundaries [6]. W e use a recently proposed approach to computing the SDM from the posterior prob- abilities deriv ed from the features rather than the features themselves [15]. The use of Euclidean distance between vectors comprised of posteriors probabilities is found to provide for an SDM with enhanced homogeniety due to the reduced sensitivity to irrelev ant local variations. The pos- teriors are the class-conditional probabilities obtained from the MLP classifier for each test input frame. Points of high contrast in the SDM are detected by con- volution along the diagonal with a checker-board kernel whose dimensions depend upon the desired time scale of segmentation. Considering that the minimum taan episode duration, this is chosen to be 5 s in the interest of obtaining reliable boundaries with minimal missed detections. The resulting novelty function is searched for peaks, represent- ing segment boundaries, using ‘local peak local neighbor- hood’ [13]. Whether a region between tw o detected bound- aries corresponds to a taan is determined by examining the majority of the frame-level classification in that region. Fi- nally , the highest lev el of grouping is obtained by examining the region of audio separating ev ery two detected taan seg- ments. A simple heuristic is set up to mimic the musicians annotation where taan episodes separated by non- taan vo- 4323 cal activity of within 20 s are merged into a single section. The mer ging is also applied if the separation corresponds to a purely instrumental region of duration within 50 s. 4. Classification with CNN Con v olutional Neural Networks are a special case of feed forward neural networks where connections between neu- rons are restricted to local regions and connection weights are shared. This greatly reduces the model complexity com- pared to fully connected networks, allo wing them to deal with high dimensional inputs such as images or spectro- gram excerpts. A CNN consists of con v olutional layers, pooling layers and fully connected layers. A con v olutional layer computes a conv olution of the previous layer outputs with fixed size filter kernels of learnable weights, followed by a non-linear activ ation function. A con volutional layer consists of multiple such filter kernels producing an output map for each kernel. Con v olutional layers are optionally followed by pooling layers which spatially do wnsample the outputs of the previous layer . The final con v olutional or pooling layer of the CNN is typically followed by one or more fully connected layers which reshape the output maps into feature vectors which are finally fed to the output layer . 4.1. CNN Inputs W e use excerpts of the spectrograms of our audio files as the input to the CNN. For each of our audio files, sampled at 8 kHz, we compute the log magnitude spectra using a 1024 point DFT on 40 ms Hamming windowed data segments at 20 ms interv als. W e believ e that the taan section can be suf- ficiently characterized by the temporal variations of the first 2 to 3 vocal harmonics that lie within the frequenc y range of 0-1.5 kHz. Thus, in order to keep input feature dimension sizes reasonable, we retain only the first 94 frequency bins of the spectrogram corresponding to the frequency range of 0-1469 Hz. W e then divide the spectrogram into temporal chunks of 1 s corresponding to our frame size (similar to that used in ground-truth labeling as well as in the hand- crafted features computation). Thus the inputs to the CNN are 94x50 dimensional matrices. By matching the spectro- gram resolution and dimensions to our task, we eliminate the need for multiple channel inputs as has been the case in a previous audio task [11]. T o bring the input values within a suitable range, we normalize each frequency band to zero mean and unit variance using the mean and standard devia- tion values estimated using the training. [11]. 4.2. CNN Architectur e The Con v olutional Neural Netw ork used in this work has an architecture similar to that described in [10]; the main difference being that the input spectrogram excerpts in our case use a single time resolution as opposed to having mul- tiple input channels with different time resolutions in [10]. Figure 3. The CNN architecture employed Our network architecture is summarized in 3. The CNN has fiv e layers in total, two con volutional layers, two pooling layers and a fully connected layer . The first layer of the network is a con v olutional layer consisting of 10 7x7 fil- ter kernels producing 10 output maps of size 88x44 each. This is followed by an average pooling layer which retains the av erage value of non-ov erlapping 2x2 cells. This is fol- lowed by another con v olutional layer of 10 3x3 filters and another 2x2 av erage pooling layer to give 10 output maps of size 21x10. These outputs are then reshaped to a 2100 dimensional feature vector and fully connected to a layer of 300 sigmoidal units. The outputs of these 300 units are fi- nally giv en to a softmax output layer consisting of 2 units corresponding to the two classes being considered. 4.3. T raining the CNN The CNN training is carried out in two stages. The CNN is first trained without the fully connected layer, with the outputs of the second pooling layer directly connected to the softmax layer . The outputs of the trained CNN at the second pooling layer are then concatenated into a feature vector for each frame of the training data. These feature vectors are then treated as the training data for a Multi Layer Percep- tron network with a single hidden layer of 300 units and a softmax output layer of two units. Finally , the trained CNN and MLP together form the CNN with the fully connected layer . The CNN and MLP are trained using the Error Back- propagation algorithm for minimizing the cross-entropy er- ror between the softmax outputs and the labels for each 1 sec input frame of the training data. T raining is carried out for a fixed 900 epochs ov er the train set of 35 concerts as de- scribed in section 2. An initial learning rate of 0.1 is halved after ev ery 150 epochs. 5. Experiments and Evaluation Our ideal system would detect and segment taan sections similar to a musicians labeling. This high lev el task is at- tempted by the sequence of frame-lev el automatic classifi- cation and higher lev el grouping as described in section 3. In this section, we present experimental results on the per- 4324 Figure 4. V arious scenarios that occur after grouping viz. (a) false alarm, (b) over -segmentation, (c) exact detection, (d) missed de- tection, (e) under-se gmentation formance of each of the components. Frame-lev el classifi- cation is measured by the detection of taan in terms of re- call and precision. Artist-dependent and artist-independent training are compared for the hand-crafted features based classifier . The same ev aluations are carried out with the CNN classifier where the features are purely learned dur- ing training. The frame-lev el classification needs frame-level (i.e. 1 s resolution) annotation of taan presence or absence. This is required both for the training of the classifiers as well as for reliable testing. The musician labels are not useful as such for this end due to the presence of non- taan inter- ruptions of significant duration within the musician labeled taan sections as seen in 1. Thus, for the de velopment of the frame-lev el classifier, we need a more fine-grained marking of taan segments. Since this is a demanding task to carry out manually , we use a bootstrapped iterative approach where, for each concert audio, a 2-mixture GMM on the melodic style feature vector is fitted to a small amount of hand la- beled data and updated with classified frames across the au- dio track in each iteration until conv er gence is achiev ed [5]. Casual inspection showed that the frame-le vel labels so ob- tained were indeed accurate and these were then used to train and ev aluate the frame level classifiers. The system is also ev aluated after grouping, this time in terms of the match between the detected segments and the subjectiv ely labeled taan segments for each concert. Mea- sures of performance include the number of correctly re- triev ed taan segments and number of false alarms. A sec- tion is said to be correctly retriev ed if there is an overlap of at least 50% of its duration with a detected segment. Also of interest is the extent of over - or under-segmentation of the correctly detected taan sections. 4 illustrates the different possibilities of mismatch that are observed between subjec- tiv e labels and automatically labeled sections. When sub- jectiv ely labeled section is correctly detected, it is observed that the onset and offset boundaries are always within 5 s of the corresponding ground-truth boundaries indicating the reliability of the posteriors based segmentation. Figure 5. (a)R OC for CNN and MLP on hand-crafted features for leav e-one-song-out case of 22 concerts. (b)R OC for CNN and MLP on hand-crafted features for 35 train and 22 test concert sce- nario. 6. Results and Discussion As mentioned in section 2, our experimental e v aluation of the two dif ferent frame-lev el classifier systems is based on (i) a single-artist concert dataset of 22 concerts trained and tested in leave-one-concert-out cross-validation mode, and (ii) testing on the same 22 concerts but with training on a large dataset where the given artist is not represented. ?? (a) and (b) show the R OCs corresponding to each of these train-test scenarios. W e observe that the performance of the hand-crafted features is superior to that obtained by the CNN in each case. W e present some insights related to this in the next section. By noting the equal error rates (precision = recall) for each classifier across the training sets, we see that the per- formance improv es when the training dataset size is in- creased from 22 concerts to 35 concerts (which in reality is a 3-fold increase in the number of labeled frames in the training data due to the longer concert durations). Thus it appears that any gains from intra-artist training are ov er- shadowed by the benefits from the larger training data size. This could also be related to the fact that taan singing style characteristics are relativ ely artist independent. The second stage of frame grouping and segmentation is implemented with the frame-lev el posteriors obtained by the MLP classifier using the hand-crafted features operat- ing at its optimal operating point (f score = 0.86). Using the method presented in section 3, we obtain the results pro- vided in 1. W e note that of the 115 subjectiv ely labeled taan sections across the 22 concerts, there are only 9 missed detections. W e hav e 2 false detections. W e thus have a system that does indeed accurately flag the occurrence of taan sections across concerts. Finally of the 106 correct de- tections, the majority are correctly segmented. Over- and under-se gmentations account for a third of the detections. These can possibly be corrected by modifying the heuris- tics of the highest le vel of grouping (bridging ov er gaps) discussed in section 3. Deriving empirical rules regarding high-lev el segmentation by musicians would ideally require 4325 T rue Detection (106) Under-Se gmentation 32 Over -Segmentation 3 Exact Detection 71 Missed 9 False Alarm 2 T able 1. Segmentation performance after grouping CNN Correct Incorrect Hand-crafted features Correct 4998 762 Incorrect 272 296 T able 2. Distribution of classification errors a study over a larger database with more human annotators per concert. 7. Some Insights While we noted in the previous section that the hand- crafted features perform better than the CNN learned fea- tures, it is interesting to look deeper at the distribution of frame-lev el errors sho wn in 2. W e note that while the CNN features misclassify more frames in total, there are also a sizeable number of frames that are misclassified by the hand-crafted features but correctly classified by the CNN. This indicates the presence of complementary information and that a combination of classifiers is very lik ely to yield a performance superior to any one of the systems. The hand-crafted features were designed to capture the temporal modulation of the pitch and energy trajectories after suitable normalization steps. This information is, of course, implicitly encoded in the spectrogram via the first sev eral strong harmonics of the vocal source. Our choice of spectrogram parameters at the input of the CNN makes the same information, at least in spatial image form, av ail- able to the conv olutional layers. W e select a few exam- ples to obtain an understanding of the encoding of taan and non- taan distinctions by the CNN features. In order to study the learned features, we note that the outputs of the second pooling layer finally get concatenated to form the feature vector for classification. Since the second pooling layer is the last layer where the outputs show spatial cor- respondences with the input spectrogram image, observing the outputs of the second pooling layer could giv e us in- sight into what the CNN encodes in each image. 6 shows the input spectrogram patches for four dif ferent frame cate- gories (based on classification achiev ed by each of the two systems) and the corresponding outputs at the 9 th channel of the second pooling layer . The 9 th channel w as one of the channels having lar ger connection weights to the fully con- Figure 6. Input spectrograms and 9 th channel output maps for the 2 nd pooling layer . (a) Correctly classified as taan by both CNN and hand-crafted features (b) Incorrectly classified as non- taan by CNN and correctly classified as taan by hand-crafted features (c) Correctly classified as non- taan by both CNN and hand-crafted features (d) Incorrectly classified as taan by CNN but correctly classified as non- taan by hand-crafted features nected layer compared to other channels, implying that its outputs were more significant than those of the other chan- nels for the classification. From 6 we observe that the outputs of the second pool- ing layer are rather sparse with respect to the input spec- trograms, indicating that the high lev el features learned by the CNN may be discarding the less rele vant parts of the in- put spectrogram. Here the retained structure seems to cor- respond to higher energy portions of the spectrogram such as the vocal harmonics and occasionally other instrumen- tal harmonics and percussion strokes. 6(b) and (c) show frames that were classified as non- taan by the CNN. The frame in 6(c) actually corresponds to a non- taan frame char- acterised by its non oscillating almost constant vocal har- monics, which did get captured as horizontal lines. The frame in 6(b), howe v er was actually a taan frame as seen by the oscillating vocal harmonics. Howe v er , the oscillations in the first harmonic at about 600 Hz were not prominent enough and got captured as a virtually horizontal structure leading to the misclassification. 6 (a) and (d) show frames that were classified as taan by the CNN. 6(a) was indeed a taan frame. The rapid oscillations in its vocal harmonics appear as a scattered pattern in the output map. 6(d) rep- resents a common CNN misclassification. This non- taan frame has time-v arying harmonics but the time-variation is not a regular pitch modulation characteristic of taan . The output map shows a breakdown of the harmonic structure indicating that the precise nature of the time v ariation is not learned by the CNN features. Rather , the CNN appears to characterize non- taan frames, which are marked by the 4326 presence of stable or at most slo w varying vocal harmonics, with near horizontal lines in the output maps, and all inputs that do not match these stable characteristics as taan . Finally , we also examined cases where the CNN fea- tures correctly classified taan frames that were missed by the hand-crafted features. These frames had spectrogram images that clearly showed the oscillating harmonics. Ho w- ev er it turned out that pitch tracking errors in these frame led to the loss of this information capture in the hand-crafted features. This raises the important point that the learning from ra w audio spectra via the CNN could decrease vulner - ability to errors in fixed high-level feature extraction mod- ules such as predominant pitch detection. 8. Conclusion W e proposed a system for the segmentation and labeling of a prominent named structural component of the Hindus- tani vocal concert. The taan section is characterized by a melodic style marked by rapid pitch and energy modulation of the singing voice. High-lev el features to capture this spe- cific modulation from the pitch tracks extracted from the polyphonic audio, combined with novelty based grouping of frame posteriors, provided high accuracy taan segmen- tation on our test dataset of concerts. W e also inv estigated the possibility of automatically learning distincti ve features, using a CNN for this task, from raw magnitude spectra computed from the polyphonic audio signal. Notwithstand- ing that we approached this particular comparison with a healthy dose of skepticism, it was observed that the CNN did indeed perform the frame-level classification far better than chance. An inspection of the outputs of the second pooling layer reflected a systematic difference in taan and non- taan frames. Although non- taan frames where the har - monics varied over time were misclassified as taan frames, it is entirely possible that training on a larger dataset with more such instances as well as using a network with more layers could help improve performance. Finally , the com- plementary errors of the two classifier systems can lead to fruitful combinations for further improv ements in perfor- mance. The more general conclusion is that learned fea- tures can indeed add v alue to hand-crafted features in audio retriev al tasks. 9. Acknowledgement This work recei ved partial funding from the European Research Council under the European Unions Seventh Framew ork Programme (FP7/2007-2013)/ERC grant agree- ment 267583 (CompMusic). References [1] P . Boersma and D. W eenink. Praat, a system for doing pho- netics by computer . Glot International , 5(9/10):341–345, 2001. [2] C. Gupta and P . Rao. Objective Assessment of Ornamen- tation in Indian Classical Singing , volume 7172 of Lectur e Notes in Computer Science . Springer Berlin Heidelberg, 2012. [3] E. Humphrey and J. Bello. Rethinking automatic chord recognition with conv olutional neural networks. In Pr oceed- ings of 11th International Confer ence on Machine Learning and Applications , volume 2, pages 357–362, Dec 2012. [4] H. Lee, P . Pham, Y . Largman, and A. Ng. Unsupervised feature learning for audio classification using conv olutional deep belief networks. In Proceedings of Advances in neural information pr ocessing systems , pages 1096–1104, 2009. [5] T . Nguyen, H. Sun, SK. Zhao, SZK. Khine, HD. T ran, TLN. Ma, B. Ma, ES. Chng, and H. Li. The iir-ntu speak er diariza- tion systems for rt 2009. In RT09, NIST Rich T ranscription W orkshop , volume 14, pages 17–40, 2009. [6] J. Paulus, M. Muller , and A. Klapuri. State of the art re- port: Audio based music structure analysis. In Proceedings of the International Symposium on Music Information Re- trieval , pages 625–636, 2010. [7] S. Rao and P . Rao. An overvie w of hindustani music in the context of computational musicology . Journal of New Music Resear ch , 43(1):24–33, 2014. [8] V . Rao, C. Gupta, and P . Rao. Context-aw are features for singing v oice detection in polyphonic music. In Pr oceedings of of Adaptive Multimedia Retrieval , pages 43–57, 2013. [9] V . Rao and P . Rao. V ocal melody extraction in the pres- ence of pitched accompaniment in polyphonic music. Audio, Speech, and Language Processing , IEEE T ransactions on , 18(8):2145–2154, Nov 2010. [10] J. Schl ¨ uter and S. B ¨ ock. Musical onset detection with con- volutional neural networks. In 6th International W orkshop on Machine Learning and Music, Prague, Czech Republic , 2013. [11] J. Schl ¨ uter and S. B ¨ ock. Improved musical onset detection with con v olutional neural networks. In Pr oceedings of IEEE International Confer ence on Acoustics, Speech and Signal Pr ocessing , pages 6979–6983, 2014. [12] X. Serra. Exploiting domain knowledge in music informa- tion research. In Pr oceedings of Stockholm Music Acoustics Confer ence and Sound and Music Computing Confer ence , pages 3–6, 2013. [13] D. Turnb ull, G. Lanckriet, E. Pampalk, and M. Goto. A su- pervised approach for detecting boundaries in music using difference features and boosting. In Pr oceedings of the Inter- national Symposium on Music Information Retrieval , 2007. [14] K. Ullrich, J. Schlter , and T . Grill. Boundary detection in mu- sic structure analysis using conv olutional neural networks. In Pr oceedings of the International Symposium on Music Infor - mation Retrieval , 2014. [15] P . V erma, T . P . V inutha, P . Pandit, and P . Rao. Structural segmentation of hindustani concert audio with posterior fea- tures. In Pr oceedings of IEEE International Conference on Acoustics, Speech and Signal Pr ocessing , 2015. 4327
Original Paper
Loading high-quality paper...
Comments & Academic Discussion
Loading comments...
Leave a Comment