A Capsule based Approach for Polyphonic Sound Event Detection
Polyphonic sound event detection (polyphonic SED) is an interesting but challenging task due to the concurrence of multiple sound events. Recently, SED methods based on convolutional neural networks (CNN) and recurrent neural networks (RNN) have show…
Authors: Yaming Liu, Jian Tang, Yan Song
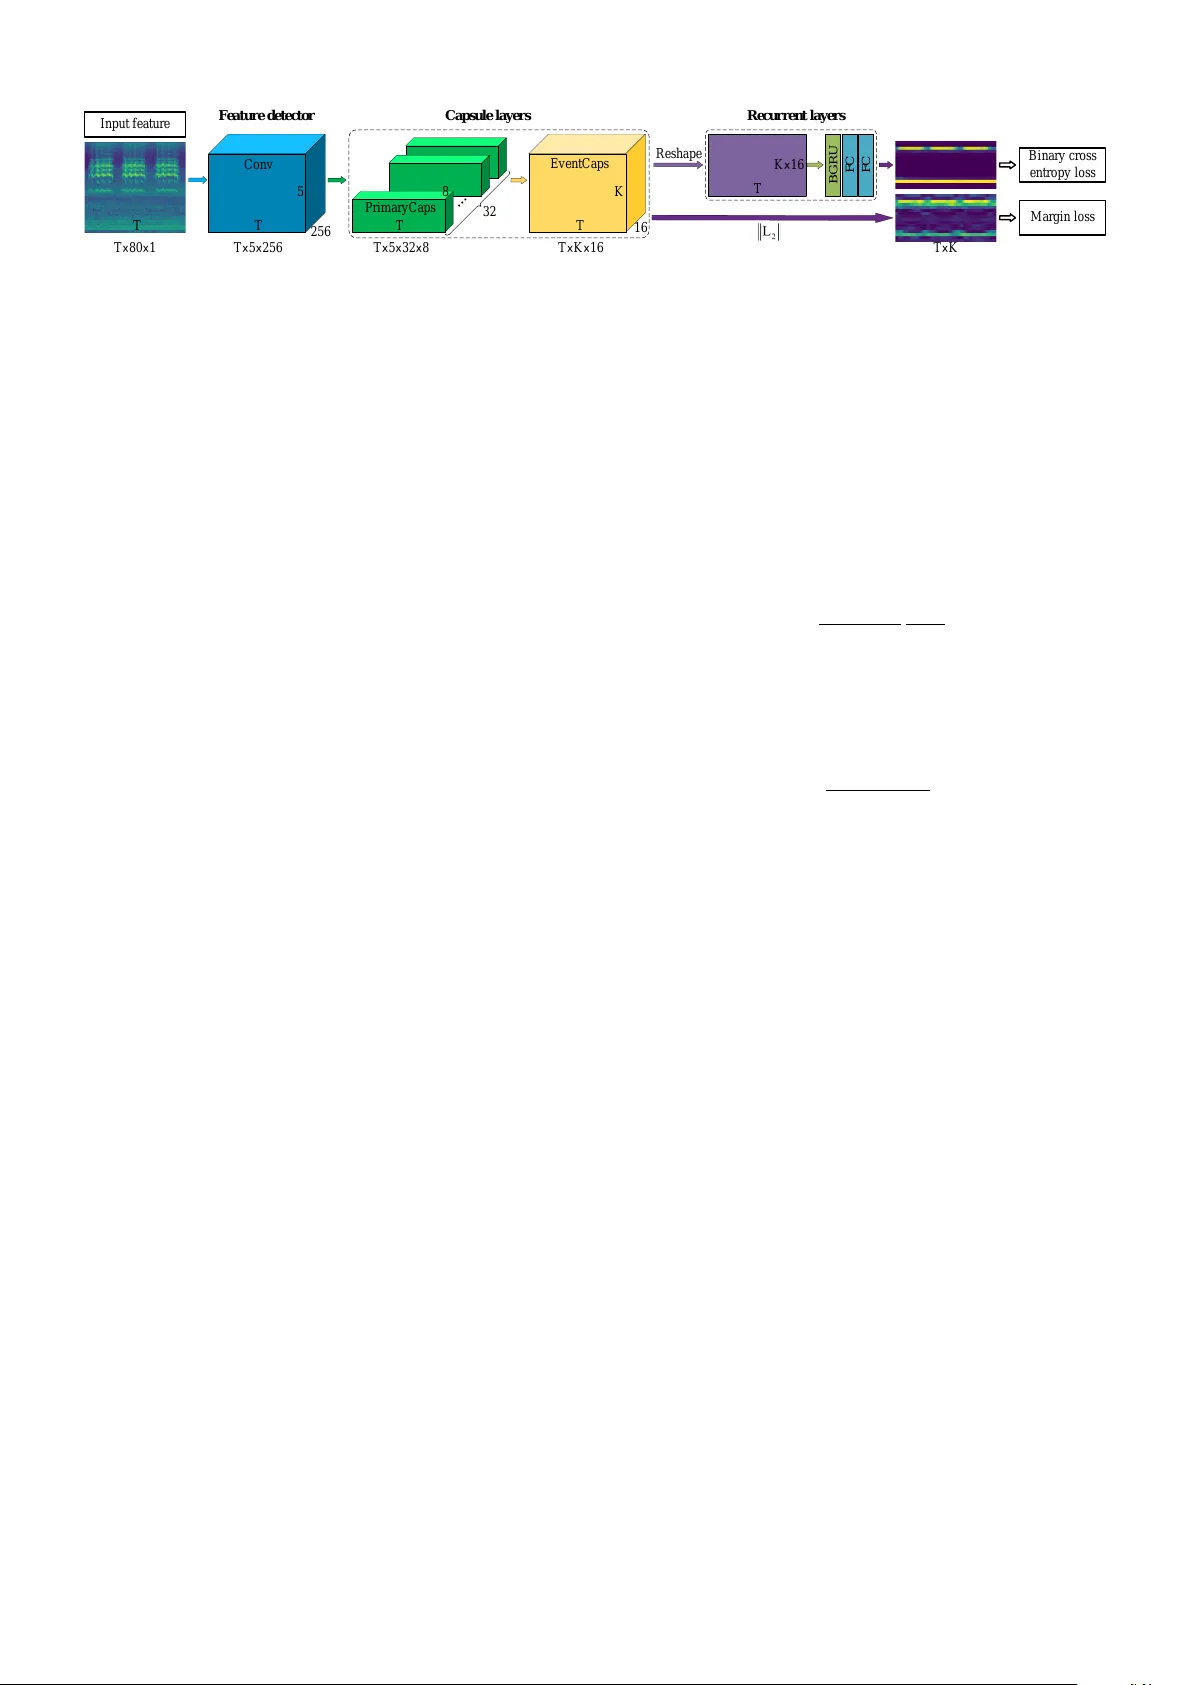
A Capsule based Approach for Polyphonic Sound Ev ent Detection Y aming Liu, Jian T ang, Y an Song, Lirong Dai National Engineering Laboratory for Speech and Language Information Processing, Univ ersity of Science and T echnology of China, Hefei, China { lym66, enjtang } @mail.ustc.edu.cn, { songy , lrdai } @ustc.edu.cn Abstract —Polyphonic sound event detection (polyphonic SED) is an interesting but challenging task due to the concurrence of multiple sound ev ents. Recently , SED methods based on conv o- lutional neural networks (CNN) and recurr ent neural networks (RNN) hav e shown promising performance. Generally , CNN are designed for local featur e extraction while RNN are used to model the temporal dependency among these local features. Despite their success, it is still insufficient f or existing deep learning techniques to separate individual sound event from their mixture, largely due to the overlapping characteristic of features. Motivated by the success of Capsule Networks (CapsNet), we propose a more suitable capsule based approach for polyphonic SED. Specifically , several capsule layers are designed to effectively select repr esentative frequency bands f or each individual sound event. The temporal dependency of capsule’ s outputs is then modeled by a RNN. And a dynamic threshold method is proposed for making the final decision based on RNN outputs. Experiments on the TUT -SED Synthetic 2016 dataset show that the pr oposed approach obtains an F1-score of 68.8% and an error rate of 0.45, outperforming the previous state-of-the-art method of 66.4% and 0.48, respectively . I . I N T RO D U C T I O N Sound e vent detection (SED), also kno wn as acoustic event detection, aims at detecting the onset and of fset times of sound ev ents automatically and gi ving a label to each e vent. W ith the help of SED technology , computers can understand the en vironment around via sound and response to it. Recently , SED has receiv ed increasing interests due to its promising future with wide range of applications in our daily life, including acoustic surveillance [1], bio-acoustical monitoring [2] and smart facilities in intelligent buildings [3]. According to whether SED allows multiple sound e vents to occur simultaneously , it can be categorized into monophonic and polyphonic ones, For monophonic SED, there exists a certain pattern for each indi vidual sound event in spectrogram. For example, the rain ev ent always fills the entire frequency bands, while the thunder event appears at low frequenc y bands. Howe ver , for polyphonic SED task, these patterns are very likely to overlap, which make it dif ficult to effecti vely separate individual pattern and make a correct detection for each event. T raditional approaches for polyphonic SED include hidden Markov model (HMM) [4] and non-negati ve matrix factoriza- tion (NMF) [5]. In [5], NMF is used to separate the audio signal into 4 single tracks, where each track represents a combination of the original sources. This can be seen as a coarse separation of sound e vents. Recently , feedforward neu- ral networks (FNN) and con volutional neural networks (CNN) hav e been successfully applied to audio ev ent classification [6], [7] as well as polyphonic SED [8], [9]. Recurrent neural networks (RNN) [10] have achieved quite good performance by integrating information from the earlier time context. In [11], the CRNN which combines the strength of both CNN and RNN has obtained state-of-the-art polyphonic SED per - formance. In this paper , we propose a capsule based approach for polyphonic SED, as shown in Fig. 1. This is motiv ated by Capsule Networks (CapsNet) [12], which hav e sho wn promising results on highly overlapped digital numbers clas- sification. CapsNet are designed to predict the entire entity through partial information and to select suited predictions for the final classification. This characteristic may be useful for polyphonic SED task to separate each individual sound ev ent from overlapped features of the mixture. In this work, firstly , a stack of conv olutional layers are designed to extract local features from the input log mel band energies. Then the outputs of CNN are fed into two capsule layers, where local features from dif ferent frequency bands and channels are selected to predict multiple objects. A RNN is further applied to model the temporal dependency of capsule layers’ s outputs. T o learn effecti ve capsule representation, capsule layers and recurrent layers are jointly trained with two dif ferent loss func- tions concurrently . Compared with the existing deep learning based polyphonic SED methods, the proposed capsule based approach can ef fecti vely select representative frequency bands for each individual sound ev ent, which is more suitable for separating sound e vents from their mixture. The performance is further improv ed by using a dynamic threshold according to validation metrics. Experiments on the TUT -SED Synthetic 2016 dataset show that the proposed approach obtains an improv ement over the previous state-of-the-art method. The main contributions of this study can be summarized as following: • A capsule based framework is proposed for polyphonic SED to alleviate the ov erlap problem. • A dynamic threshold strategy is used to make the final classification decision. This is a simple but ef fecti ve decision method for polyphonic SED task. • W e experimentally demonstrate the validity of the pro- posed approach and analyze how ev ents separate from their mixture through visualization. C onv Fe at u r e d e t e c t or Re c u r r e n t l aye r s FC FC B G R U Ma r gi n l oss B i na r y c r oss e nt r opy l oss I nput f e a tu r e 32 16 R e shape Eve nt C a ps K 5 256 T Cap su l e l aye r s T T T T 5 8 P r i m a r yC a ps T T x 80 x 1 T x 5 x 256 T x 5 x 32 x 8 T x K x 16 K x 16 T x K Fig. 1. Overall architecture of the proposed approach, which consists of three parts. 1) Feature detector: a group of conv olutional layers with pooling only on frequency axis. 2) Capsule layers: the outputs of con volutional layers are fed into two capsule layers. 3) Recurrent layers: a bidirectional GRU and two FC layers are used to learn temporal context information and estimate ev ent activity probabilities. I I . M E T H O D A. Overview The proposed framew ork illustrated in Fig. 1 includes three parts as follows. 1) Feature detector, which is composed of sev eral con volutional layers with pooling only on frequency axis (time axis does not shrink), time-frequency representa- tions of audio signal are fed into the detector . 2) Capsule layers, including a PrimaryCaps and an Ev entCaps, which are designed to select features from different frequency bands and channels. 3) Recurrent layers, which are used to learn temporal context information and estimate ev ent activity probabilities. Hyperparameters used are presented in T able I. B. F eatur e detector W e use 4 con volutional layers to detect local features in this work. Max-pooling is used to reduce frequency dimensionality , while time axis keeps the same to match the length of target. Log mel band energies X ∈ R F × T is fed into the feature detector with zero-padding, where F is frequency bins of input features, T is the number of frames in a sample. The output of feature detector is a tensor H ∈ R M × F 0 × T , where M is the number of feature maps in the last con volutional layer , F 0 is the number of frequency bands after series of pooling operations. C. Capsule layers Capsules are vectors whose dimensions are associated with various properties of objects, such as location, size, orienta- tion, etc. The length of each vector represents the activity probability of a specific object, and is limited to range from 0 to 1 by a nonlinear squashing function in (3). T wo capsule layers are used in this work, a PrimaryCaps and an EventCaps. PrimaryCaps is a conv olutional capsule layer with 32 channels. Each channel consists of 8D capsules. These capsules are also called low-le vel capsules which are fed into EventCaps later to obtain high-lev el ones. In EventCaps, firstly , prediction vectors of high-le vel capsules are calculated by multiplying outputs of low-le vel capsules by a weight matrix, as in (1). Then these prediction vectors are selected by routing-by-agreement pro- cess according to similarity between each high-level capsule’ s output and its prediction vectors, as in (2)(4)(5). The more similar a prediction vector and its corresponding high-lev el capsule’ s output are, the larger the connection weight between them is. This weight gain further increases the contribution of that prediction vector to its corresponding high-lev el capsule. Let u i denote the output of lo w-lev el capsule i , and v j is the output of high-le vel capsule j , then v j can be calculated as following ˆ u j | i = W ij u i (1) s j = X i c ij ˆ u j | i (2) v j = k s j k 2 1 + k s j k 2 s j k s j k (3) where ˆ u j | i is the prediction v ector of high-le vel capsule j from low-le vel capsule i , W ij is the corresponding weight matrix. The coupling coef ficients c ij are determined by dynamic routing process as follows c ij = exp( b ij ) P k exp( b ik ) (4) b ij ← b ij + ˆ u j | i · v j (5) where b ij are log prior probabilities that low-le vel capsule i should be coupled with high-lev el capsule j . The b ij are ini- tialized to 0 and updated by the similarity between prediction vector ˆ u j | i and high-le vel capsule’ s output v j . This similarity can be measured by a scalar product operation. Finally , margin loss of each output capsule k is calculated L k = T k max(0 , m + − k v k k ) 2 + λ (1 − T k )max(0 , k v k k − m − ) 2 (6) where T k is 1 when class k actually exists, otherwise 0. T erms m + , m − and λ are hyperparameters, which are set to the same values as origin CapsNet [12]. The total loss is the sum of the losses of all output capsules. In this work EventCaps calculates results on each frame simultaneously . The main process of capsule layers part is described as follows. • PrimaryCaps, each channel contains F 0 × T 8D capsules, i.e., F 0 × 32 primary capsules for each frame. • Capsules of each frame are fed into EventCaps to com- pute K 16D capsules, where K is the number of ev ent classes. Each 16D capsule represents one sound ev ent. The output of EventCaps is a tensor J ∈ R 16 × K × T . • Calculating length of each capsule inside ev ery frame. The output is a tensor K ∈ R K × T . T ABLE I H Y PE R PAR A M E TE R S U S E D I N T H E P RO P O SE D A P P ROA C H Feature detector Capsule layers Recurrent layers Con v1 Con v2 Con v3 Con v4 PrimaryCaps EventCaps GR U FC FC kernel 256@ 3 × 3 256@ 3 × 3 256@ 3 × 3 256@ 3 × 3 - - - - - stride 1 × 1 1 × 1 1 × 1 1 × 1 1 × 1 - - - - pooling size - 1 × 4 1 × 2 1 × 2 - - - - - activ ation function ReLU ReLU ReLU ReLU squashing squashing - ReLU Sigmoid num of hidden units - - - - - - 256 512 16 dim of capsule - - - - 8 16 - - - D. Recurr ent layers A RNN is used to learn temporal context information, since the temporal dependency has pro ved to be important in sound ev ent analysis task [10], [11], [13]. W e reshape the output tensor of DigitCaps J ∈ R 16 × K × T to M ∈ R (16 × K ) × T , i.e. combining K 16D capsules in each frame. These combined vectors are fed into a bidirectional gated recurrent unit (GR U). The bidirectional GR U outputs hidden state h t at each frame t , followed by a feedforw ard layer with ReLU activ ation function. Finally , another feedforward layer with sigmoid activ ation function is used as the output layer . The output of recurrent layers is a tensor F ∈ R K × T , representing events activity probabilities of K sound ev ents along T frames. E. Dynamic Threshold Event activity probabilities are binarized by a threshold to obtain binary representation. The threshold can be very crucial to the performance of polyphonic SED system since we don’t know how many events exist in one frame. In our work, we select an optimal threshold C opt between [0.5, 0.9] for each model based on the validation metrics, the optimal threshold is used on the test set afterwards. I I I . E X P E R I M E N T S A. Datasets and Metrics W e ev aluate the proposed approach on the dataset TUT - SED Synthetic 2016 [11]. Segment-based error rate (ER) and F1-score (F1) proposed in [14] are used as ev aluation metrics in this work. Intermediate statistics are accumulated ov er the segments of the whole test set and then used to calculate ER and F1, which is called micro-av eraging. T o ensure comparability with the baseline system [11], we use two kinds of segments length, single frame (40ms) and one- second. Thus four ev aluation metrics are used in this work, i.e., E R f rame , F 1 f rame , E R second and F 1 second , where E R f rame and F 1 f rame as primary ev aluation metrics. B. Baseline W e compare our work with the previous state-of-the-art approach CRNN [11]. W ork in [11] uses a CNN as feature extractor , log mel band energies is fed into the CNN. T ime axis keeps the same during con volution, and feature maps are stacked along the frequency axis afterwards. These stacked feature maps are fed into a GR U later . Feedforward layer with sigmoid acti v ation function is used as the output layer to obtain sound ev ent acti vity probabilities of each frame. C. Experiment Setting W e use the same log mel band ener gies as [11], except that the 80 mel bands are used instead. Each mel band is nor- malized by subtracting its mean and dividing by its standard deviation calculated ov er the training set. The normalized log mel band energies are split into samples by a sliding window with fixed length T (frames, 128 in this work). Samples are overlapped during training and are nonoverlapping during validation and test, which is also the same as [11]. All the networks are trained with Adam [15] optimizer with a fixed learning rate of 0.0001. Dynamic threshold strategy is used in all our networks unless specifically mentioned. Batch normalization and dropout with dropout rate 0.25 are used after each con volutional layer . W e use early stopping during the training process, holt the training if validation metrics are not improving for more than 10 epochs. The model with the best performance on validation set is chosen as the final model which is used to calculate results on test set. Each experiment is repeated 10 times with different random seeds. The six comparison systems are as follows: CNN is the first baseline from work [11], it consists three con volutional layers and no recurrent layer . CRNN is the second baseline from work [11], including three con volutional layers and one GR U recurrent layer . CapsNet is the CapsNet baseline which only includes fea- ture detector and capsule layers. The model regards lengths of capsules of DigitCaps K as outputs. Margin loss is calculated between K and ground truth Y ∈ R K × T . Capsule-RNN is our proposed approach as described in Section II. During the training process, two losses are cal- culated, i.e., binary cross-entropy loss between outputs of recurrent layers F and ground truth Y , margin loss between capsules’ s lengths K and ground truth Y . The final loss is a weighted sum of these two losses by a couple of weights [0.7, 0.3]. During the validation and test process, outputs of recur- rent layers F are considered as ev ent acti vity probabilities, and are binarized by dynamic threshold (DT). Capsule-RNN without DT use a fixed threshold C = 0 . 5 (same as [11]) in Capsule-RNN to binarize event activity probabilities. D. Results In this section, we pro vide the mean and the standard deviation of F1 and ER in all experiments described abov e. As presented in T able II, CapsNet improv es frame-based F1 T ABLE II E R A N D F 1 O F O N E F R A M E S E GM E N T BA S E D A N D O N E S E CO N D S E G M EN T BA S E D F O R BA S E L IN E S A N D P RO P O SE D M O DE L S Model F 1 f r ame E R f r ame F 1 second E R second CNN [11] 59.8 ± 0.9 0.56 ± 0.01 59.9 ± 1.2 0.78 ± 0.08 CapsNet 64.6 ± 0.9 0.50 ± 0.01 65.0 ± 0.6 0.62 ± 0.01 CRNN [11] 66.4 ± 0.6 0.48 ± 0.01 68.7 ± 0.7 0.47 ± 0.01 Capsule-RNN 68.8 ± 0.7 0.45 ± 0.01 69.2 ± 0.5 0.45 ± 0.01 Capsule-RNN a 68.6 ± 0.8 0.47 ± 0.02 68.1 ± 0.8 0.51 ± 0.03 a Capsule-RNN without DT c row d a ppl a us e dog ba rki ng gl a s s s m a s h hors e w a l k Gr ound t r ut h P r e di c t i on 80 60 40 20 0 L og m e l ba nd e ne rgi e s I nput fe a tur e s 0 . 0 0 . 4 0 . 8 1 . 2 1 . 6 2 . 0 2 . 4 dog ba r ki ng 0 5 10 15 20 25 30 4 3 2 1 0 F re que nc y ba nd ( A ) ( B ) 0 . 8 0 . 6 0 . 4 0 . 2 0 . 20 0 . 15 0 . 10 0 . 05 T i m e ( s e c s ) Cha nne l c row d a ppl a us e dog ba rki ng gl a s s s m a s h hors e w a l k 4 3 2 1 0 F re que nc y ba nd Cha nne l gl a ss sm a sh 0 5 10 15 20 25 30 Fig. 2. (A) Input features, ground truth and prediction of an example from test set. (B) Coupling coefficients c ij at the 80th frame. Each point in the image refers to the coupling coefficient between a high-lev el capsule ( dog barking or glass smash ) and its prediction vector from a low-le vel capsule. The vertical axis can be considered as frequency bands between 0-22050 Hz (0 for lowest frequency band, 4 for highest frequency band), while the horizontal axis represents the channels. and ER by relativ e 8% and 11% respectiv ely compared with CNN baseline. Meanwhile, Capsule-RNN achieves a relati ve improv ement of 4% on frame-based F1 and 6% on frame- based ER over CRNN baseline. Considering the number of parameters used for Capsule-RNN and CRNN are similar (CapsNet is less than CNN), these improv ements indicate an architectural advantage of capsule based methods compared with CNN based methods. On the other hand, compared with CapsNet, Capsule-RNN obtains a further 7% and 10% relativ e improv ement on frame-based F1 and ER respecti vely , implying that the temporal context information is important to polyphonic SED task. This is consistent with previous work. Comparison of Capsule-RNN and Capsule-RNN without DT shows that a proper decision threshold is essential for ER. Fig. 2 shows an example from the test set for predicting ev ents activities along 128 frames (2.56s), which also illus- trates ho w the proposed approach is able to distinguish ev ents from their mixture. W e draw the coupling coefficients c ij at the 80th frame (circled in red box) in Fig. 2-B. This distribution of coupling coefficients can be seen as a selection of frequency bands and channels when producing a high-le vel capsule from its prediction vectors. T wo sound e vents are contained at the 80th frame, where dog barking presents at middle and lo w frequency bands, and glass smash covers all bands. Fig. 2 demonstrates that the proposed approach successfully detects these two e vents from their mixture by selecting channels on different frequency bands for dog barking (the lo west frequency band) and for glass smash (the second-highest frequency band), respectiv ely . I V . C O N C L U S I O N S In this paper , we proposed a capsule based approach for polyphonic sound event detection to alle viate the overlap problem. In our approach, se veral capsule layers were designed to ef fectiv ely select representati ve frequency bands for each in- dividual sound e vent. Also, the dynamic threshold strategy was proposed for selecting an optimal threshold for each model. Experiments showed that the proposed approach outperformed the previous state-of-the-art CRNN method. A C K N O W L E D G M E N T This work was supported by National Key R&D Program of China (Grant No. 2017YFB1002202) and the Key Sci- ence and T echnology Project of Anhui Province (Grant No. 17030901005). R E F E R E N C E S [1] G. V alenzise, L. Gerosa, M. T agliasacchi, F . Antonacci, and A. Sarti, “Scream and gunshot detection and localization for audio-surveillance systems, ” in Advanced V ideo and Signal Based Surveillance, 2007. A VSS 2007. IEEE Confer ence on . IEEE, 2007, pp. 21–26. [2] D. Stowell and D. Clayton, “ Acoustic ev ent detection for multiple overlapping similar sources, ” in Applications of Signal Pr ocessing to Audio and Acoustics (W ASP AA), 2015 IEEE W orkshop on . IEEE, 2015, pp. 1–5. [3] M. A. Sehili, B. Lecouteux, M. V acher, F . Portet, D. Istrate et al. , “Sound en vironment analysis in smart home, ” in International Joint Confer ence on Ambient Intelligence . Springer , 2012, pp. 208–223. [4] T . Heittola, A. Mesaros, A. Eronen, and T . V irtanen, “Context-dependent sound event detection, ” EURASIP Journal on Audio, Speech, and Music Pr ocessing , vol. 2013, no. 1, p. 1, 2013. [5] T . Heittola, A. Mesaros, T . V irtanen, and A. Eronen, “Sound ev ent detection in multisource en vironments using source separation, ” in Machine Listening in Multisource Envir onments , 2011. [6] I. McLoughlin, H. Zhang, Z. Xie et al. , “Robust sound event classifi- cation using deep neural networks, ” IEEE/ACM Tr ansactions on Audio, Speech, and Language Pr ocessing , vol. 23, no. 3, pp. 540–552, 2015. [7] H. Zhang, I. McLoughlin, and Y . Song, “Robust sound event recognition using con volutional neural networks, ” in Acoustics, Speech and Signal Pr ocessing (ICASSP), 2015 IEEE International Conference on . IEEE, 2015, pp. 559–563. [8] E. Cakir, T . Heittola, H. Huttunen, and T . V irtanen, “Polyphonic sound ev ent detection using multi label deep neural networks, ” in Neural Networks (IJCNN), 2015 International Joint Conference on . IEEE, 2015, pp. 1–7. [9] E. Cakir , E. C. Ozan, and T . Virtanen, “Filterbank learning for deep neural network based polyphonic sound event detection, ” in Neural Networks (IJCNN), 2016 International Joint Conference on . IEEE, 2016, pp. 3399–3406. [10] G. Parascandolo, H. Huttunen, and T . V irtanen, “Recurrent neural networks for polyphonic sound event detection in real life recordings, ” in Acoustics, Speech and Signal Pr ocessing (ICASSP), 2016 IEEE International Confer ence on . IEEE, 2016, pp. 6440–6444. [11] G. Parascandolo, T . Heittola, H. Huttunen, T . V irtanen et al. , “Conv olu- tional recurrent neural networks for polyphonic sound ev ent detection, ” IEEE/ACM T ransactions on Audio, Speech, and Language Pr ocessing , vol. 25, no. 6, pp. 1291–1303, 2017. [12] S. Sabour, N. Frosst, and G. E. Hinton, “Dynamic routing between capsules, ” in Advances in Neural Information Pr ocessing Systems , 2017, pp. 3859–3869. [13] Y . Xu, Q. K ong, Q. Huang, W . W ang, and M. D. Plumbley , “Conv olu- tional gated recurrent neural network incorporating spatial features for audio tagging, ” in Neural Networks (IJCNN), 2017 International Joint Confer ence on . IEEE, 2017, pp. 3461–3466. [14] A. Mesaros, T . Heittola, and T . V irtanen, “Metrics for polyphonic sound ev ent detection, ” Applied Sciences , vol. 6, no. 6, p. 162, 2016. [15] D. Kinga and J. B. Adam, “ A method for stochastic optimization, ” in International Confer ence on Learning Repr esentations (ICLR) , 2015.
Original Paper
Loading high-quality paper...
Comments & Academic Discussion
Loading comments...
Leave a Comment